The Fast Track to New Skills

Page 104

80

The Fast Track to New Skills

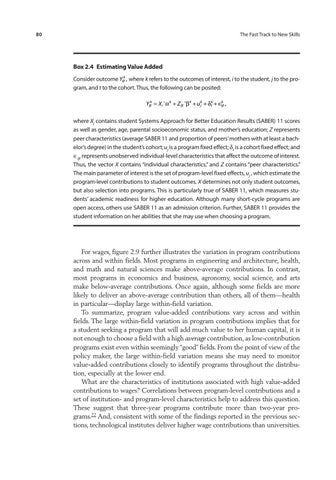
Box 2.4  Estimating Value Added Consider outcome Yijtk , where k refers to the outcomes of interest, i to the student, j to the program, and t to the cohort. Thus, the following can be posited: Yijtk = X i ' α k + Z ijt ' β k + u kj + δtk + ∈ijtk , where Xi contains student Systems Approach for Better Education Results (SABER) 11 scores as well as gender, age, parental socioeconomic status, and mother’s education; Z represents peer characteristics (average SABER 11 and proportion of peers’ mothers with at least a bachelor’s degree) in the student’s cohort; uj is a program fixed effect; δt is a cohort fixed effect; and ∈ijt represents unobserved individual-level characteristics that affect the outcome of interest. Thus, the vector X contains “individual characteristics,” and Z contains “peer characteristics.” The main parameter of interest is the set of program-level fixed effects, uj , which estimate the program-level contributions to student outcomes. X determines not only student outcomes, but also selection into programs. This is particularly true of SABER 11, which ­measures students’ academic readiness for higher education. Although many short-cycle programs are open access, others use SABER 11 as an admission criterion. Further, SABER 11 provides the student information on her abilities that she may use when choosing a program.

For wages, figure 2.9 further illustrates the variation in program contributions across and within fields. Most programs in engineering and architecture, health, and math and natural sciences make above-average contributions. In contrast, most programs in economics and business, agronomy, social science, and arts make below-average contributions. Once again, although some fields are more likely to deliver an above-average contribution than others, all of them—health in particular—display large within-field variation. To summarize, program value-added contributions vary across and within fields. The large within-field variation in program contributions implies that for a student seeking a program that will add much value to her human capital, it is not enough to choose a field with a high average contribution, as low-­contribution programs exist even within seemingly “good” fields. From the point of view of the policy maker, the large within-field variation means she may need to monitor value-added contributions closely to identify programs throughout the distribution, especially at the lower end. What are the characteristics of institutions associated with high value-added contributions to wages? Correlations between program-level contributions and a set of institution- and program-level characteristics help to address this question. These suggest that three-year programs contribute more than two-year programs.22 And, consistent with some of the findings reported in the previous sections, technological institutes deliver higher wage contributions than universities.

Turn static files into dynamic content formats.

Create a flipbook

Articles inside

References

8min
pages 211-217

Notes

2min
page 210

5.7 Flexible Academic Pathways in the United States

7min
pages 204-206

5.6 Oversight and Regulation Reform: Recent Attempts in LAC

2min
page 202

Skill Development Pathways

2min
page 203

Institutions in the United States

2min
page 201

Funding

4min
pages 195-196

Oversight and Regulation

7min
pages 198-200

5.3 What Do We Know about Information Interventions?

4min
pages 193-194

Information

5min
pages 191-192

Education in LAC

2min
page 190

Education Markets?

5min
pages 188-189

4.3 Quality Determinants and Value Added: The Case of Brazil

5min
pages 170-171

References

4min
pages 181-184

Notes

4min
pages 179-180

Graduates’ Wages

2min
page 169

4A.2 Summary of Results B5.4.1 Net Present Value of SCPs, from the Policy

1min
page 176

Formal Employment

4min
pages 167-168

Extra Time to Degree

4min
pages 165-166

A LASSO-Regression Approach

5min
pages 162-163

Dropout Rates

1min
page 164

and Student Outcomes

2min
page 161

SCPs in Colombia

9min
pages 157-160

4.1 Student Academic Outcomes, by Country

2min
page 152

Defining and Measuring SCP Quality

4min
pages 150-151

References

1min
page 146

Notes

2min
page 145

Conclusions

2min
page 144

3.2 Two Market Paradigms: Colombia and Chile

2min
page 120

3.23 Activities to Support Students’ Job Search

2min
page 141

Notes

4min
pages 111-112

Conclusions

2min
page 110

References

5min
pages 113-116

by Country

2min
page 107

Overall and by Field of Study

2min
page 105

Contribution (Value Added) of SCPs Demand for SCP Graduates: Exploiting

2min
page 103

Expanding the Supply of SCPs: Who Would Benefit and Why?

5min
pages 100-101

2.4 Estimating Value Added

2min
page 104

Economic Value of SCPs in LAC

2min
page 89

2.2 Estimating Mincerian Returns

2min
page 90

What Do We Know?

7min
pages 86-88

2.1 Sources of Information

4min
pages 84-85

References

1min
page 82

Conclusions

2min
page 76

Critical Institutional Aspect: Funding

2min
page 68

Notes

4min
pages 80-81

and of High School Graduates, circa 2018

4min
pages 65-66

1.2 Fundamental Data Source: SEDLAC

5min
pages 62-64

circa 2018

2min
page 67

1.1 Short-Cycle Programs in the United States and Germany

2min
page 60

Framework of the Book

2min
page 53

O.1 In LAC, Students in SCPs Are More Disadvantaged and Less Traditional Than Those in Bachelor’s Programs

2min
page 30

Policy to Realize the Potential of SCPs

4min
pages 43-44

I.1 Some Technical Aspects of the World Bank Short-Cycle Program Survey

2min
page 51

World Bank Short-Cycle Program Survey

2min
page 50

O.4 On Average, SCPs in LAC Have Good Curriculum, Infrastructure, and Faculty—but with Much Variation

4min
pages 39-40

BI1.1 Universes, Samples, and Response Rates, by Country

2min
page 52

Introduction

4min
pages 47-48
Issuu converts static files into: digital portfolios, online yearbooks, online catalogs, digital photo albums and more. Sign up and create your flipbook.