FY 2025 ANNUAL REPORT
July 1, 2024 – June 30, 2025
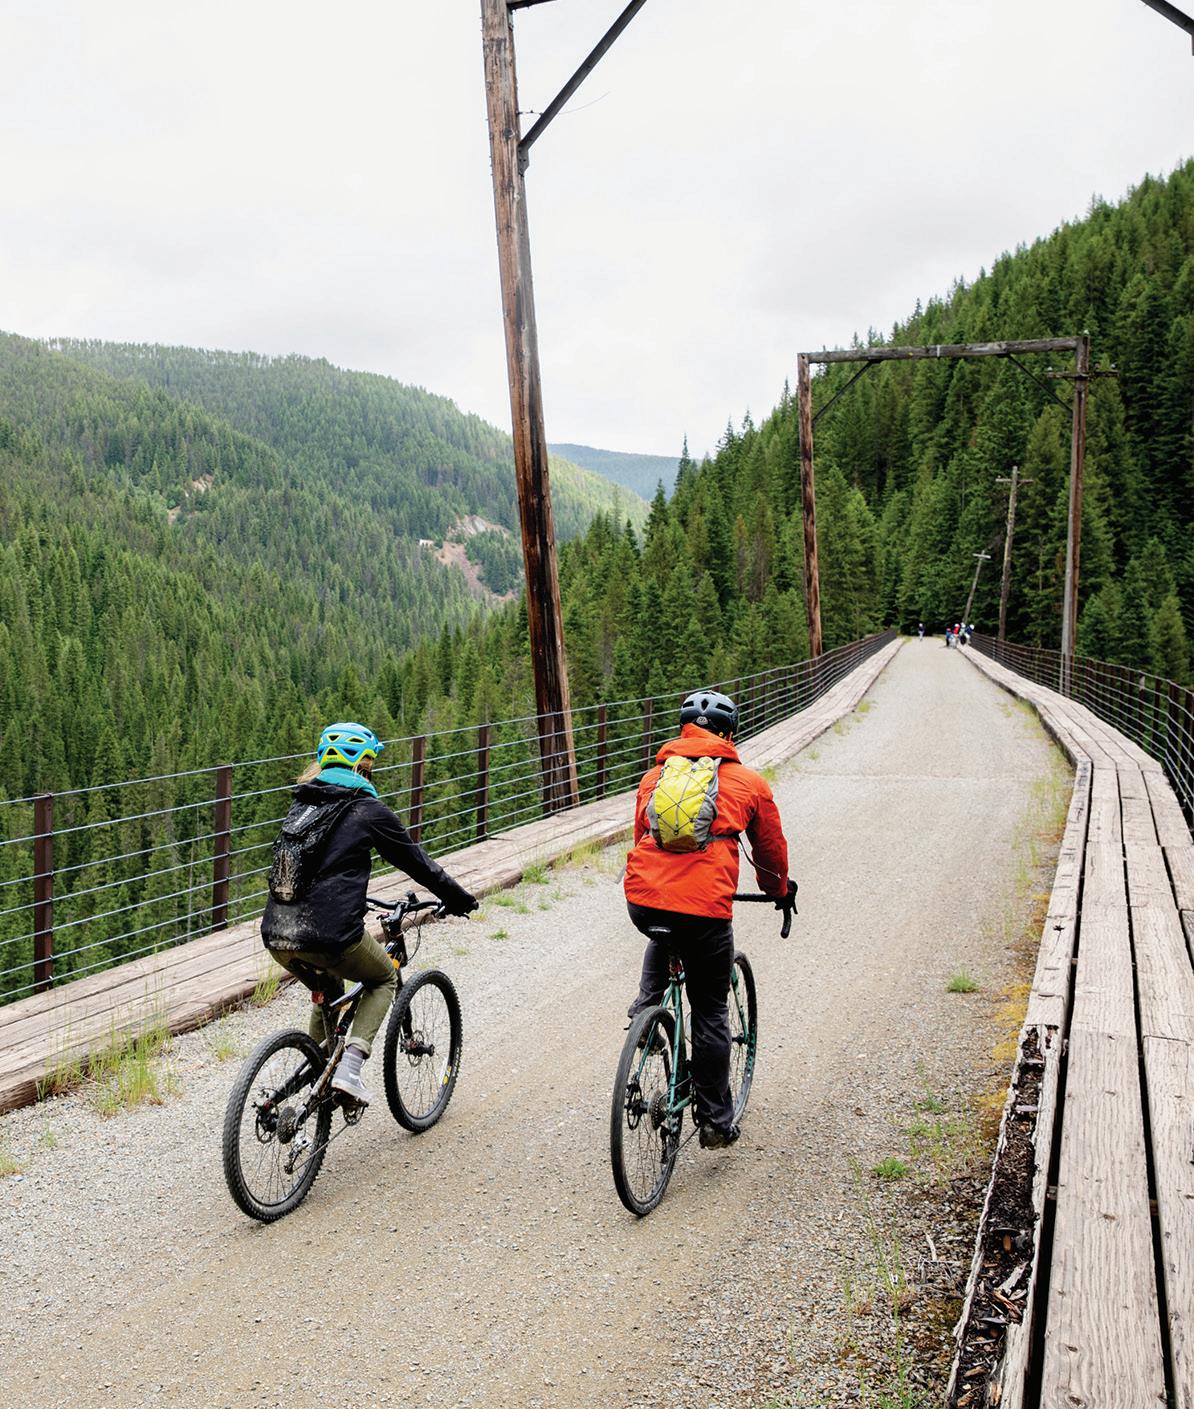
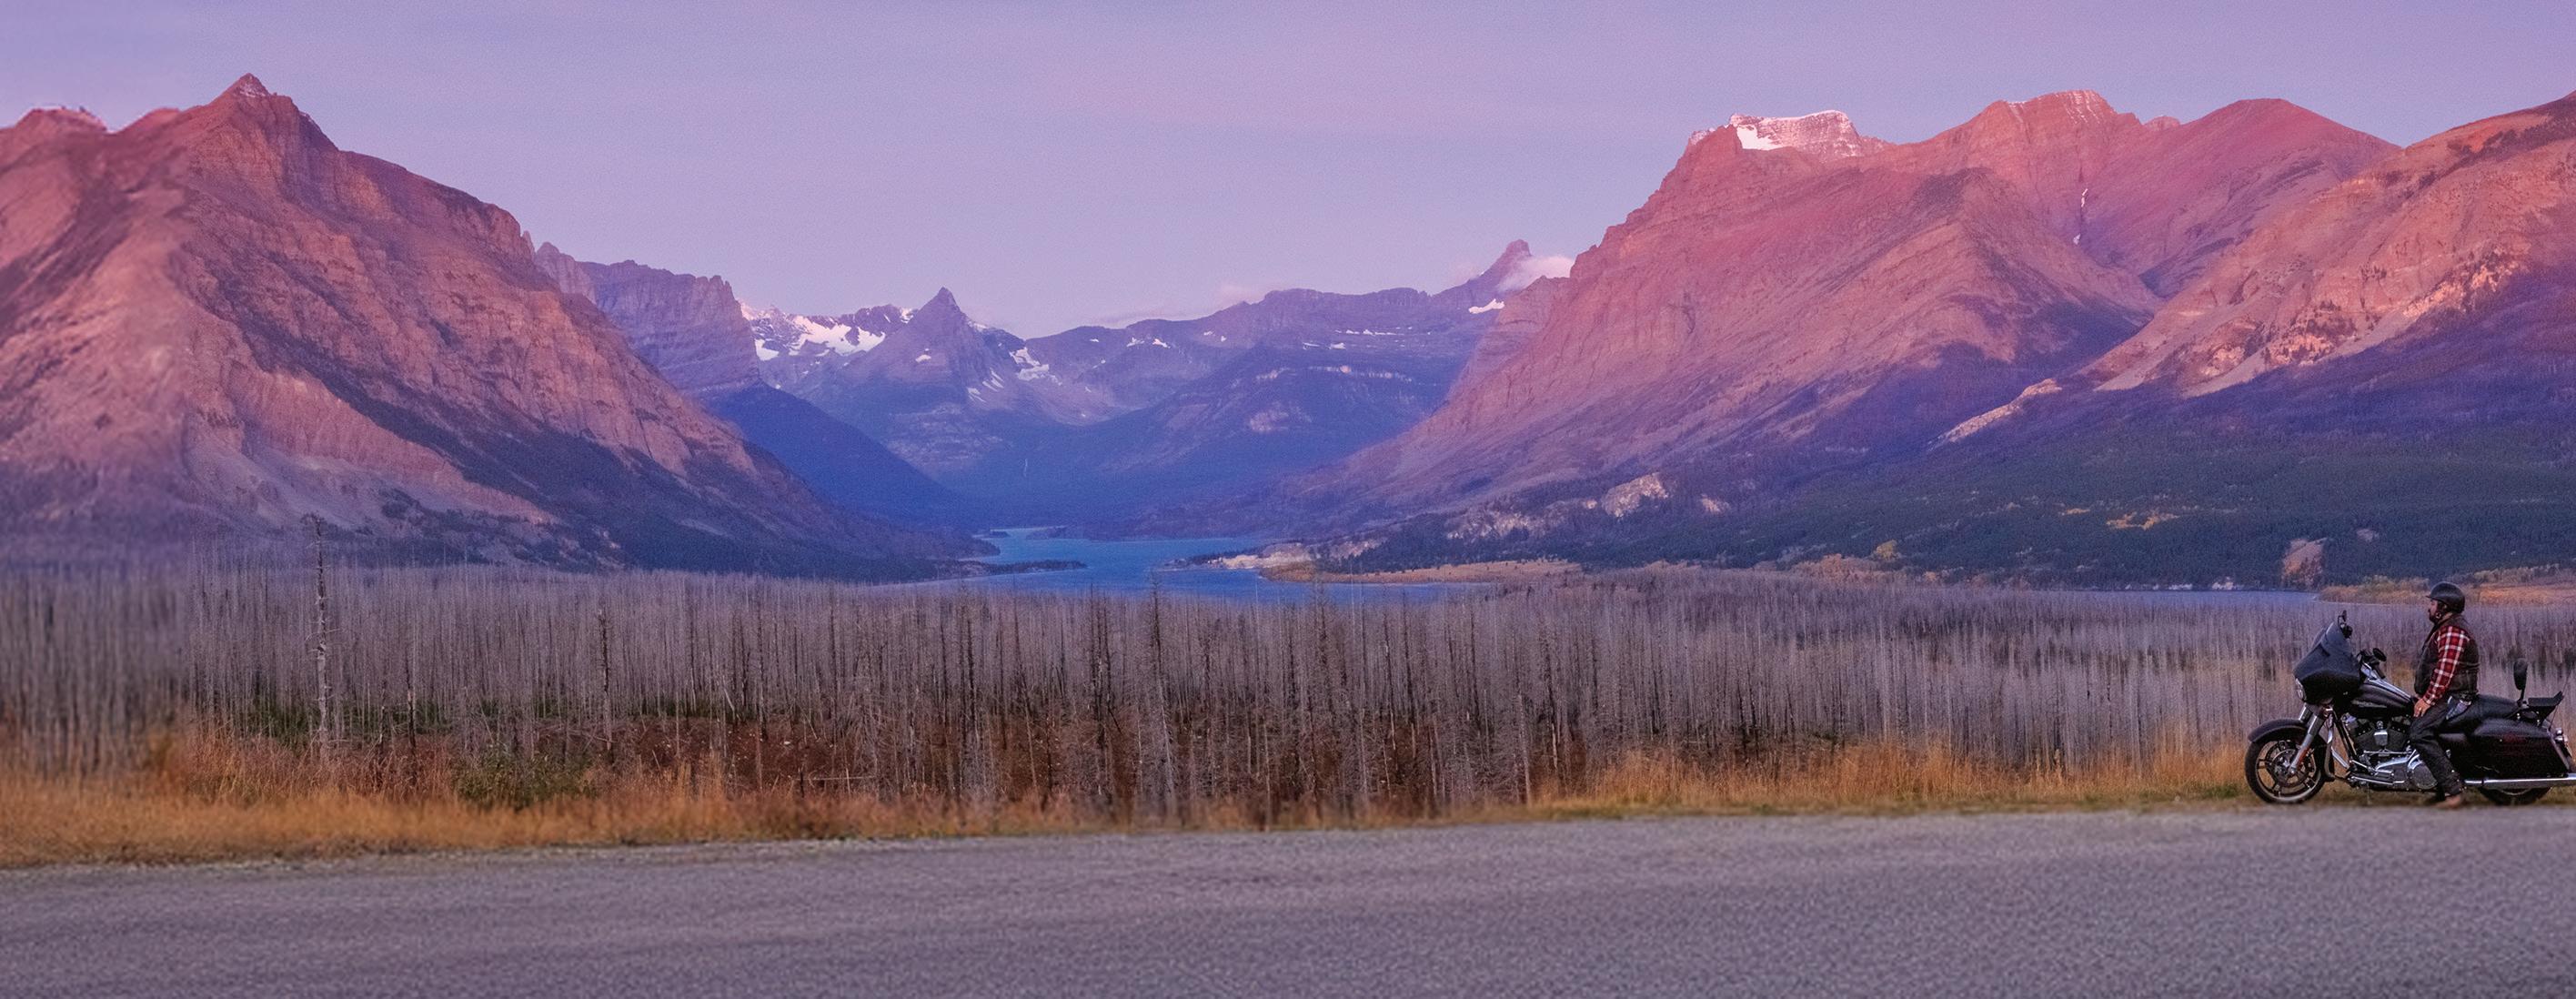
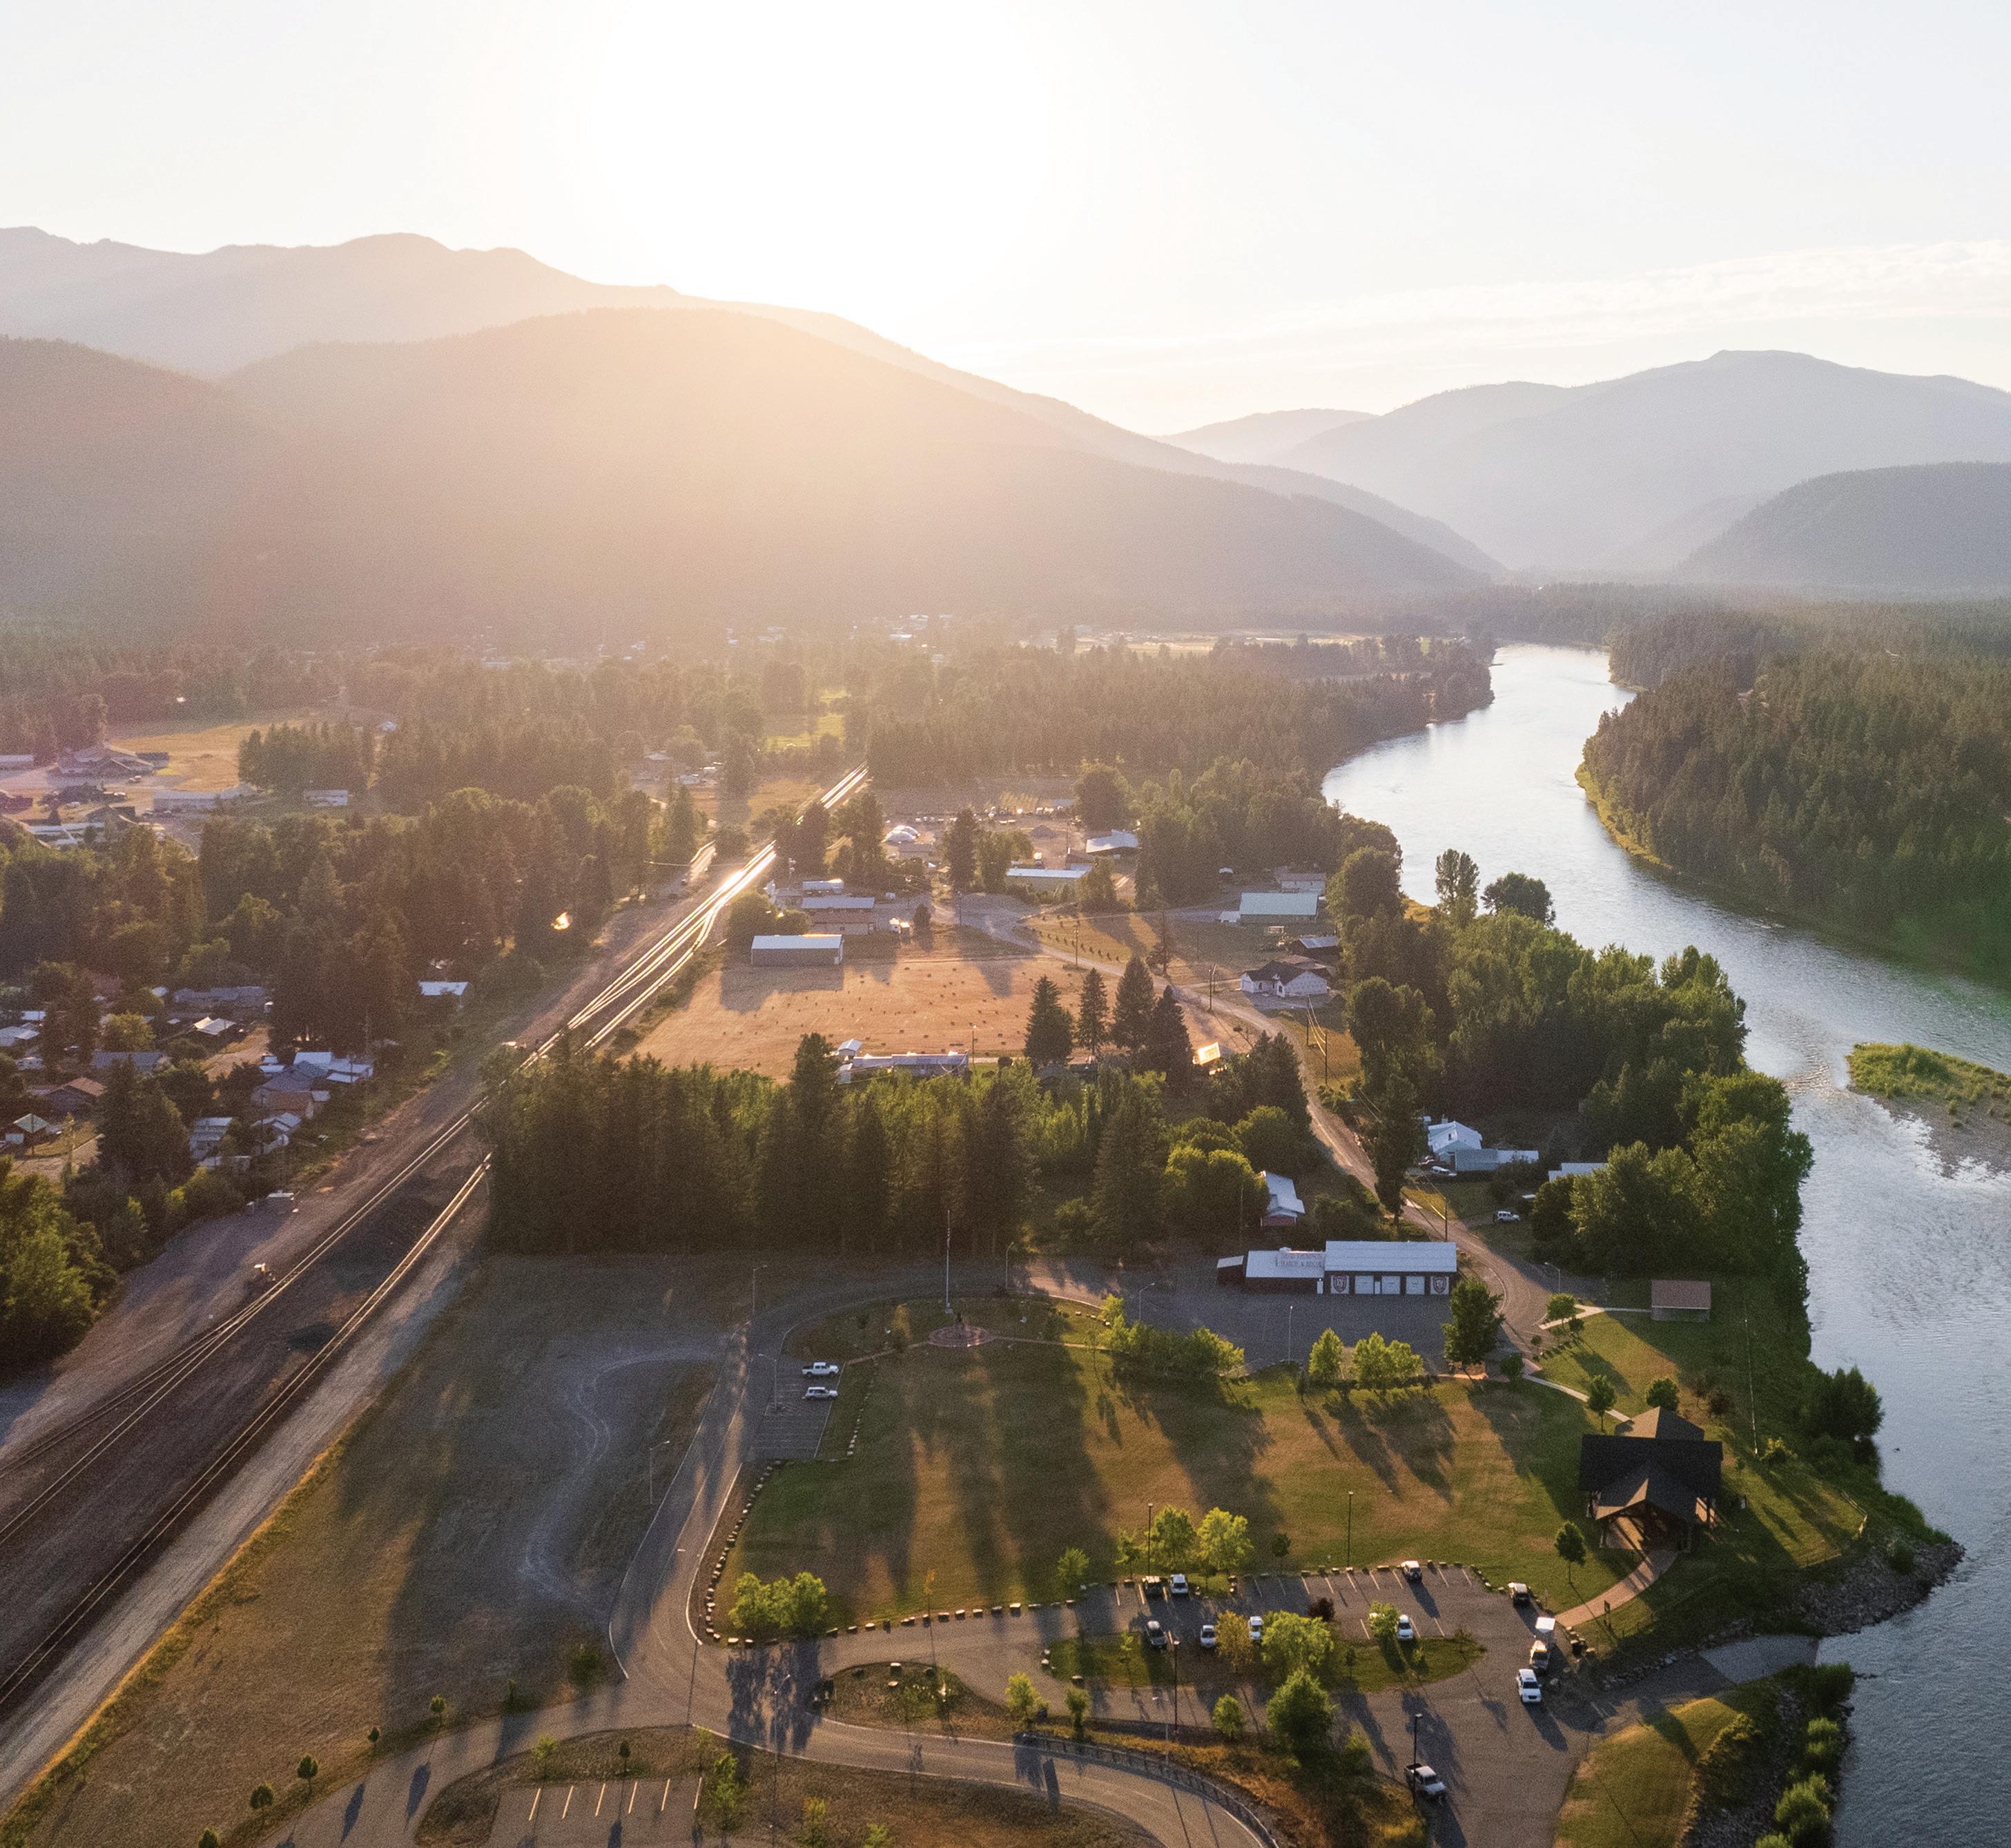
Route of the Hiawatha Scenic Bike Trail. © ANDY AUSTIN
FY 2025 ANNUAL REPORT
July 1, 2024 – June 30, 2025
FY 2025 marked a year of strategic growth and adaptation as destination organizations nationwide navigated an unprecedented convergence of opportunities and challenges While the tourism industry faced significant headwinds—including AI-driven shifts in search behavior, Google Analytics platform transitions, evolving privacy regulations and federal spending cuts impacting meetings markets—Montana-specific opportunities still emerged. International policy changes also affected visitor travel, and trade tensions contributed to a 28.6% decline in Canadian border crossings. At the same time, strong regional airport growth (MSO up 12.7%, FCA up 13%), successful industry collaboration and advocacy efforts and positive resident sentiment trends (8% increase in acknowledging the benefits of tourism) helped offset those challenges.
For Western Montana’s Glacier Country specifically, these dynamics intersected with regional priorities, including Glacier National Park stewardship, community needs across eight diverse counties and the imperative to balance economic development with resident well-being. The organization responded by achieving significant milestones in marketing reach (40% website growth, $6.6 million in earned media), partnership development (1,386 active partners), targeted Canadian marketing campaigns and destination stewardship monitoring, while adapting measurement approaches to acknowledge that traditional target-based frameworks proved unreliable during this period of technological and regulatory disruption
The projects and programs detailed in this report were funded through a combination of private, public and grant funding sources, enabling comprehensive destination marketing, management, stewardship and development activities across the eight-county region.
This year required a shift from traditional target-based measurement to observation-based monitoring. External factors, including the impact of AI on search behavior, changes to the Google Analytics platform, and the evolution of privacy laws, created volatility in digital metrics that rendered predetermined percentage targets unreliable Rather than measuring against potentially arbitrary goals, FY 2025 focused on observing patterns, understanding context and documenting outcomes within the broader changing landscape
1,953,062 unique sessions
+ Grew website traffic 40% with 20% organic growth, 42% increase in new users and 57% engagement rate
$6.6M earned media value
+ Achieved through strategic partnerships and storytelling
1.06% click-through rate
+ Delivered 106 7 million paid media impressions
$18.5M potential economic impact from meeting RFPs
+ Generated 412 new B2B leads for meetings and group tours
1,386 active partners
+ Grew partnership base, representing sustained industry collaboration
+ Monitored comprehensive stewardship metrics, including resident sentiment, housing affordability, workforce trends and visitor impacts
+ Tracked county-level performance data across all eight Glacier Country counties to inform localized strategies
The marketing, communications and tourism sales program employed an integrated approach across owned, earned and paid media channels, combined with direct B2B outreach, to reach target audiences throughout the customer journey
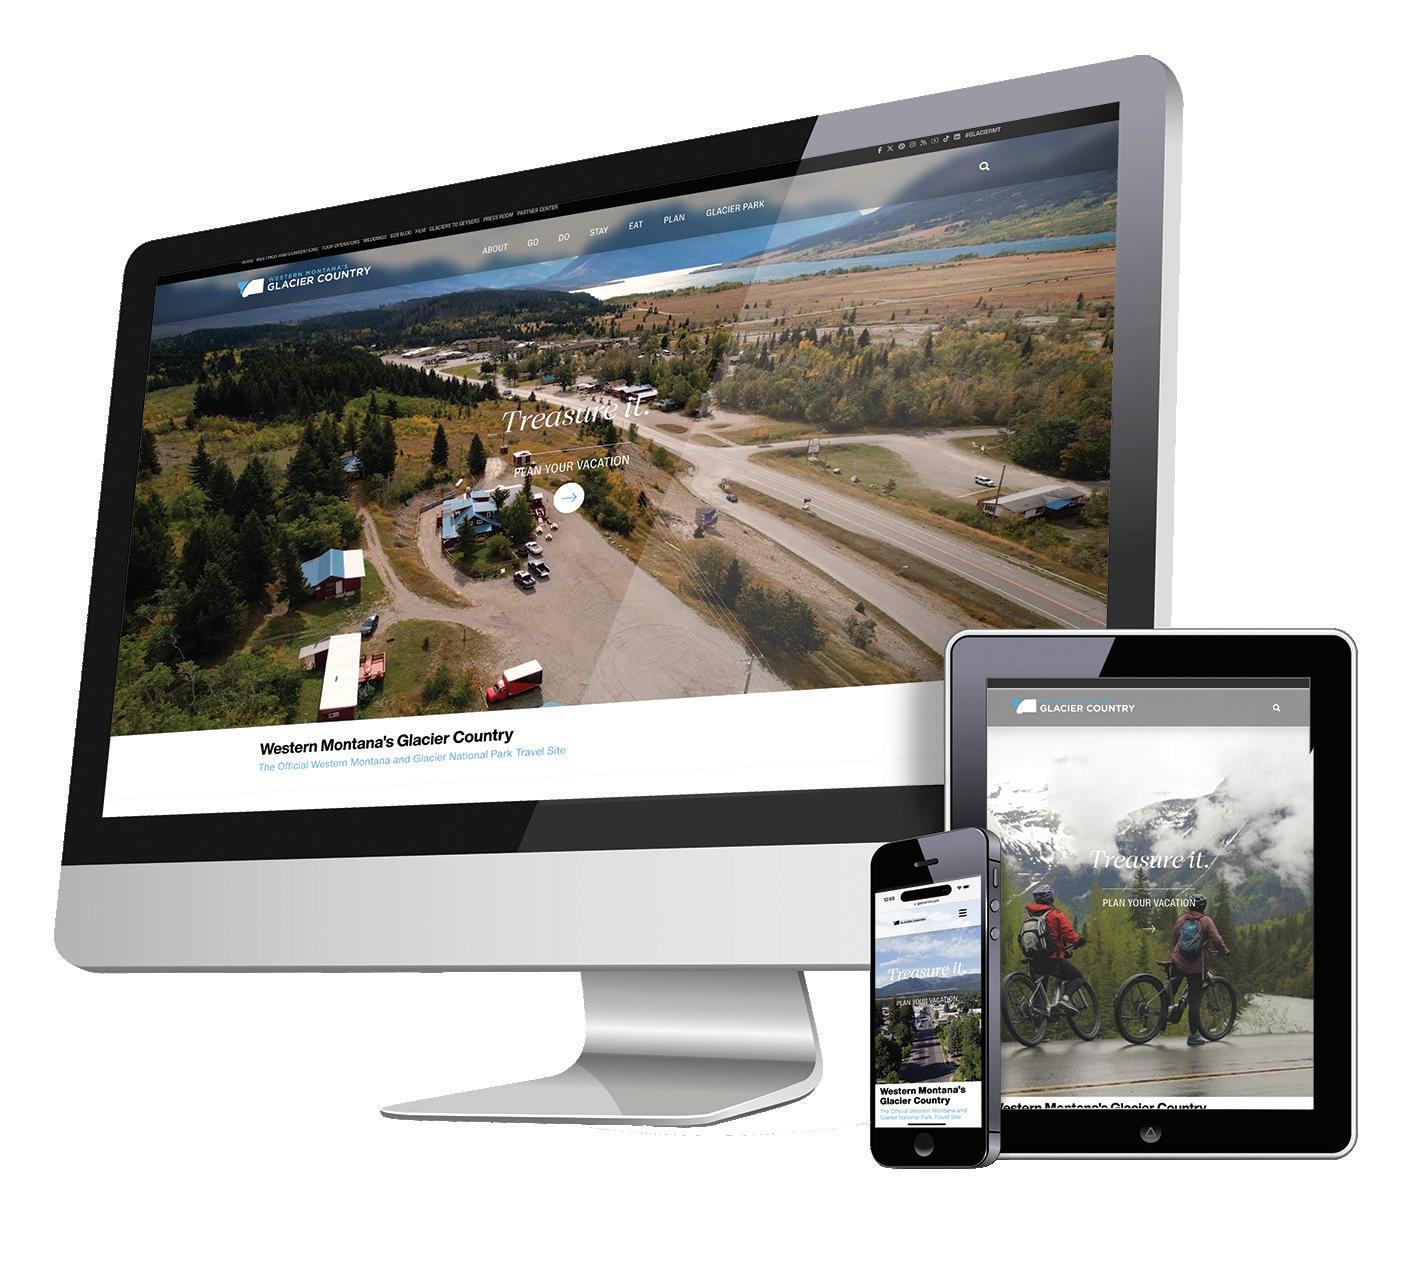
+ Maintained a responsive website with seasonal content and trip-planning tools
+ Developed blog content highlighting destination experiences and responsible recreation
+ Managed social media presence across platforms
+ Launched a targeted Canadian marketing campaign in response to 28 6% decline in border crossings
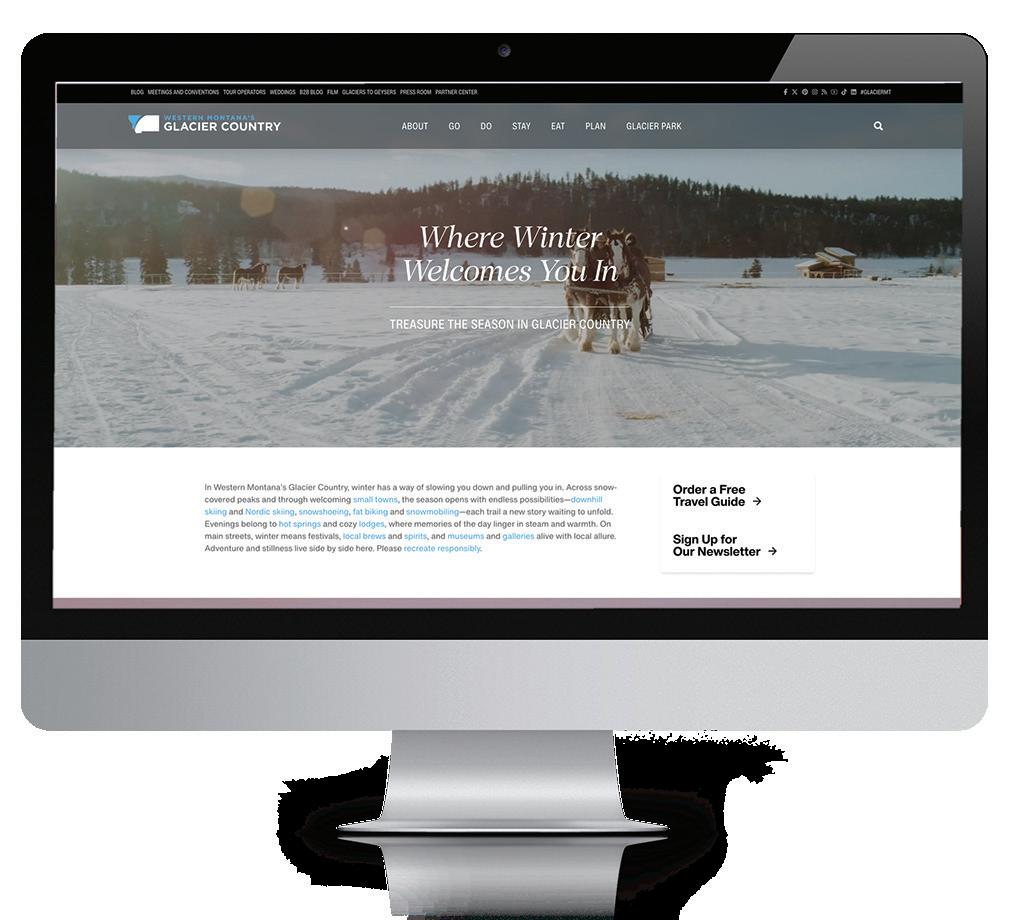

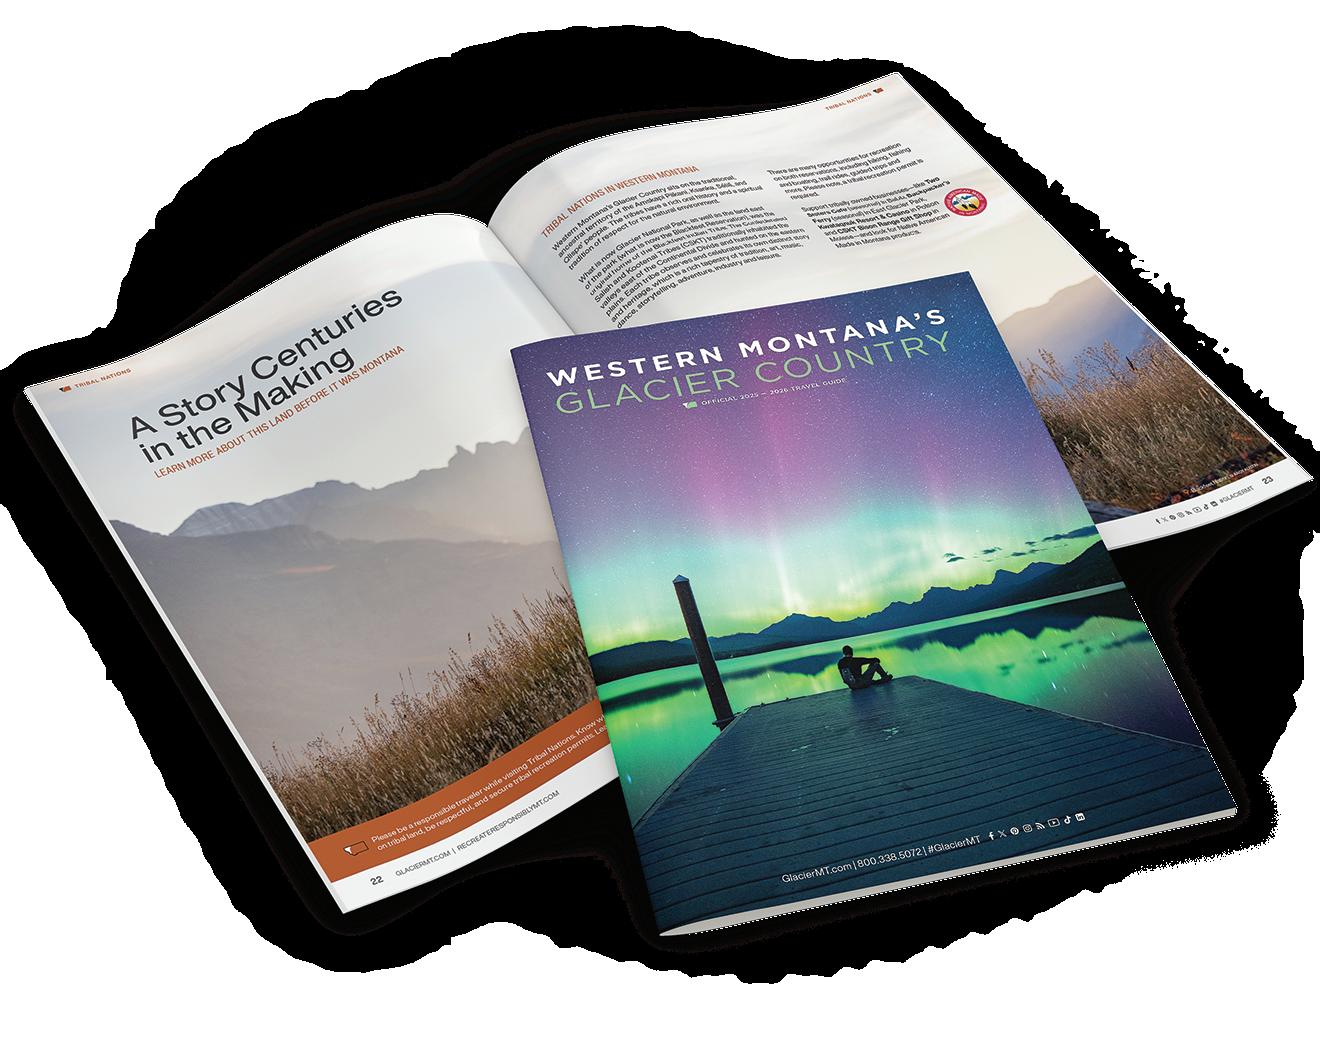
+ Provided digital travel guides and trip-planning resources
+ Produced a video guide for the Glacier National Park vehicle reservation system
40% increase unique sessions
+ Unique sessions: 1,953,062 (FY 2024: 1,398,451)
+ Organic growth: 20%
+ Average session duration: 1:33
+ Engagement rate: 57%
426,424 social media audience
+ (FY 2024: 431,998) – 1.3% decrease
+ Consumer leads database: 1,879,427 – 165,000 new
1,745,839 new users – 42% increase
232,755 unique users
+ Consumer blog: 513,846 total views
+ B2B blog: 61,228 unique users, 215,855 total views
+ Digital travel guide readership: 73,297 (FY 2024: 74,130) – stable performance
+ Executed winter and warm season campaigns across national and statewide markets
+ Deployed a multichannel approach including Meta, StackAdapt, Pinterest, CTV and programmatic
+ Targeted drive markets and key metropolitan areas
+ Implemented responsible recreation messaging
106.7 million
total impressions
+ Click-through rate: 1.06%
+ Cost per thousand impressions: $8 26
(15,612 of 287,755 counted devices) engaged with our website before visiting Western Montana
+ View-to-visit window (the average time between viewing our website and arriving in the region): 208 days for spring travelers, 191 days for winter travelers, 151 days for fall travelers, 121 days for summer travelers



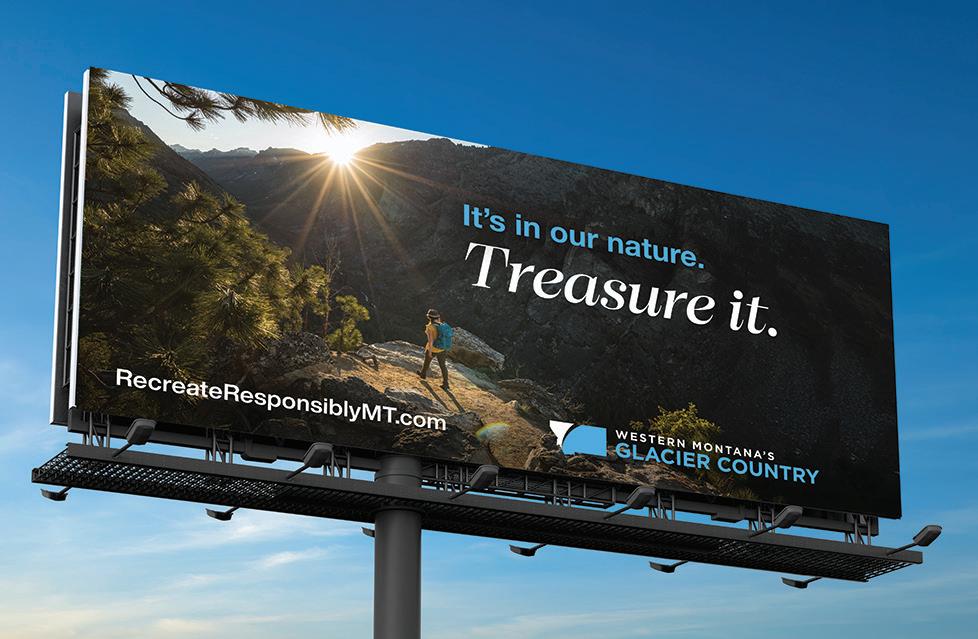
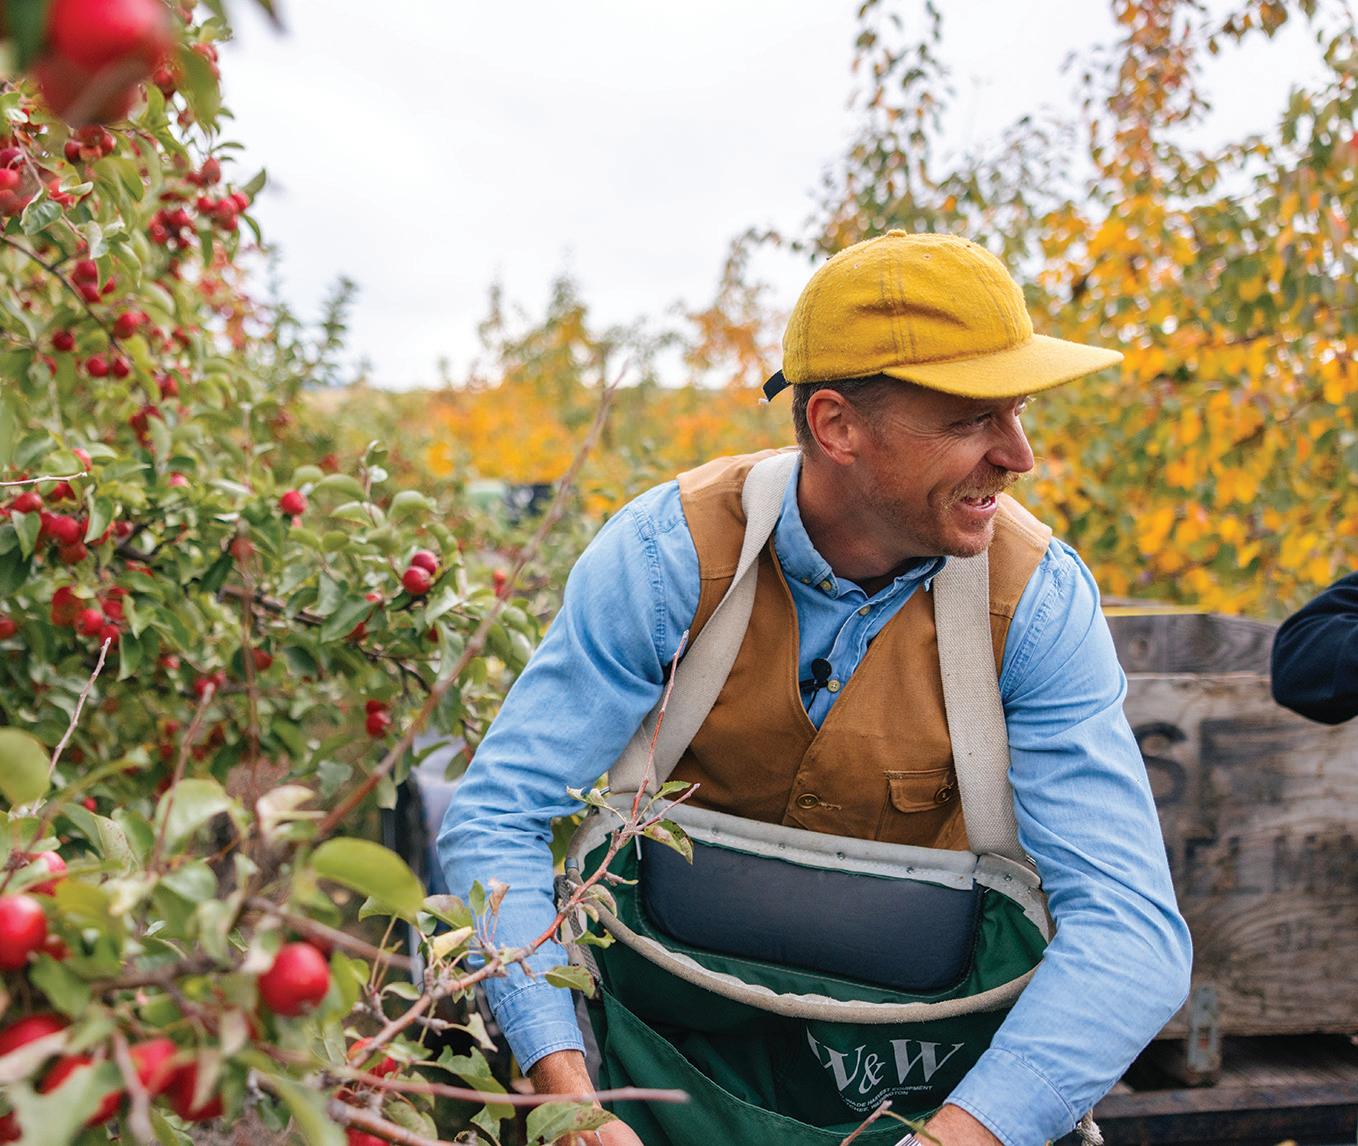
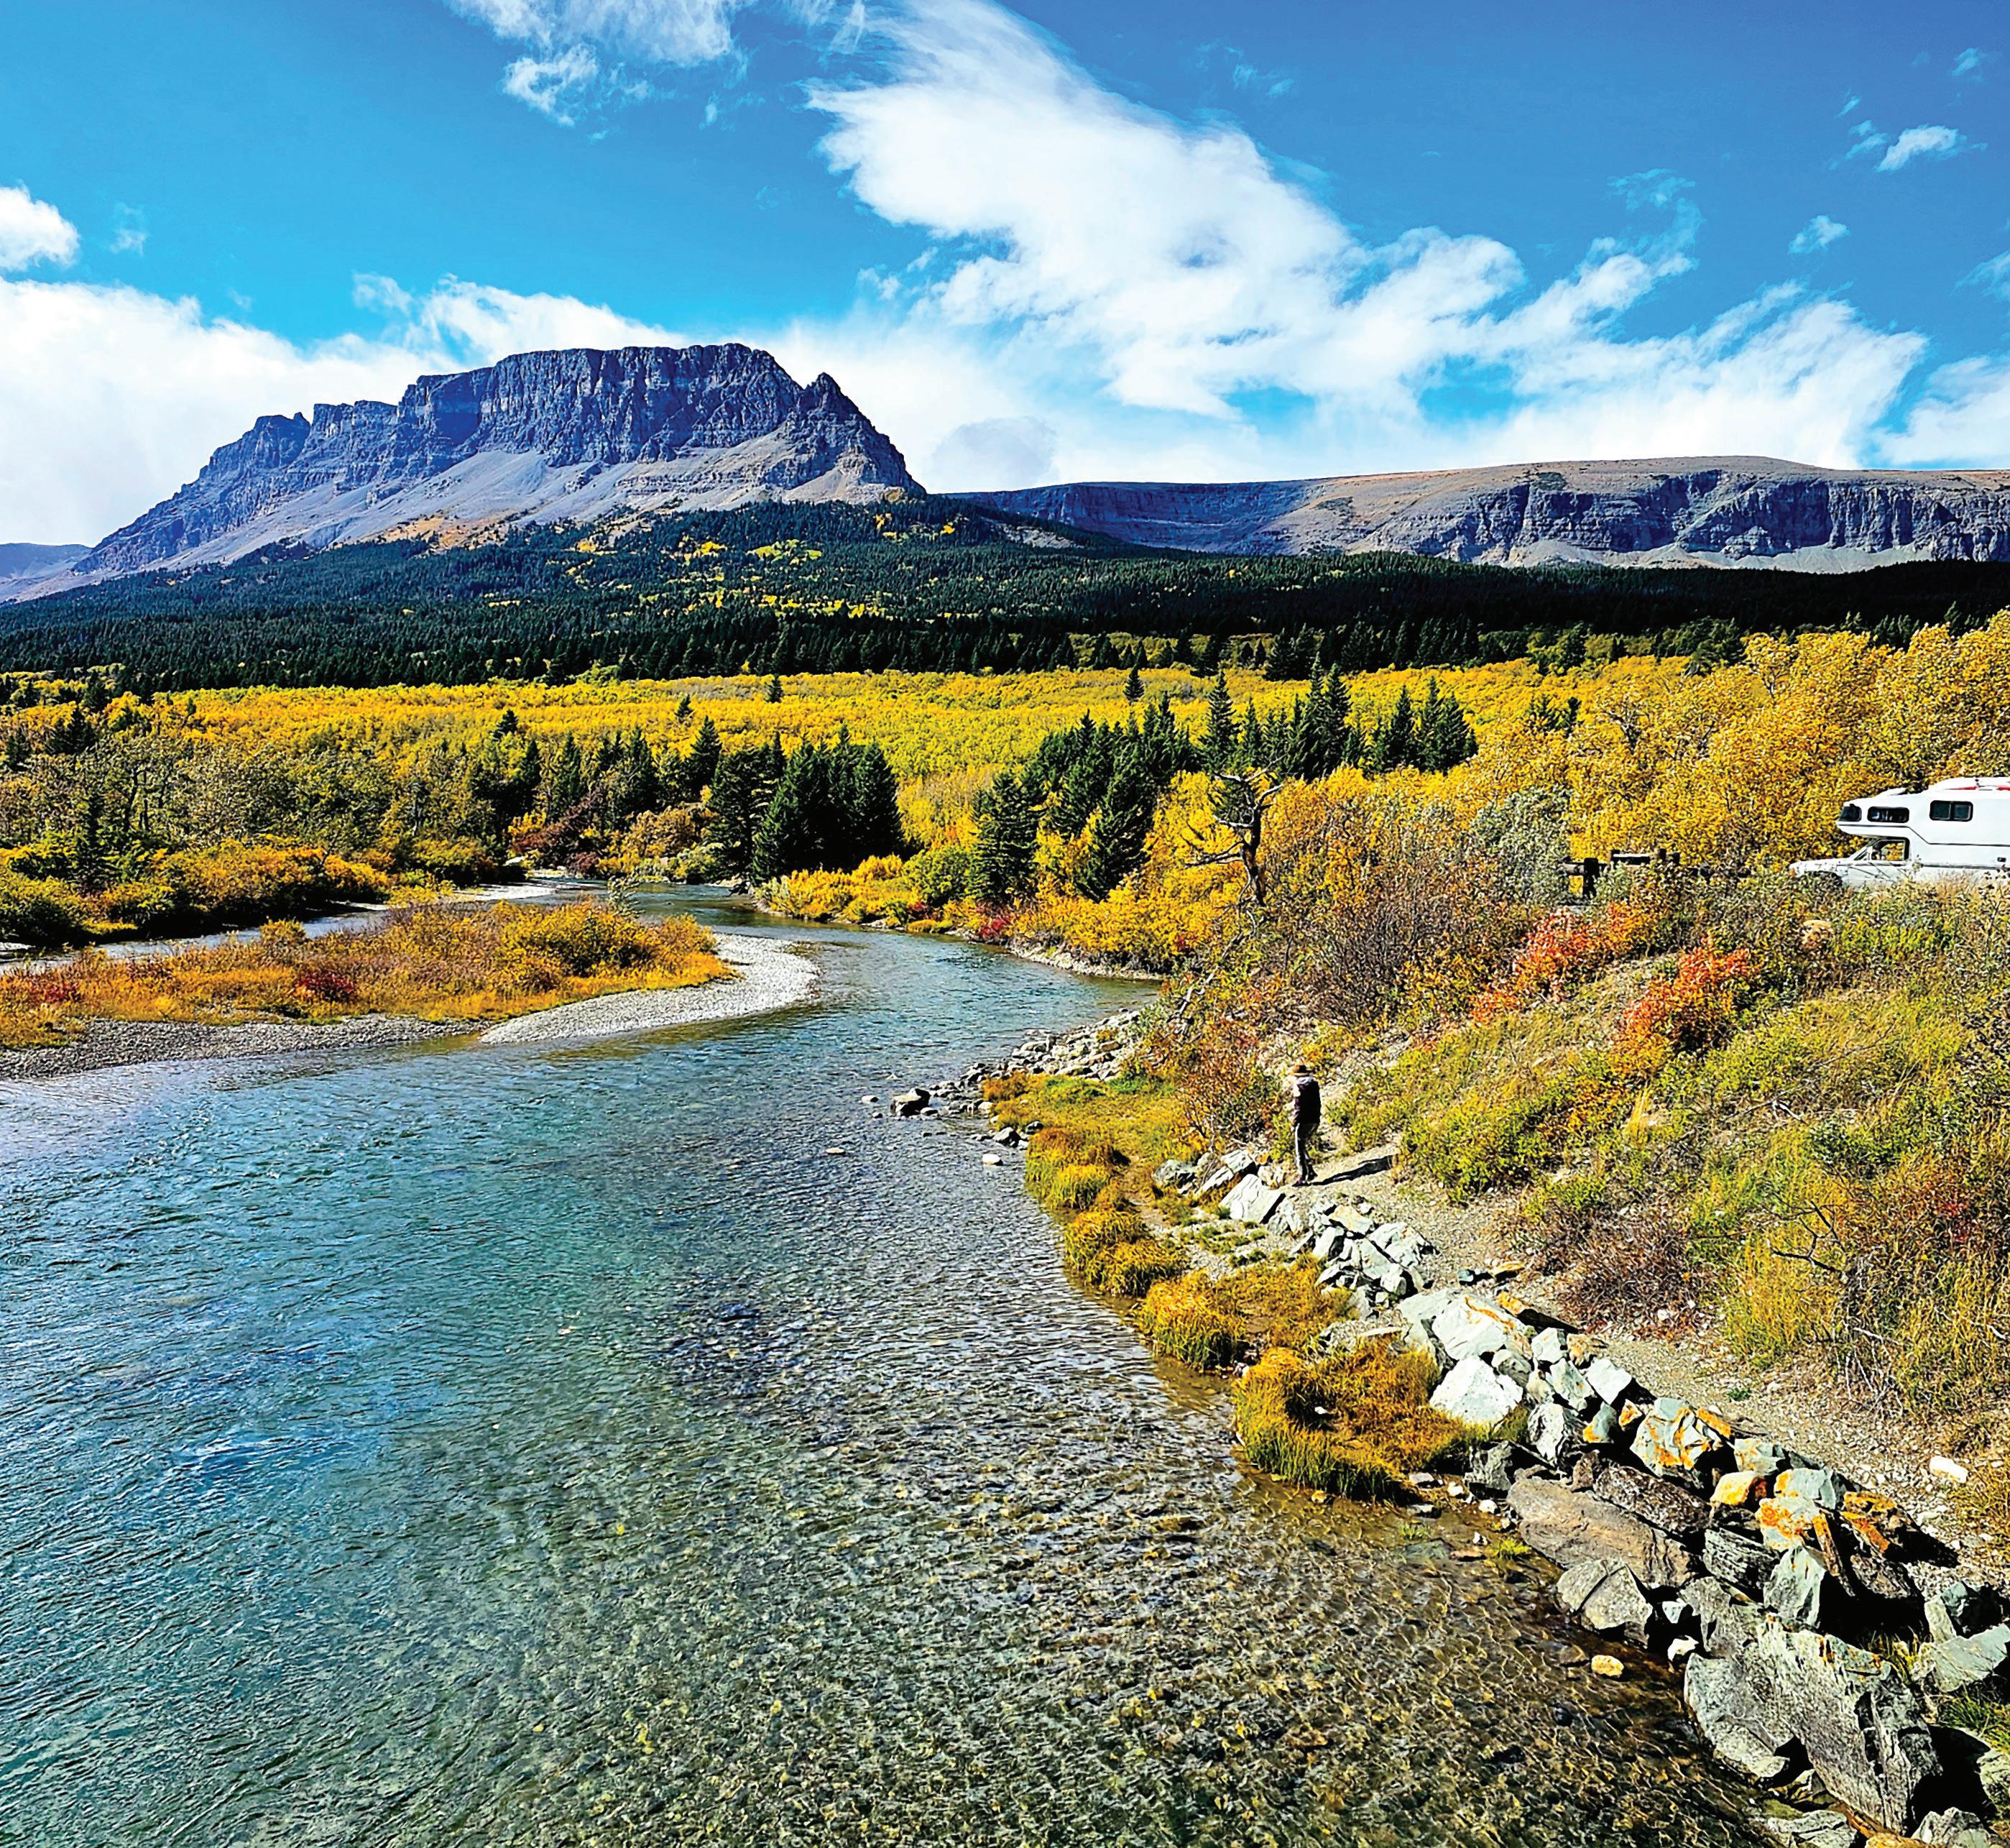
+ Hosted media familiarization tours
+ Partnered with travel writers and influencers
+ Pitched story ideas to national and international publications
+ Developed relationships with media outlets
$6,615,191
total earned media value
+ Digital and print circulation: 342,300
1 Billion
unique online visitors
+ Social media audience: 8,272,052
+ Social media reach: 4,075,977
+ Attended trade shows and industry events
+ Responded to meeting requests for proposal
+ Assisted meeting planners and group tours with destination information
+ Developed specialized content for meetings, group tours and destination weddings
412 total new B2B leads
+ Meeting sales leads: 270 (total database: 2,793)
+ Tour operator leads: 142 (total database: 1,561)
+ Meeting RFPs responded to: 52

$18.5M potential economic impact from meeting RFPs
+ Confirmed bookings: 3 (known), representing $480,580 in economic impact
+ Meeting planners directly assisted: 29
FY25 marketing and communications delivered strong integrated performance across digital, paid, earned and sales channels. Website traffic grew 40% to 1,953,062 unique sessions, with 20% organic growth, a 42% increase in new users and a 57% engagement rate—signaling the content strategy is landing with target audiences The 1 3% decrease in social media audience reflects broader platform trends rather than engagement quality, while an earned media value of $6 6 million demonstrates the multiplier effect of strategic press and influencer partnerships. The 5%

website-to-visit conversion rate validates digital marketing’s role in trip inspiration, though the extended view-to-visit windows (121–208 days) underscore the long consideration cycle inherent to destination travel and the importance of sustained top-of-funnel presence.
On the sales side, tourism sales and B2B marketing generated 412 new B2B leads and an estimated $18 5 million in potential economic impact from meetings—a strong return on trade show, RFP and direct planner engagement The 270 new meeting sales leads (database now 2,793) and 142 new group tour leads (database
1,561) reflect sustained pipeline growth across both verticals, and responding to 52 RFPs while directly assisting 29 meeting planners demonstrates clear conversion capacity Specialized content for meetings, weddings and film positioned Glacier Country in high-value niche segments. Together, the marketing and sales results validate the integrated funnel—awareness and inspiration on the consumer side, relationship-driven conversion on the B2B side—with international market expansion and deeper group tour partnerships as the clearest growth levers for FY26
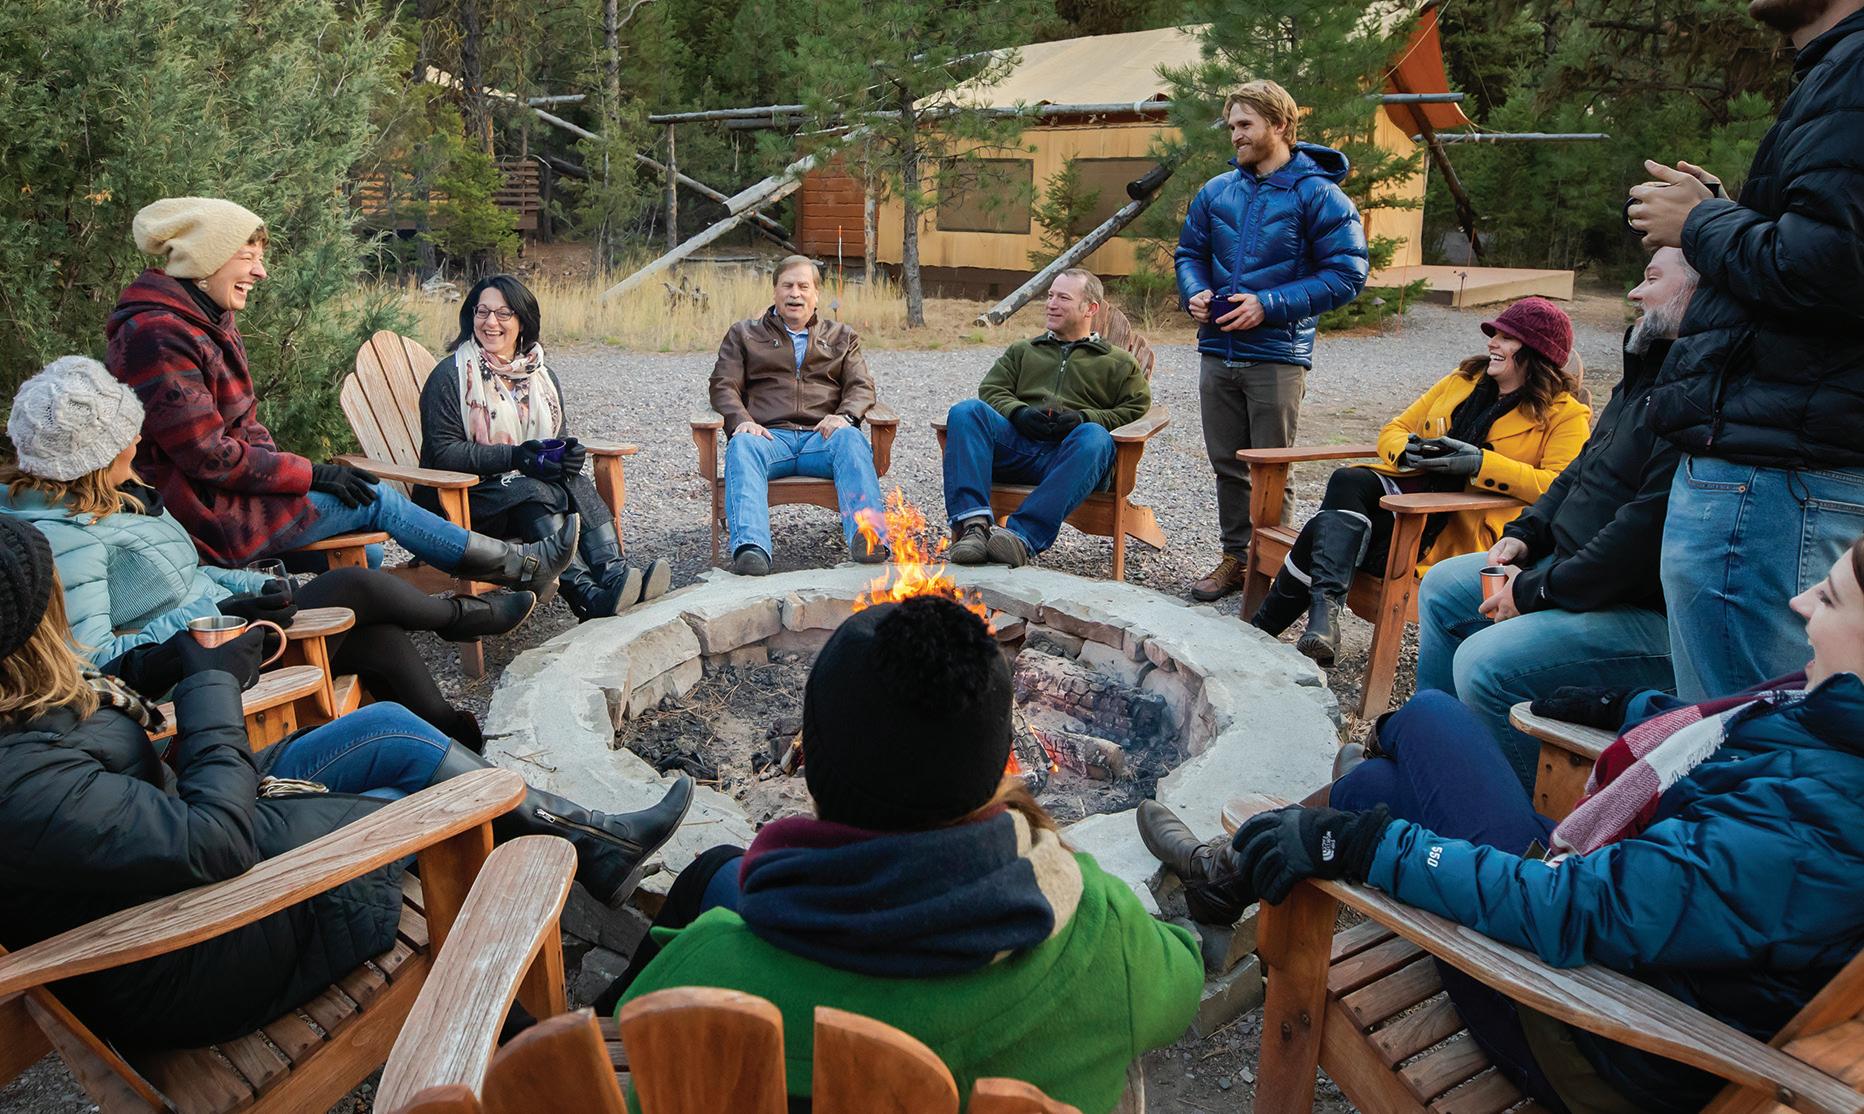

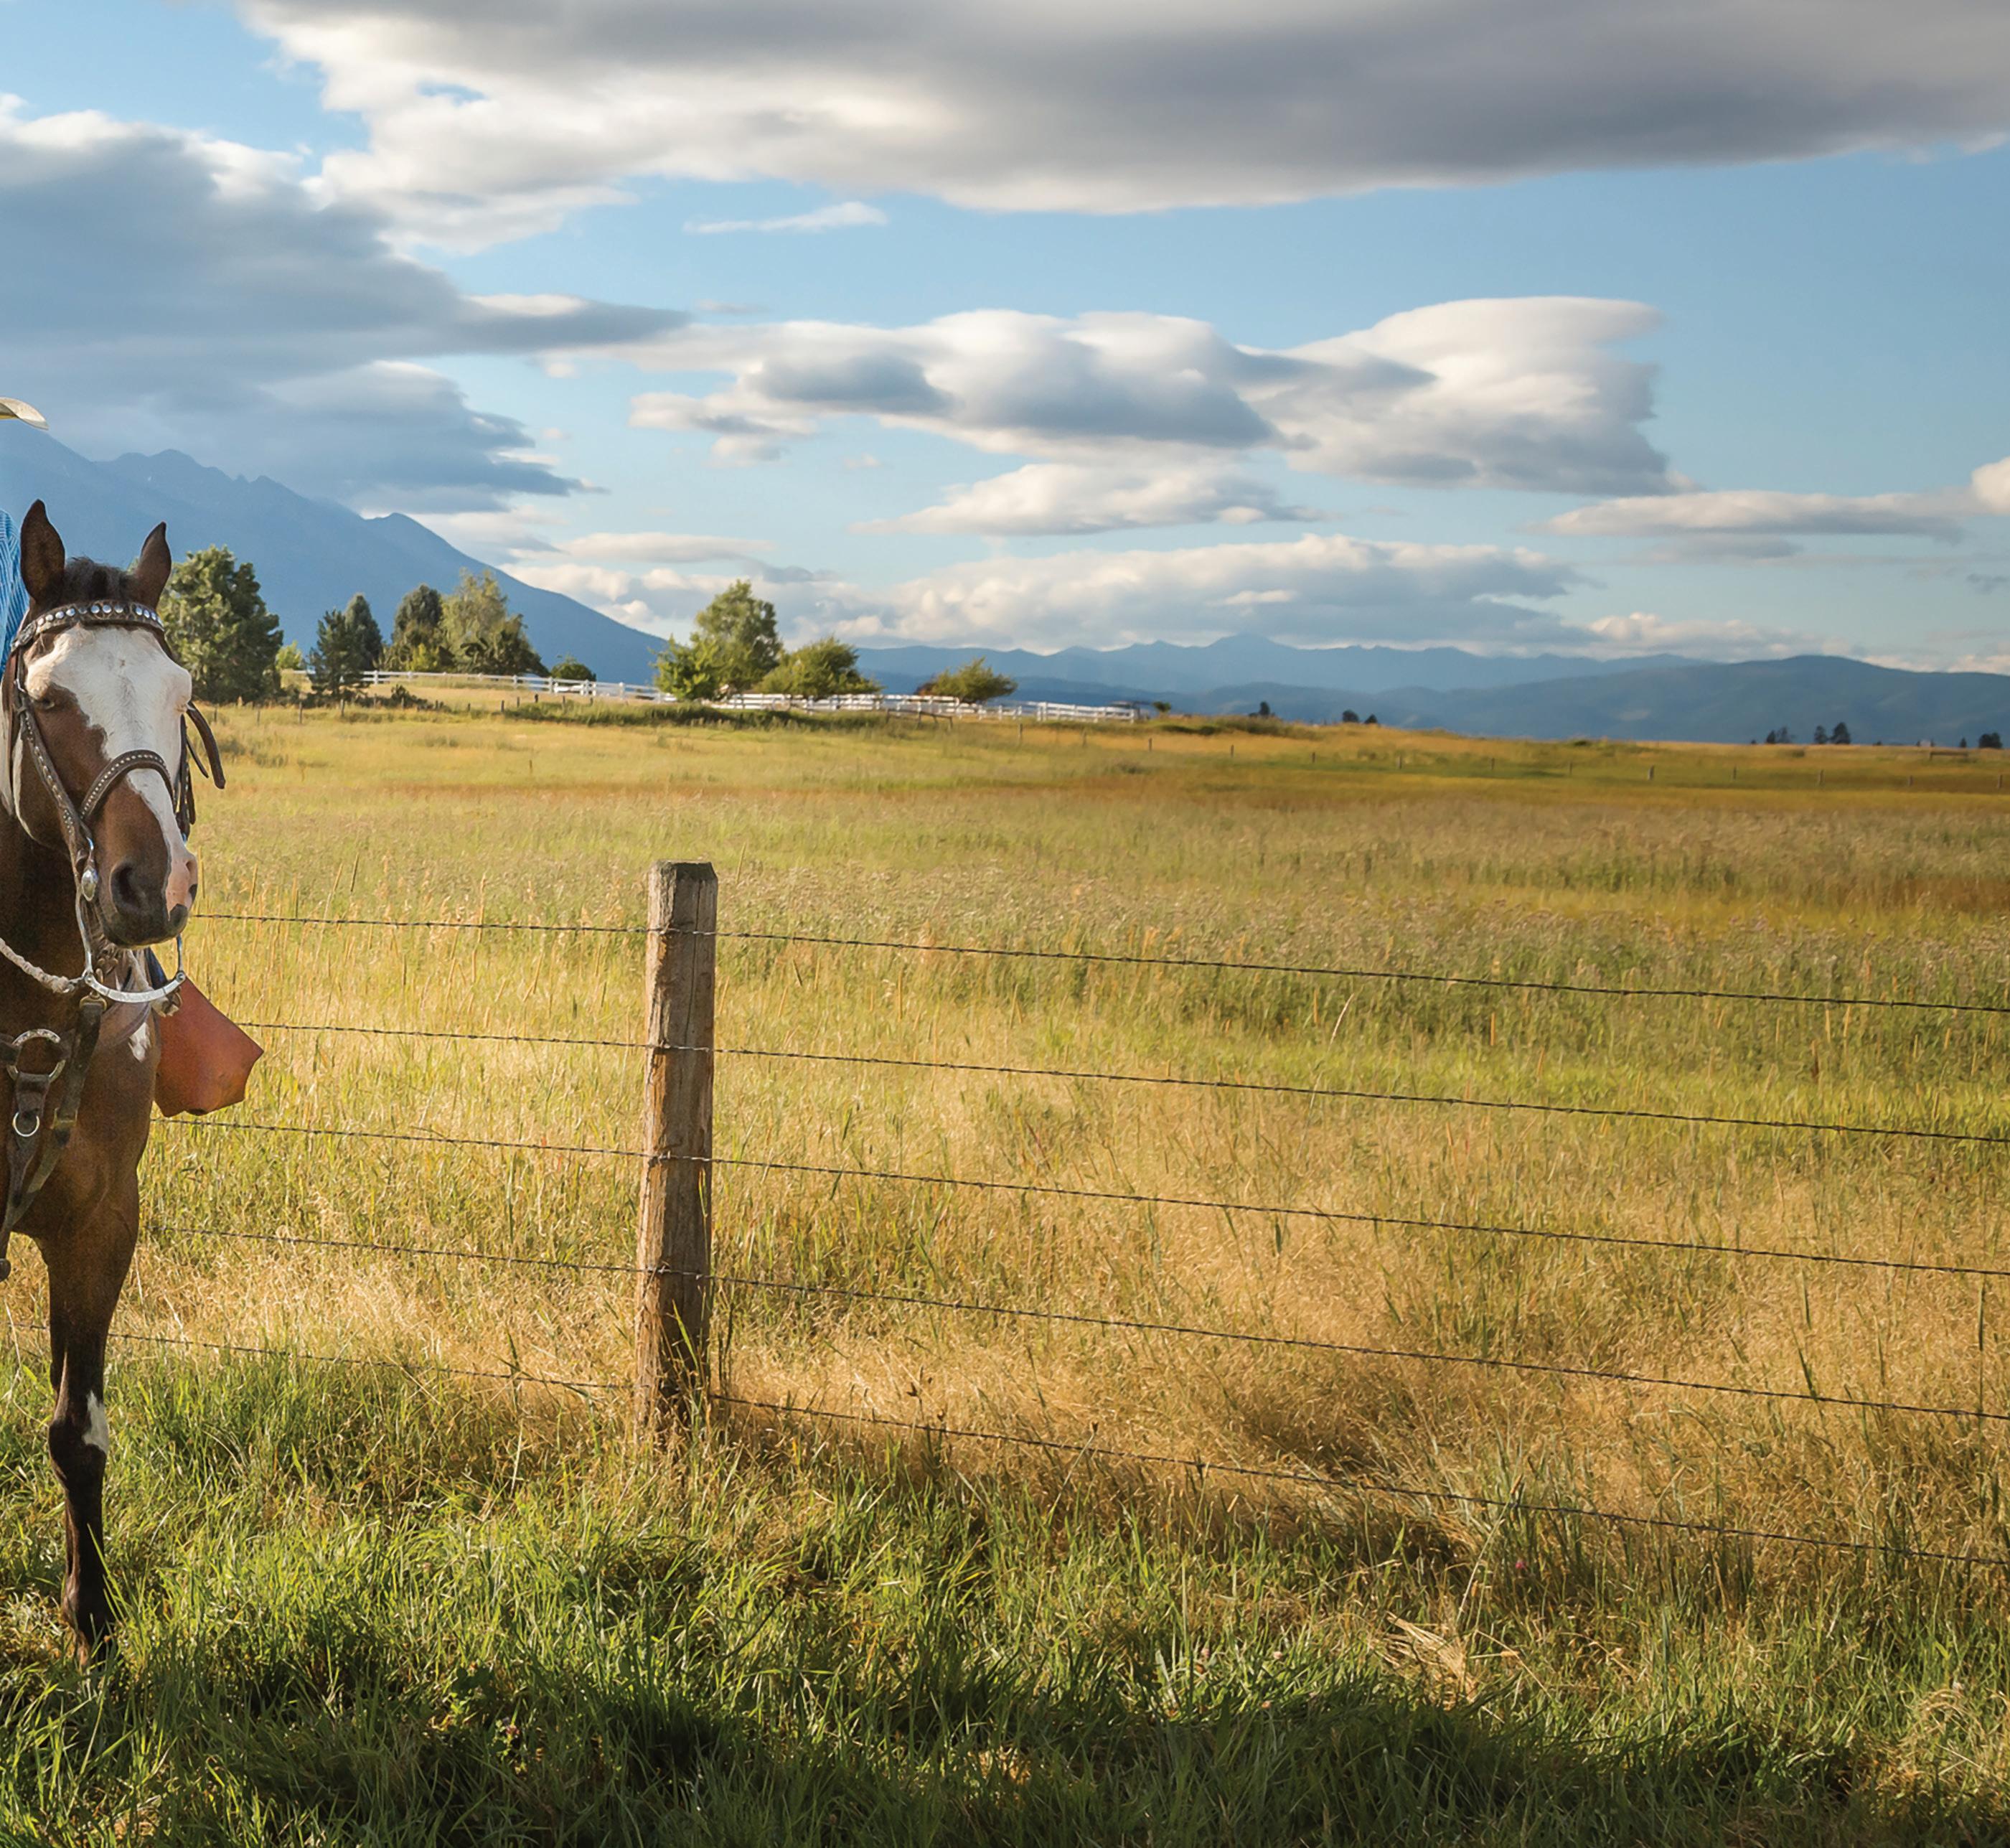
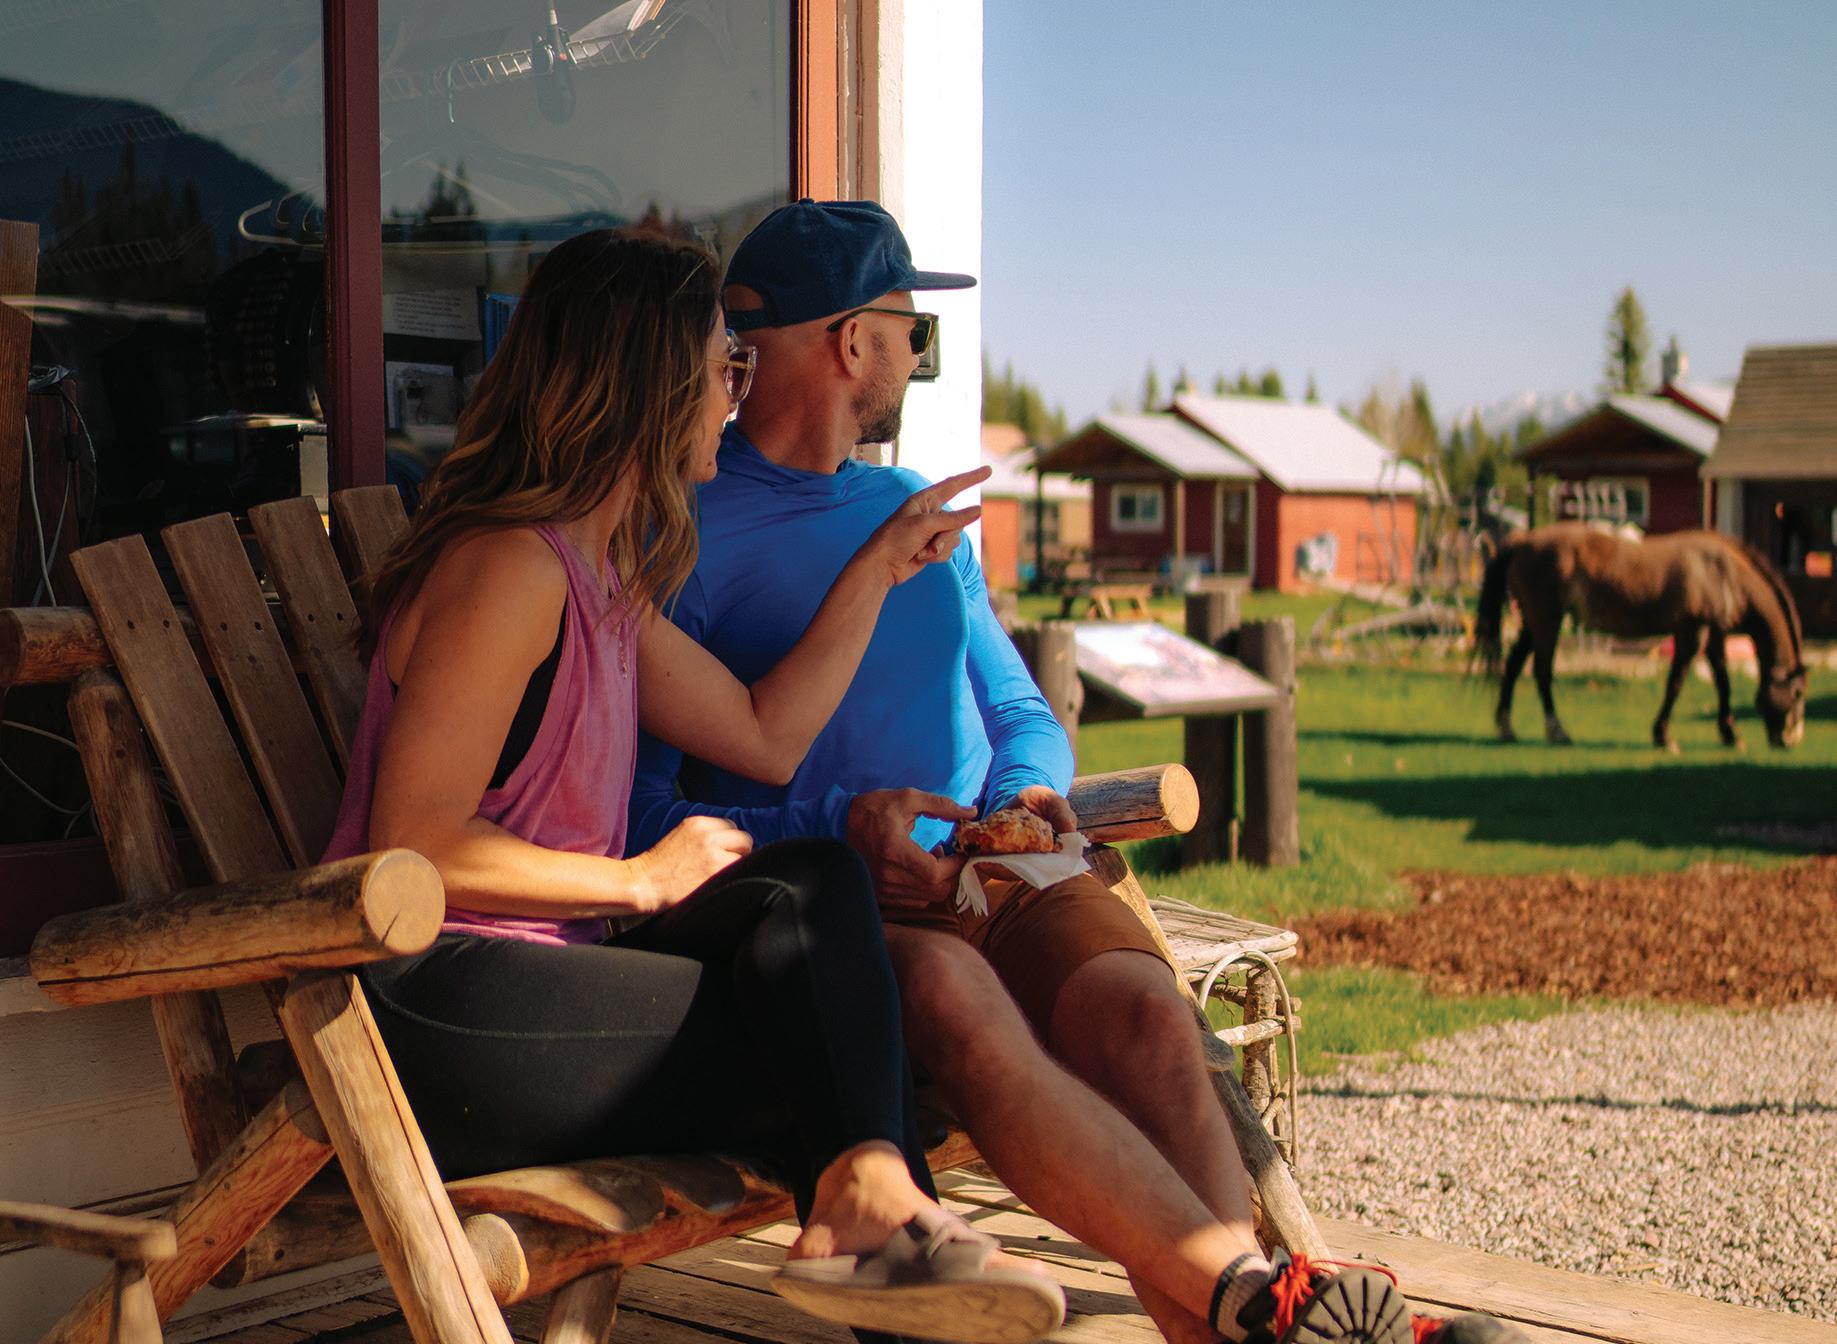
The partnership program is available to businesses and organizations that provide goods, services or travel experiences to visitors. This program offers a no-cost/ low-cost way for partners to reach the Western Montana’s Glacier Country audience through the website and other marketing tools, connecting tourism businesses, communities and public land managers in collaborative destination marketing and stewardship efforts

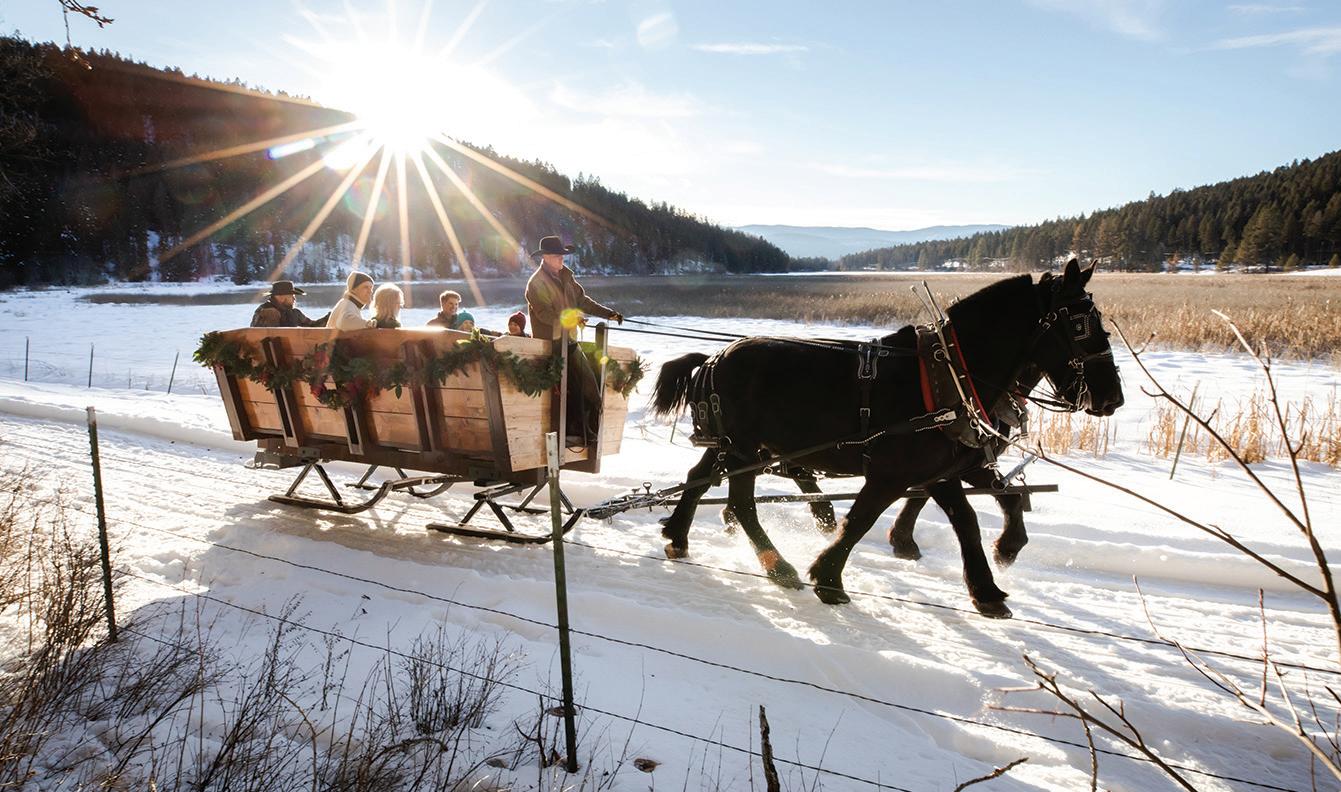


+ Recruited new partners throughout the region
+ Provided marketing support and resources through our Partner Center
+ Facilitated connections between businesses and public land managers
+ Enhanced partner communications and amplified testimonials
+ Partnered with Glacier National Park Conservancy for the third consecutive year to fund the Vehicle Reservation Hotline (12,000+ calls answered May–August)
+ Collaborated with Glacier National Park to add a call-routing option directing visitors to regional information outside the park
+ Continued our “Guiding Glacier” video series featuring local guides across four seasons
active partners: 1,386 (FY 2024: 1,215)
+ Sustained partnership growth throughout the fiscal year
Partnership growth to 1,386 active partners (14% increase from FY 2024) demonstrates sustained industry confidence and collaboration capacity. The network extends marketing reach, amplifies messaging and creates a collaborative infrastructure necessary for effective destination stewardship. Partners provide a critical on-theground perspective and implementation capacity for stewardship initiatives, bridging the gap between regional marketing efforts and local community needs
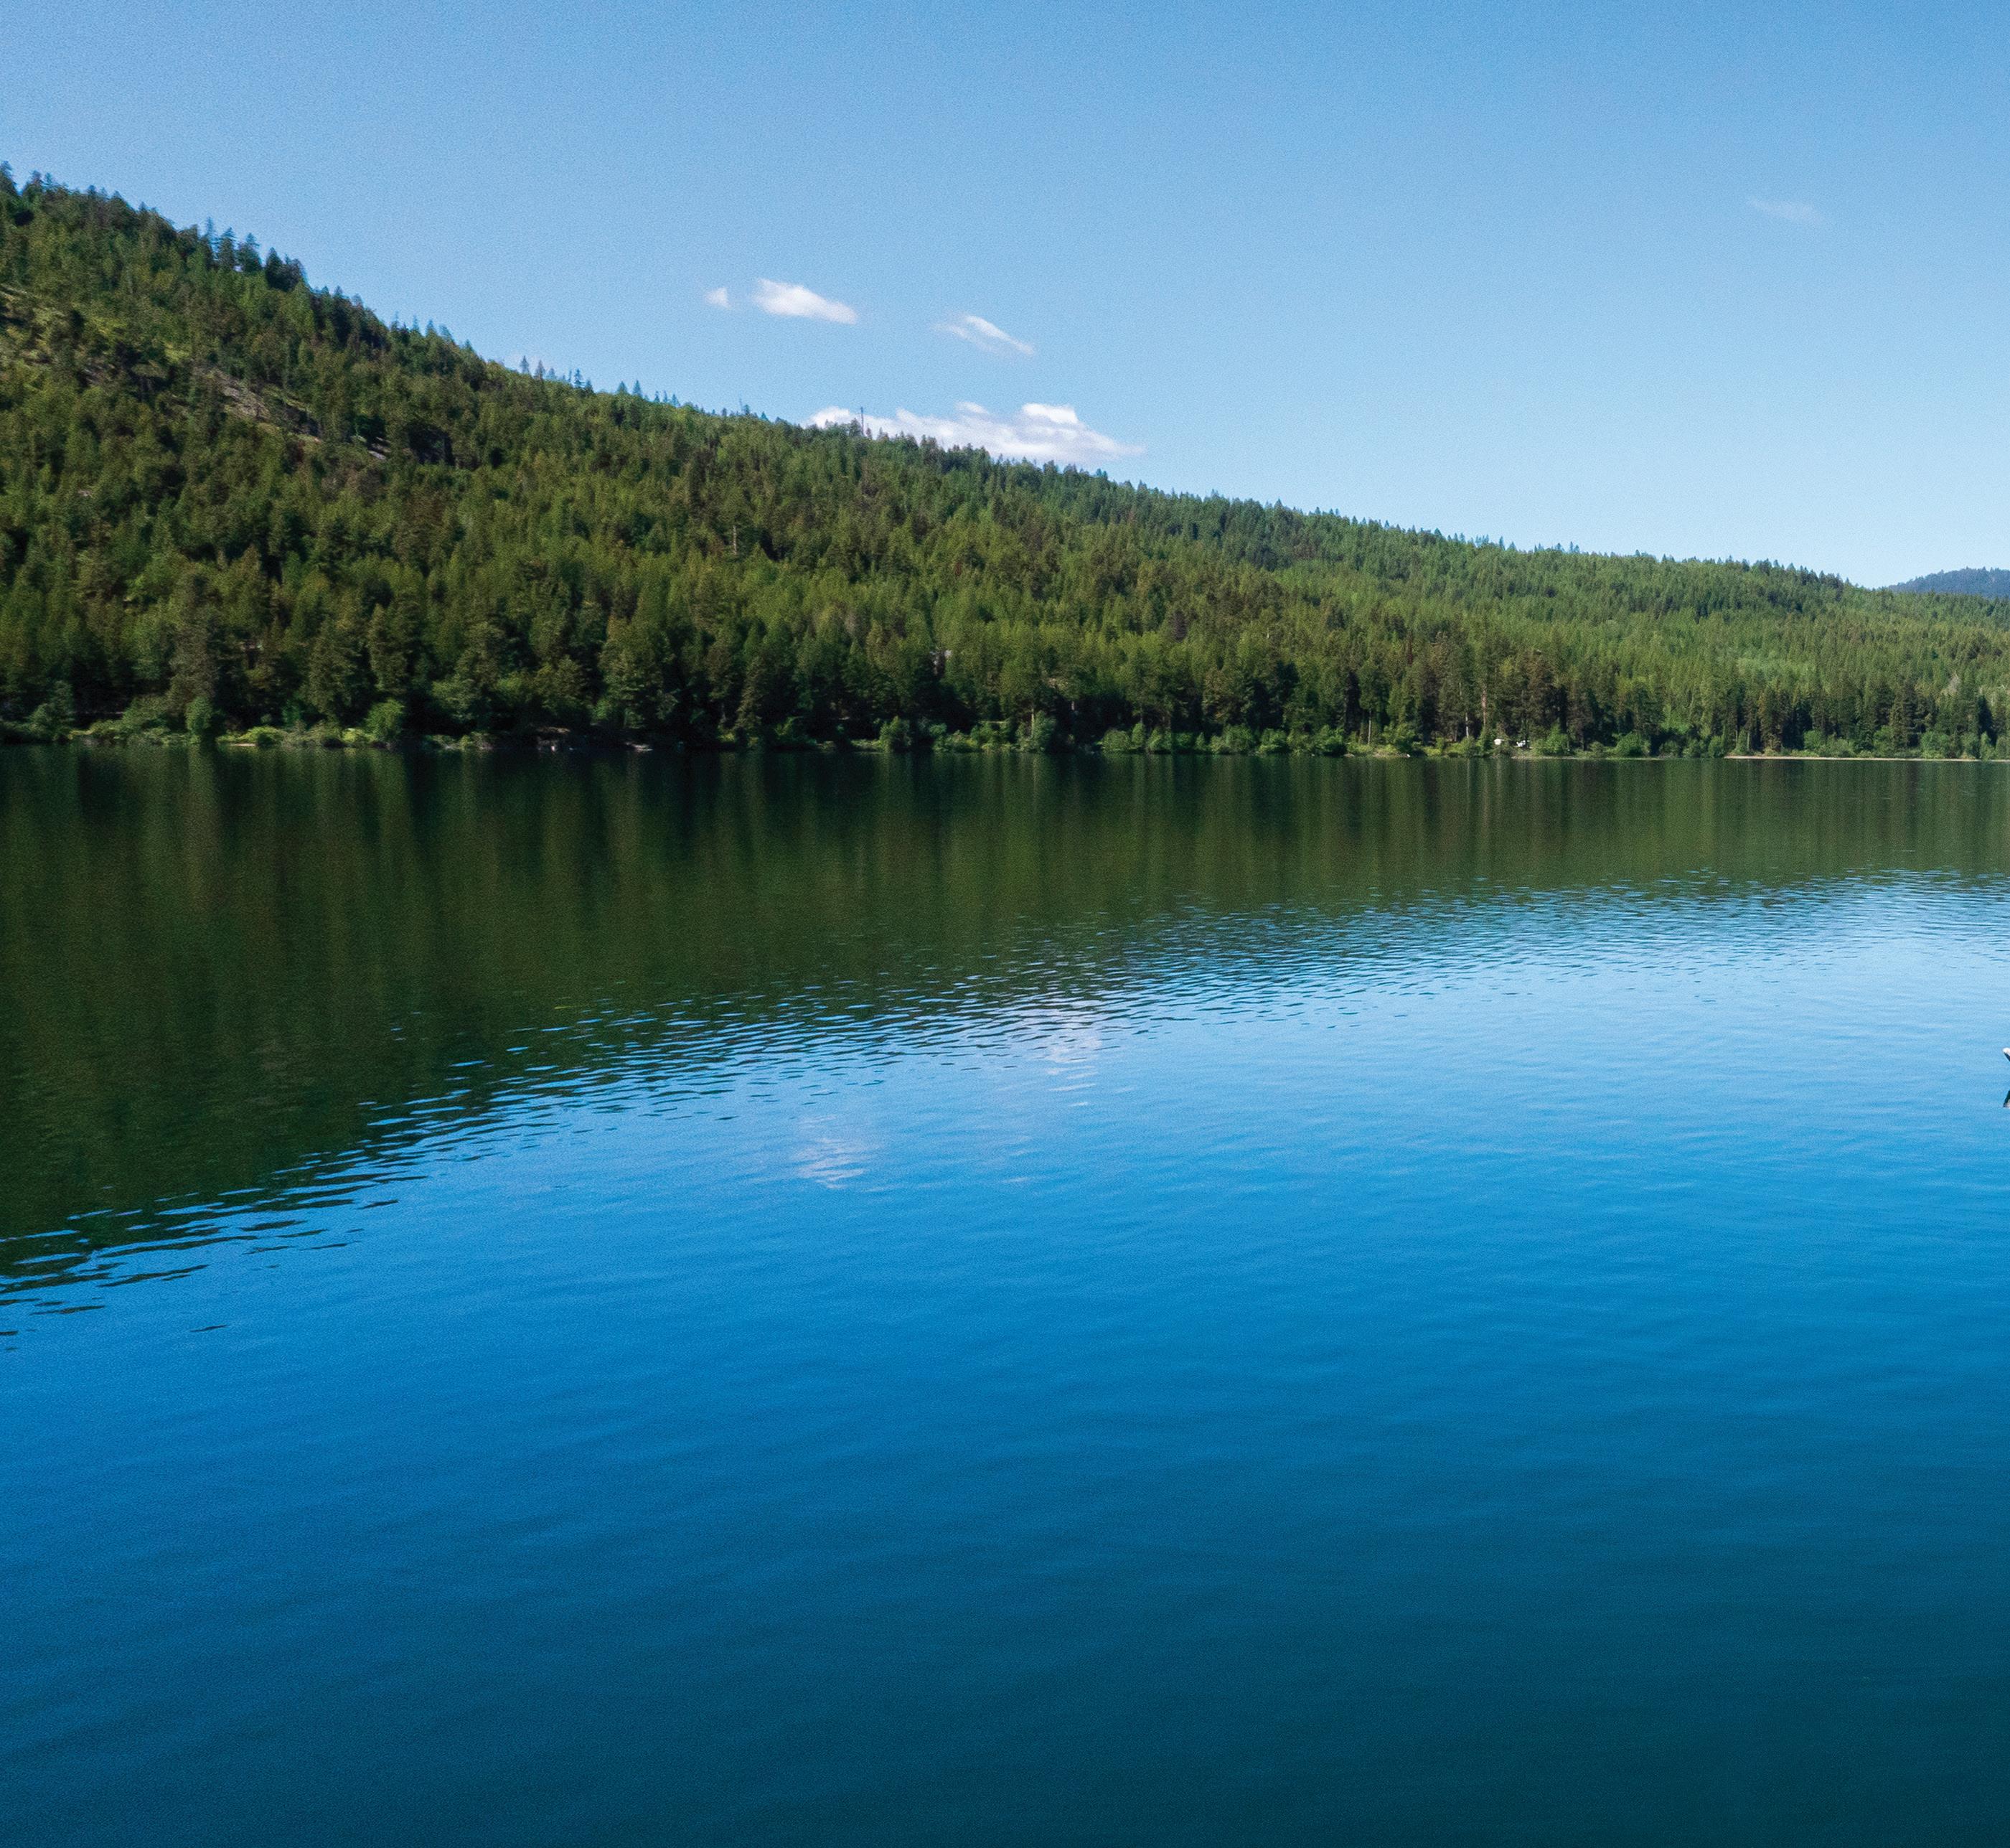
The destination stewardship program monitors the relationship between tourism and community well-being, tracking metrics that inform sustainable tourism strategies

+ Monitored workforce trends, including job openings, unemployment and income
+ Tracked housing affordability across all eight counties
+ Measured visitor-to-resident ratios by county
+ Analyzed short-term rental market trends
+ Tracked resident sentiment toward tourism through ITRR surveys
+ Monitored visitor spending and distribution patterns
+ Maintained community engagement platform
Comprehensive data monitoring enables evidence-based stewardship decisions. Key observations: Montana job openings decreased from 35,000 (June 2024) to 28,000 (June 2025); unemployment decreased to 2.8%; average income increased to $56,393 (up $2,600). Housing affordability varies dramatically across the region. Short-term rental inventory shows mixed trends across counties. These metrics inform stewardship priorities and community support initiatives

Understanding each county’s distinct characteristics is essential for effective destination stewardship The following data highlights diversity across Glacier Country’s eight counties:
Shows how total Glacier Country visitation and visitor spending are distributed across the region’s counties.
This metric represents how many on-the-ground visitors were in each county, compared to the county’s residents. Greater than 1 indicates there were more visitors than residents Under 1 indicates there were more residents than visitors
+ Active partners: 1,386 (FY 2024: 1,215) – 14% increase
+ Sustained growth throughout the fiscal year
(2024 ITRR SURVEY — GLACIER COUNTRY REGION):
+ Agree state tourism promotion provides an economic benefit to their community: 79% (slight improvement from 2023)
+ Agree tourism’s benefits outweigh its negative impacts: 58% (up 8 points since 2022)
+ Believe increased tourism would improve residents’ quality of life: 27% (stable from 2023)
+ Feel their community is overcrowded because of tourism: 67% (1 point improvement from 68% in 2023)
(JUNE 2025)
+ Montana job openings: 28,000 (June 2024: 35,000)
+ Unemployment rate: 2.8% (June 2024: 3.0%)
+ Average annual income: $56,393 (June 2024: $53,794) –$2,600 increase
+ Lodging facility sales tax collections: $64 7 million
+ Contribution to Montana General Fund: 48 5 million
+ Regional average visitor spending: $356 (up $12 from FY 2024)
+ Glacier Country nonresident visitors: 69% (FY 2024: 71%)

According to the most recent data from the University of Montana’s Institute for Tourism and Recreation Research (ITRR), Montana welcomed a record high of approximately 13.8 million nonresident visitors in 2024, resulting in total spending of around $5 0 billion The 2024 spending data indicate a slight decrease in average spend per visitor, despite an increase in total visitor numbers The primary expenditure categories were gasoline and diesel ($1.21 billion), followed by restaurants and bars Total visitor spending generated an estimated $308 million in state and local tax revenues in 2024, directly supporting state and local government services, infrastructure projects and community programs across Montana
In 2024, the Glacier Country region accounted for approximately one-third of all nonresident spending in Montana, with an average annual visitor spending of approximately $1.76 billion—the highest of any travel region in the state Unlike other regions, the top spending category was restaurants and bars Roughly 70% of Montana’s 13.8 million nonresident visitors traveled through Glacier Country, and Glacier National Park alone hosted 3,208,755 recreation visitors who spent an estimated $458 million in surrounding gateway communities Summer 2024 analysis indicated that while the total number of visitors increased, the average spend per person per day decreased compared to the previous year Source: University of Montana’s Institute for Tourism and Recreation Research (ITRR), Zartico and the National Park Service.
Stewardship metrics reveal complex dynamics requiring ongoing attention Partner growth demonstrates strong collaboration capacity The 8% improvement in resident belief that tourism contributes positively to Montana’s economy (from 50% in 2022 to 58% in 2024) represents meaningful progress, though persistent quality-of-life concerns (73% see no improvement from visitors) require continued focus. The decline in job openings (-7,000) alongside improved unemployment (2.8%) and rising incomes (+$2,600) indicates a tightening but healthier labor market These interconnected metrics guide stewardship framework and community support priorities
FY 2025 demonstrated the organization’s ability to adapt and perform in a rapidly changing environment Strong marketing results, partnership growth and comprehensive stewardship monitoring position Western Montana’s Glacier Country to continue striking a balance between visitation promotion and community well-being.
As we move forward, the organization continues navigating evolving challenges, including AI’s ongoing impact on search and travel planning, measurement complexity from platform changes, economic uncertainty affecting visitor behavior and business operations, Canadian visitation trends requiring sustained attention, and the persistent balance between community capacity and visitor demand These dynamics require continued adaptation, data-driven decision-making and responsive strategies
+ Adapting to AI’s rapidly changing impacts on search and travel planning by staying ahead of the curve through Answer Engine Optimization (AEO) strategies while minimizing disruption to traditional SEO performance
+ Continuing Glacier National Park partnership through Vehicle Reservation Hotline and visitor information services
+ Maintaining Canadian marketing presence to support Canadian travel recovery
+ Implementing Regional Resiliency Grant projects, including Recreate Responsibly and Good Neighbor microsites
+ Supporting visitor center infrastructure through grant funding
+ Advancing board governance policy review to align with national best practices
+ Expanding responsible recreation messaging and stewardship education
+ Continuing “Still Here” and “Guiding Glacier” campaigns to showcase yearround experiences
+ Positioning for 2026 opportunities, including FIFA World Cup, America’s 250th Anniversary and Route 66 Centennial
+ Strengthening industry collaboration through Tourism Matters to Montana, Voices of Montana Tourism and statewide partnerships
+ Rigid year-over-year targets lose meaning during major disruptions (GA4 transition, Canadian market decline, website relaunch)— measurement frameworks need built-in flexibility to stay useful
+ Observation-based monitoring provides clearer insights rather than rigid targets during disruption
+ County-level data reveals distinct challenges requiring localized strategies
+ Strong partnerships enable coordinated responses to regional challenges
+ Digital marketing’s long consideration cycle requires sustained investment
Western Montana’s Glacier Country remains committed to supporting a resilient, thriving region that serves those who call it home while welcoming visitors with care and intention
Through continued monitoring, adaptive strategies and proactive initiatives, the organization will maintain the balance between destination marketing and community stewardship that defines its approach.