Water Supply and Treatment
SOURCE WATER JULY 2026 UPDATE
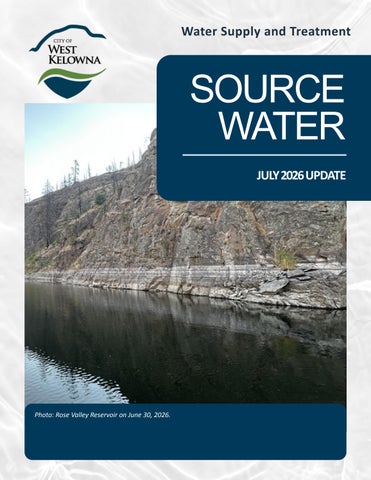
Photo: Rose Valley Reservoir on June 30, 2026.
Overview Source water monitoring involves measuring the quantity and quality of water in rivers, lakes, reservoirs, and groundwater. These data help track changes in water availability, detect potential issues and support informed decisions for protecting water supplies, managing drought, and ensuring the sustainable use of water resources. The following report outlines changes observed in the last month of monitoring by the Watershed Operations Team.
Hydrology in the Watershed Hydrology measurements are critical during drought conditions because they provide essential information on water availability, streamflow, groundwater levels, soil moisture, and reservoir storage. These data enable water managers to assess drought severity, anticipate water supply challenges, and make informed decisions regarding water allocation and conservation. Hydrological monitoring also supports ecosystem health, agricultural planning, and community resilience by informing timely management actions and helping mitigate the impacts of prolonged dry conditions.
Rose Valley update • Esperon Reservoir outlet is open and supplying Bighorn Reservoir. • Bear Creek Intake (BCI) is currently providing fish flow only (6 MLD). The Rotork valve currently remains open to 30% to maintain a level in RVR. • Bighorn Reservoir is at 78% full pool, and the outlet is open, flowing into Bear Creek to aid filling Rose Valley Reservoir. • Rose Valley Reservoir level fell from 94% at the end of June to 83% at the end of July. Note: the current outlet piping configuration does not allow for the usage of the lower 34% of storage. This means the “practical usable storage” is now only 49%. These low levels are not normally seen in the reservoir until mid-September, after much of the growing season is complete.
Powers Creek update • The Nicola Creek Diversion (NCD) is open and flowing to supplement water to Dobbin Reservoir with 21 MLD. • Powers Creek Diversion (PCD) is flowing at 16 MLD • Dobbin Lake is now open conveying 11MLD water to Powers Creek. • Tadpole Reservoir is now open to supplement Dobbin reservoir. • Paynter Reservoir is down to 84% of full pool, and open, conveying water to Powers Creek. • Horseshoe Reservoir is now open, supplementing water to Powers Creek.
Figure 1: Visual representation of Raw Water Reservoir Storage
Water Quality Source water monitoring continued throughout the month of July. By regularly measuring parameters like temperature, oxygen, turbidity, nutrient levels, contaminants, and flow rates, monitoring programs can detect changes early. This early detection is critical for preventing pollution events, identifying emerging threats, and ensuring safe drinking water supplies.
Rose Valley Reservoir Algae Monitoring The weather in July favored the production of algae in Rose Valley Reservoir. As algae blooms favor hot temperatures with extended periods of sunlight, July 2026 was significantly more productive than June. RVR experienced its second large algae bloom starting in early July, with its peak around the third week of July. The bloom consisted mainly of Aphanizomenon, Anabena, with some colonial cyanobacteria species observed as well in surface samples in late July. See Appendix A for visual representations of all. Algae monitoring was completed weekly throughout July. Samples were taken from the surface, 10m depth, as well as the Raw tap inside the Dam building. Less diatoms were observed than previous weeks, with Aphanizomenon sp. dominating the top 10m of the water column.
Figure 2: General Speciation for July 2026
Sample Location
Comment
Surface Samples
Large numbers of Aphanizomenon were present in all surface samples throughout July. Small amounts of Anathece sp. present in 21-28 July samples.
Plant Intake level (10m) Large numbers of Aphanizomenon were present in samples 21-28 July. Raw Tap
Large numbers of cyanobcateria observed 21 – 28 July. RVWTP experiencing no upsets due to algae.
Tow samples
Typical Copepod and Rotifer species noted. Anabena sp. and Aphanizomenon sp. present in all tow samples in increasing numbers throughout July. Other cyanobacteria were also present in relatively small numbers.
Aphanizomenon sp. found in raw, surface and tow samples.
Figure 3: Values listed are cell count ranges for the month.
Algae Type
RV Raw Tap
Surface (0m)
RV - 10m
Total Cells
11410
66280
12590
Diatoms
420
0
0
Yellow. Brown
210
0
0
Green
590
530
40
Cyanobacteria
10150
65750
12550
Dinoflagelates
40
0
0
Aphanizomenon bloom started mid-July.
Aeration System Changes The legacy aeration system was decommissioned on July 13, 2026. Available monitoring data collected prior to and during operation do not indicate that the system produced measurable improvements in dissolved oxygen concentrations, water quality indicators, or overall lake function, although localized mixing effects likely occurred in the immediate vicinity of the aeration infrastructure. Monitoring records indicate that indicators of cyanobacterial bloom development were present before the aeration system was decommissioned, suggesting that the physical, chemical, and biological processes contributing to bloom formation had already been established. Although discontinuation of aeration may have altered hypolimnetic oxygen dynamics and influenced internal phosphorus loading, the available evidence does not support a causal relationship between system decommissioning and bloom initiation.
Nutrient loading, Manganese, DO and temperature? Nutrient loading continues to be monitored at different levels of RVR. July saw a slight increase in both Nitrogen and Phosphorous levels in the 17m samples from June results. Increased nutrient levels can lead to an increase in algae blooms, and oxygen depletion. Monitoring continues throughout the summer season. A dissolved manganese analyzer is installed at the Rose Valley Dam intake and now records regular concentrations above the aesthetic objective (0.02mg/L) and a few spikes above the MAC (0.12mg/L) throughout July. These manganese concentrations are expected during this time of year, as naturally declining dissolved oxygen levels in the reservoir create reducing conditions that promote the release of sediment-bound manganese into the water column. These raw water manganese levels have triggered an increase in permanganate dosing at RV Dam. Third-party laboratory analyses continue to be conducted weekly to verify manganese concentrations within the raw water reservoir as well as treated manganese levels leaving the plant. Treated Manganese levels remain well below the aesthetic objective of 0.02mg/L. A dissolved oxygen (DO) profile is measured on a weekly basis in RVR. Dissolved oxygen levels at the intake level (10m depth) remain around 3.50 mg/L. However, oxygen levels near the sediment-water interface (17m) continue to show signs of decline, and a distinct anoxic zone has formed below 15m. It is expected DO levels will continue to decline at lower levels, allowing further nutrient and metals release into the water column. See figure 4 below. Note the same oxygen degradation in the hypolimnion in both years. The month of July saw significantly increased temperatures from June, raising the temperature at the intake level to above 13 degrees. (see figure 4 below). However, due to the lack of mixing since the decommissioning of the aeration system, there has been a decline in temperature at the intake level. Bear Creek Intake remained open throughout the month of July, supplying RVR with enough water to combat demand, allowing RVR levels to see minimal decline. See Figure 4 below. Note the difference in 2025 with the mixing of the aeration system affecting temperature at the intake depth of 10m. Figure 4: Rose Valley Reservoir dissolved oxygen (DO) and temperature profiles comparing the same weeks in 2025 to 2026.
Provincial Drought Rating and Water Restrictions According to British Columbia’s Drought Information Portal, the Okanagan continues to experience significant drought conditions. Provincial drought monitoring indicates that the Thompson-Okanagan region remains at a Drought Level 4, the second-highest drought classification. Stream flows continue to decline in much of the Okanagan, and high temperatures contribute to deteriorating conditions throughout the interior. Agricultural irrigation reduction measures are being implemented in multiple areas of the interior. (BC Drought Information Portal, 2026) The dark brown colour indicates Drought Level 5, the most severe level indicated by the Province. Source: BC Drought Information Portal, 2026
Key risks, considerations and recommendations Rainfall levels across the Okanagan continue to remain below average. With warmer-than-normal temperatures expected to increase evaporation and water demand, water conservation remains essential. Residents are encouraged to follow restrictions issued by CWK to help protect community water supplies and aquatic ecosystems. Rose Valley Reservoir water storage remains of high concern as we move into August. High summer temperatures promise increased water usage for the remainder of the summer months. With current RVR usable storage levels sitting at 49% water conservation efforts must continue to be at the forefront in the Rose Valley Water Service Area. Operationally, the focus remains on: • Maintaining infrastructure readiness • Managing for drought conditions and supply constraints • Continuation of watershed water quality monitoring to ensure healthy water supply • Keeping the flow of information consistent to provide community resilience. Conservation efforts are an important component of sustainable water management; however, achieving long-term water security also requires efficient water use across all sectors. Given the significant proportion of water allocated to agricultural use, continued improvements in agricultural water conservation and irrigation efficiency are an important component of overall watershed stewardship. Regards, Water Supply and Treatment Team
Report by the City of West Kelowna Water Supply & Treatment team.