


Gavin Tilstone, Andrey Kurekin, Peter E. Land, Elizabeth C. Atwood, Samuel Fawcett 1, Matt Smith 1, Ricardo Torres, Yaru Li.
1Plymouth Marine Laboratory Applications, Plymouth, U.K.
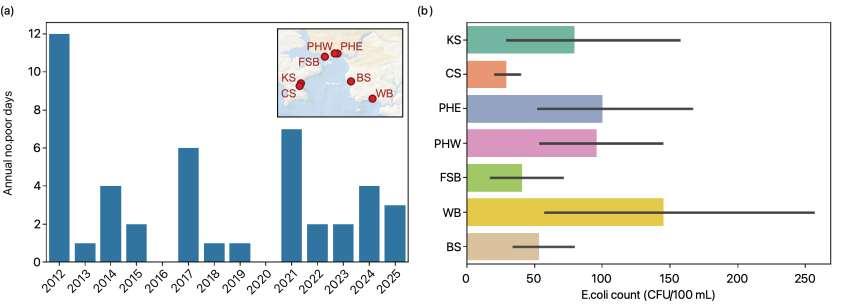
• Top plots show (a.) number of ‘poor’ water quality days by location and (b.) E. coli counts (colonies per 100 mL) at locations around Plymouth Sound (incl. Wembury).
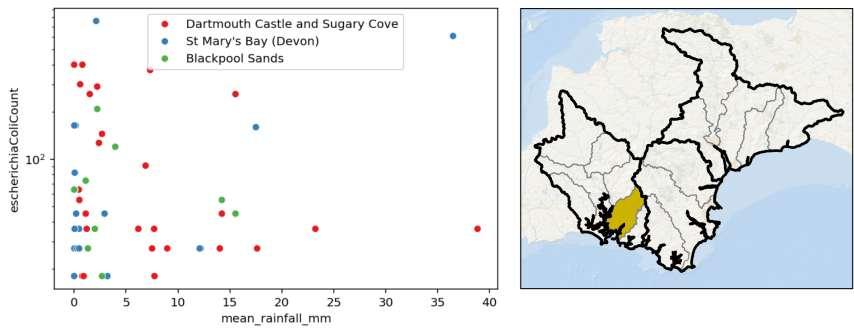
• Bottom plot shows the relationship between daily mean rainfall (mm) and E. coli counts at Plymouth Hoe East, Bovisand, and Firestone Bay.


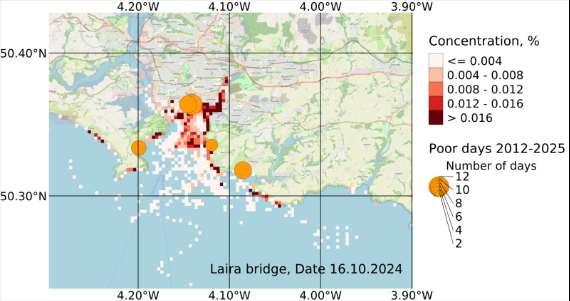
• Heat maps of the likelihood of the number of E coli particles from a sampling source location (Laira Bridge) to dispersal around the Plymouth Coast.
• Significant numbers of E. coli (indicated as deep red pixels) occur on tourist beaches (Jenny Cliff, Bovisand, Wembury) to the south-east and related to poor water quality days.


Thanks to Vis4Sea partners: Dan Clewley1, Silvia Pardo1, Aser Mata1, Tess
Ashen1, Malcolm Woodward1, Bethany Wilkinson1, Tom Jordan1 ,Mathew Taylor1 ,
Sarah Breimann1, Nagur Cherukuru2, Jenny Choo, Kesav Unnithan2, Yiqing Guo2 ,
Tim Malthus2 , Tishan Dhar2, Robert Woodcock2, Sam Lavender3, Geoff Smith4 .
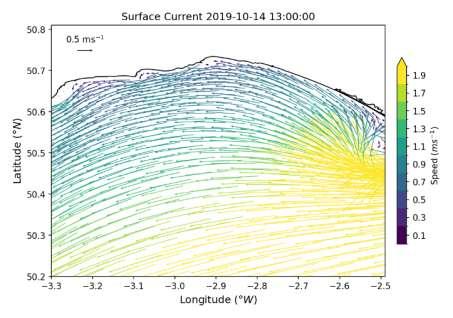
• Particle tracking model based on in situ ADCP and modelled FVCOMS data fields.
• Surface currents in Plymouth Sound and Lyme Bay are seasonally highly variable.

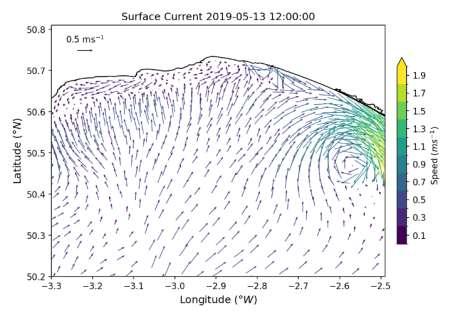
• Examples in Spring and Autumn 2024 show the strongest flow is from the south-west or from river discharge modified by the bathymetry.