Cost of stopping report
Assessing the true cost of delaying, deferring and cancelling infrastructure projects


Assessing the true cost of delaying, deferring and cancelling infrastructure projects
Assessing the true cost of delaying, deferring and cancelling infrastructure projects
This report was researched and written by Shamubeel Eaqub CFA, and commissioned by national associations Civil Contractors New Zealand, Infrastructure New Zealand and Water New Zealand.
Shamubeel Eaqub, CFA
20 May 2026

At its core, infrastructure is about people. It is the roads that connect communities to jobs and services, the water networks that protect public health, the energy systems that keep businesses operating, and the digital and transport links that allow regions to grow and compete.
Investing in infrastructure is investing in a healthier, more prosperous New Zealand and when we avoid or delay this growth, it takes a toll on the wellbeing of our people.
New Zealand’s infrastructure system has been under strain for decades. The current fuel shock has only highlighted the under-lying issues, of a system that is not working effectively. Reforms to funding, transport delivery and water services have created uncertainty for the market and for the country’s approach to infrastructure construction
Projects have been paused, reprioritised or cancelled altogether. In the current environment, there may be a temptation to delay critical infrastructure work until confidence improves, but the evidence presented here by Shamubeel Eaqub shows this approach is expensive.
Projects are commissioned by central government, local government and private clients. Because many projects are funded and maintained using public funding, there is significant attention on value for money. This can lead to ongoing reassessment and re-design of projects, for instance when a new government or council takes power. Sometimes, this process will result in complete re-design, and some projects that have been fully designed will not go ahead.
However, hesitation, or doing nothing, doesn’t come for free. The impacts of stopping and starting infrastructure investment are not theoretical. Over the past 25 years, stop-start infrastructure investment has cost New Zealand an estimated $11.8 billion.
The estimate is conservative. It excludes many client-side sunk costs which industry interviews suggest can be substantial for large and complex projects. It also excludes the broader economic opportunities lost from a project being paused or cancelled, from being unable to reinvest back into the community by way of wages paid, goods and services purchased
The consequences of not achieving the public benefit achieved through constructing and renewing infrastructure are felt across the country. Taxpayers and ratepayers often fund the same work twice (i.e. re-design of projects), or pay for the design of projects that never go ahead Suppliers struggle to retain capability through dry spells with no forward pipeline. Communities wait longer for transport upgrades, water infrastructure and resilience investment.
To support better decision-making, Civil Contractors New Zealand, Infrastructure New Zealand and Water New Zealand have developed a tool that helps quantify the often-hidden costs of stopping, delaying or disrupting infrastructure investment.
The intention is not to remove difficult funding decisions from governments or councils. Rather, it is to ensure those decisions are made with a clearer understanding of their long-term consequences.
By making these costs more visible, including workforce disruption, remobilisation costs, loss of capability and reduced market confidence, the Cost of Stopping Tool can support more informed conversations about value, sequencing and trade-offs across the infrastructure system.



Alan Pollard Chief Executive Civil Contractors NZ

Nick Leggett Chief Executive Infrastructure New Zealand

Gillian Blythe Chief Executive Water New Zealand

This project’s aim is to understand the literature and macro evidence of the cost of stop-start in infrastructure investment in New Zealand. Commissioned by Civil Contractors New Zealand, Infrastructure New Zealand and Water New Zealand, the three national associations jointly asked report author Shamubeel Eaqub to quantify the effect of this stop-start pattern
This expands on earlier work that establishes the size and importance of the infrastructure sector 1 , the large infrastructure deficit in New Zealand 2, and the cost of stop-start specifically in rail-related construction 3
The role of horizontal infrastructure in society is to deliver public benefit through physical networks, whether this constitutes transport, water or energy.
New Zealand has an infrastructure deficit estimated at $210 billion and a history of stop-start investment that has cost the country billions. Each economic shock, amid fiscal pressures, tends to trigger cancellation or deferral of infrastructure investment and even maintenance. However, when it’s analysed, the data shows that stopping infrastructure investment is far more expensive than it appears.
With analysis, it’s clear that pausing or deferring projects results in cost. Other than jeopardising the physical construction of projects that result in public benefit, there is also material and time cost in re-scheduling and resupplying projects.
Over 2000 to 2025, stop-start spending cost $11.8 billion (low and high estimates of between $6.1 billion and $17.6 billion) across three channels: the inflation cost of deferral, the productivity penalty from a loss of sector capacity and capability, and the deferred benefits to citizens of needed infrastructure.
The macro data cannot specifically quantify sunk costs including client-side costs, which interviews suggest could be as high as 25% for large and complex projects.
1 Sense Partners (2020), Infrastructure for the long haul: A need for transparency and durability, Report to Association of Consulting and Engineering. Accessed 28.04.2026 https://d3n8a8pro7vhmx.cloudfront.net/acenz/pages/1663/attachments/original/1600130930/infrastructurefor-the-long-haul-full-report.pdf?1600130930
2 Sense Partners (2021), New Zealand’s Infrastructure Challenge: Quantifying the gap and the path to close it, Report to Te Waihanga – The Infrastructure Commission. Accessed 28.04.2026 https://tewaihanga.govt.nz/ourwork/research-insights/new-zealand-s-infrastructure-challenge-quantifying-the-gap-and-path-to-close-it
3 Sense Partners (2023), Unlocking tail construction: quantitative and qualitative analysis, Report to KiwiRail. Access 28.04.2026 https://www.kiwirail.co.nz/assets/Uploads/Our-network/Our-regions/Auckland-MetroRail/Economic-contribution-rail-construction-FINAL-Sense-Partners-Sept2023.pdf
Figure 1 : The cost of stop - start is substantial
The Cost of Stop-Start 2000–2024 ($m)
Fi gure 2 : O ver the last 25 years the cost of stop - start has been huge, both to the sector and to society
The economic analysis was complemented by a small number of interviews with people working at the Chief Executive, Managing Director and GM-Infrastructure level to add qualitative insight, and to cross-check the data and literature driven estimates. This report contains insights in quote blocks, but these are not attributed to maintain confidentiality.
The evidence presented in this report argues that the decision to delay or stop infrastructure construction or renewals should be made with full awareness of its costs and its consequences. The response to fiscal pressure should not be blanket cancellation but disciplined project triage.
“It's
a bit like a flywheel, isn't it? It takes an awful lot of energy to get a flywheel restarted, and it takes a lot of energy to stop a flywheel. It takes minimal effort to keep that flywheel going once it's operating.”
When fiscal pressure demands a response, decision-makers should assess each project against four criteria, as featured in the project triage framework example, below:
Sunk investment
Resumption cost
Societal urgency
Market timing
How much has already been spent? Are consents, designs, and contracts in place? If equipment needs removal, or the site needs remediation for shutdown, what will the costs be?
What will it cost to restart? How long would the pause be?
What problem does this project solve, and what is the cost of leaving it unsolved?
Will pausing until the market is hotter increase or decrease costs? Will pausing lead to reassessment, redesign, or risk project cancellation?
High sunk costs mean cancellation wastes more than continuation
Short pauses may be manageable; long pauses multiply costs
Projects addressing safety, water quality, or critical renewals should be prioritised
Counter-cyclical investment during downturns delivers better value
Maintain the maintenance budget. Renewal and maintenance spending should be the last thing cut. Deferred maintenance costs can be between two and five times higher. Ring-fencing maintenance budgets from fiscal austerity is the single most cost-effective infrastructure decision a government can make.
Publish and commit to a multi-year pipeline. New Zealand has a pipeline of work, but it is not funded. A more certain pipeline allows the construction sector to invest in the capacity and efficiency that ultimately reduces the cost to government and society.
Use downturns to build. When the private sector retreats, construction capacity becomes available and input prices moderate, an ideal time for public infrastructure investment. Counter-cyclical investment delivers better value per dollar spent and supports jobs and economic activity when the economy needs it most.
Assess the full cost of stopping before deciding. Projects should not be cancelled without an explicit assessment of sunk costs, resumption costs, and the societal cost of deferring the benefits. The interactive tool accompanying this report provides a framework for this assessment. Decision-makers who approve a cancellation should be required to document the expected cost of delay and cancellation, so that decision-making is transparent and accountable.
Invest in sector capacity in partnership. The construction sector's ability to deliver efficiently depends on a stable base of skilled workers, competitive firms, and functional supply chains. These are public goods in the economic sense: individual firm can’t sustain them alone, but every project benefits. Government policy should explicitly support workforce retention, training pipelines, and the conditions for a sustainable competitive contracting market.
Two contextual pieces before diving into the analysis. First, the sector needs to be defined as the wider ecosystem, including constructors and suppliers. Ideally, we should also include client side, but that is challenging from a data perspective. However, it is an important aspect. The loss of capacity in boom-bust happens across the entire supply chain, including commissioning expert capability.
Second, infrastructure investment is about maintain existing assets and building new assets. However, the focus often tends to be on new builds and capital expenditure, depriving maintenance and renewals of the priority it deserves. The visibility and certainty of future work is low for both, creating ripple effects across the sector.
2.1 Defining the sector: a large and diverse ecosystem
The horizontal civil infrastructure sector is a complex ecosystem.
Figure 4 (below) illustrates that for every dollar spent on a major civil construction project, approximately 66 cents flows to suppliers (materials, equipment, fuel, professional services), 23 cents goes to labour, 6 cents to capital, and 6 cents in taxes. 4
Each million dollars of heavy civil engineering construction directly supports approximately 4.6 full-time equivalent jobs, but when supply chain effects are included, the total rises to 6.8 FTEs.
The ecosystem includes many small and micro firms. The data shows 95% of firms in the ecosystem have less than 10 staff.
If one element in the supply chain stops, the whole supply chain stops. A 5 per cent disruption in one area can have a 25 per cent impact on overall project delivery because of the multiplicative effect of coordination failures across complex systems.
4 Statistics NZ (2021), National accounts input-output tables: Year ended March 2020. Accessed 28.04.2026 https://www.stats.govt.nz/information-releases/national-accounts-input-output-tables-year-ended-march-2020/
Figure 4: Two thirds of revenue in the sector is spent on suppliers, from materials to specialised contractors
Sales split
SUPPLIERS:
Construction services
Materials & manufacturing
Property & equipment
Professional services
Wholesale & trade
Transport & logistics
Source: Estimates from Statistics NZ data
Small and medium enterprises in the supply chain are disproportionately affected when work is cancelled or deferred. They may have nowhere to spread costs and nothing else to do with their people or equipment.
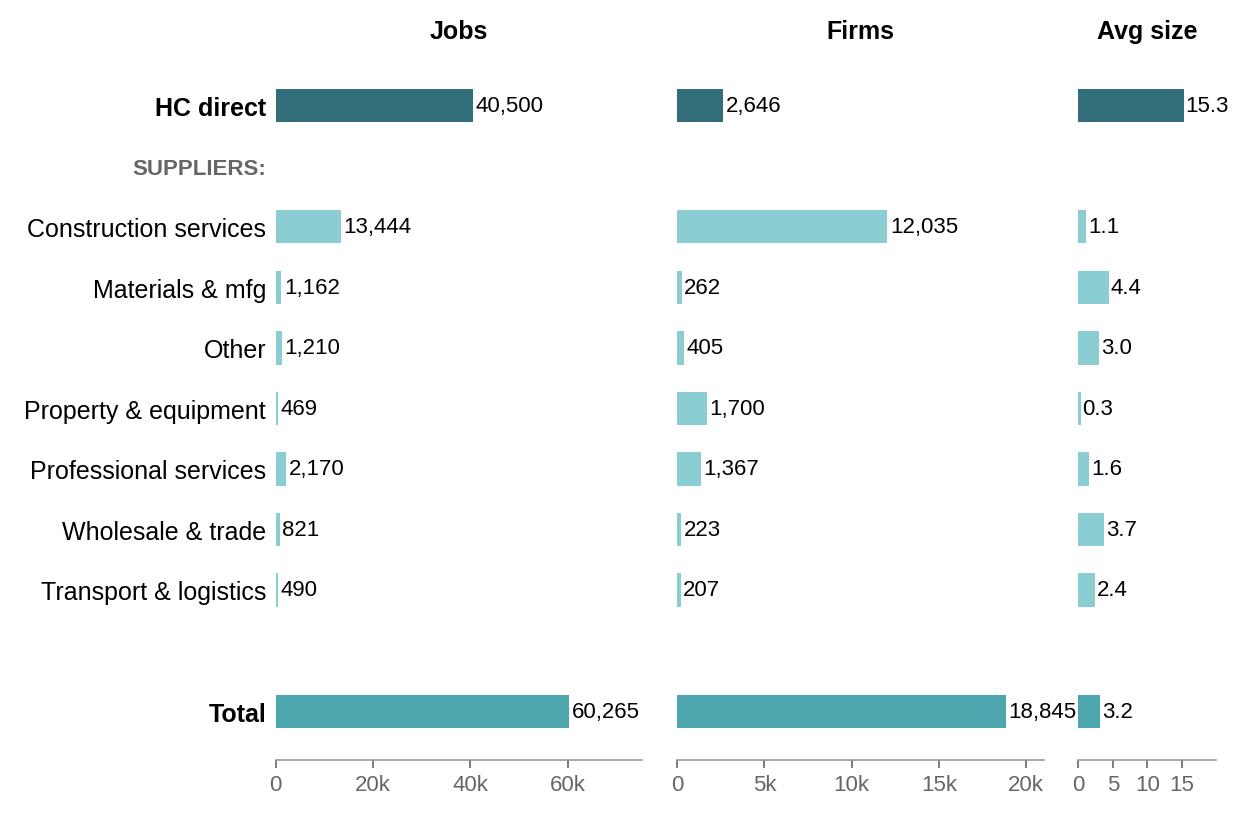
Figure 5 illustrates this clearly. While much of the jobs are concentrated within the sector directly, there is a broad array of jobs and firms spread across suppliers. Because of many small suppliers in trades and specialised services, the impact of stop-start is felt differently, and if there is no cashflow, their businesses may not be able to continue
If there is no work, the capital cannot be held. Small and medium enterprises in the supply chain are desperately affected... A pipe factory or steel fabrication yard might have only six months of backlog. They have nowhere to spread costs and nothing else to do with their people. A lack of cash flow kills them.
Figure 5: The sector ecosystem is large, containing significant variation and complexity
Sector ecosystem jobs, firms and firm size – Heavy and Civil Engineering Construction Direct (HC Direct)
Source: Estimates from Statistics NZ data
This ecosystem cannot be switched on and off like a tap. Workers, firms, specialist subcontractors, equipment suppliers, and materials producers all depend on a visible pipeline of future work to justify their investment in capacity and capability.
When the pipeline is uncertain, they rationally reduce their exposure. When the pipeline disappears, so do many jobs and businesses. There are also significant costs in the post-bust recovery, with loss of experienced staff and ‘know how’ built up inside and between organisations. These create a long-term drag of productivity, adding to costs and inefficiencies that last for many years
To get specialist construction teams into a high-performing unit, they need continuity and repetitive work. This is why the industry continually talks about pipeline. Teams of people with specific skill sets cannot simply be assembled on demand.
Investment activity is not just about new projects, which are important to deal with growth and changing needs. Maintaining existing assets is also critical, because we have much of the infrastructure we will need already, but they must be maintained, else they have to replaced at great cost in the future.
Statistics NZ data shows depreciation was 38% of local government investment spend in 2025, and 59% of central government spend.
[Asset owners] have been sweating assets for years and calling it jubilant cost cutting, until they have to replace the whole road because they did not resurface it frequently enough. The principle is clear: it makes more sense to paint a weatherboard than replace a rotten side of the house.
There is low confidence on future government spending. While there is a published pipeline of work5 , the shape of it and the funding security do not give certainty of future. Most constructors do not trust announcements of forward work until the projects are tendered for procurement.
Government spent around $21b on investments in 2025, but the pipeline of both funded and unfunded projects (Figure 6) gives very little, if any foresight on what might be coming next. Part of promised funding are not the same as what happens in spending. Timelines are typically longer than in plans and budgets, and projects can change drastically between political cycles or external shocks.
Figure 6: The forward pipeline of work is not funded for consistency
Source: Estimates from Te Waihanga New Zealand Infrastructure Commission
Countries that maintain a visible and credible pipeline of infrastructure work hold costs down and keep skilled workers in the sector. Countries that stop and start pay more for less.
In the United Kingdom, decades of stop-start capital spending scattered expertise and inflated procurement costs. In June 2025 the UK government published a 10year infrastructure strategy worth £725 billion, explicitly designed to give industry the certainty it needed to invest in people, plant and innovation. 6 The strategy acknowledged that inconsistent project pipelines had driven up costs and driven out capability. The fix was a long and visible horizon of funded work.
Infrastructure Australia’s 2024 market capacity report found that bunching too many projects into a short window pushed costs up by 30 percent and left the country short 141,000 workers. 7 The lesson was to spend more steadily. Smoothing the pipeline across time reduced cost blowouts and gave firms the confidence to train and hire.
An IMF study on public investment efficiency found that advanced economies lose about 13 percent of potential value from their infrastructure spending through poor planning, weak project selection and interrupted delivery. 8
The 2021 OECD handbook on quality infrastructure investment emphasises that predictable project pipelines reduce financing costs, attract private capital and allow firms to plan workforce development over sensible timeframes. 9 Stop-start spending raises the risk premium, drives away long-term investors and forces firms into shortterm survival mode.
The evidence from the UK, Australia, the IMF and the OECD all found that consistency is cheaper than volatility.
6HM Government (2025), UK Infrastructure: A 10 Year Strategy. National Infrastructure Strategy Taskforce (NISTA). Accessed 28.04.2026. https://assets.publishing.service.gov.uk/media/6853c5db99b009dcdcb73649/UK_Infrastructure_A_10_Year_Strat egy_Web_Accessible.pdf
7Infrastructure Australia (2024), Infrastructure Market Capacity Report. Accessed 28.04.2026. https://www.infrastructureaustralia.gov.au/2024-infrastructure-market-capacity-report
8IMF (2015), Making Public Investment More Efficient. IMF Staff Discussion Note SDN/15/01. Accessed 28.04.2026. https://www.imf.org/external/np/pp/eng/2015/061115.pdf
9OECD (2021), Implementation Handbook for Quality Infrastructure Investment. Accessed 28.04.2026. https://www.oecd.org/content/dam/oecd/en/publications/reports/2021/07/oecd-implementation-handbook-forquality-infrastructure-investment_b9131199/479131b2-en.pdf
The costs of stopping infrastructure investment fall into three categories.
• The cost of delaying in construction costs amid rationed or fixed budgets, meaning that future investment is down-scoped.
• The cost through lost productivity due to the loss of skilled workers, business and relationships. This adds significant costs in the retooling, including in recruitment, training, and knowhow. This shows up as lost productivity in the sector, which has been persistently worse than the wider economy and Australia.
• The cost to citizens from deferring the benefits of stalled projects.
Cost escalation and budget constraints: $15m-$2.1b
Construction inflation in New Zealand averaged 3.5% per cent per annum between 2000 and 2025, higher than costs across the whole economy at 2.7% per annum. This means that when construction costs are resumed later, they cost more than national income has not increased at the same rate.
We assess two scenarios: fixed budgets (capped appropriation in nominal terms) and fully flexible budgets. The reality is somewhere in between. For example, if a road that cost $100 million in 2009 costs $150 million by 2015, the question is how the budget- or the project-scope changes.
We modelled this simply using a trend filter 10 . In years where spending fell below trend, the gap is deferred work. That work sits in a backlog and inflates until built. When spending recovers, some of the backlog is cleared, but not all of it.
Under fixed budgets, the cumulative inflation penalty is up to $2.1 billion, depending on how much deferred work gets caught up in boom years. If budgets are adjusted for general inflation, the penalty can be as low as $17 million The reality for most projects is closer to the fixed-budget scenario, because appropriations are set in nominal terms and rarely rebased for construction cost growth.
10 Hodrick-Prescott filter, commonly used to measure the output gap
4.2 The productivity penalty of stop-start: $5.0b to $12.3b
“Supply chains seem to take a long time to get that momentum back and running. And so that affects everything that we do too. If you lose people out of the industry, that's one thing we can't afford to lose any more.
Our interviewees revealed the largest cost was from the loss of capacity and capability, within and between firms, leading to lost productivity during restarts. We estimate the productivity in the sector has drifted lower over the past 25 years, compared to around 0.9% per annum growth in Australia and 0.5% per annum growth for the total New Zealand economy.
When a project stops, design work and resource consents start expiring. After two or three years, site conditions have changed, regulations may change and many aspects such as engineering will needs to be re-done. That pre-construction spending becomes sunk cost, but this is not easily captured in the macro data and is a gap in this analysis. We have illustrated this in our scenario tool.
The main quantified cost is the loss of productivity. During downturns, contractors demobilise, equipment gets redeployed, firms close and people move to other jobs or other countries. Restarting requires rehiring skilled staff (amid sustained and intensifying skill shortages, meaning that often rehiring comes with training and a learning curve), re-tendering, re-consenting, and re-establishing supply chains and ways of working together smoothly and efficiently. Each cycle the costs cumulate.
During the GFC, the sector ecosystem lost 2,500 jobs (7%) and over 900 businesses closed. The current downturn is following the same pattern, with 1,800 jobs lost by 2025.
The cumulative cost of this productivity decline ranges from $5.0 billion to $12.3 billion. The lower number assumes productivity stays flat and the higher is what Australia achieved.
There is cost that falls on the people who use infrastructure. Infrastructure projects are funded because they deliver benefits that exceed their costs. Each infrastructure project delivers a stream of benefits over decades. A delayed project means delayed benefits.
The arithmetic is simple. A project with a BCR of 2.0 delivers $2 of benefits for every $1 of cost, spread over the life of the asset, say 75 years. Delay that project by five years, and the present value of those benefits drops by about 22 per cent.
At the standard Treasury discount rate of 5%, time erodes value quickly. We use the old discount rate here, because the CBAs were also down using this discount rate. The Treasury has recently moved to much lower discount rates for infrastructure projects to 1%-2%, with a sensitivity of 8%. 11
Using our approach to deferred investments, which then turn into backlogs., we assign costs to each year of deferment. Using a conservative BCR of 1.5, the cumulative NPV loss over the last 25 years is $1.0 billion. At a more typical BCR of 2.0, the loss reaches $3.2 billion.
These benefits are deferred, not permanently lost (although this can happen with projects that are shelved and never re-instated). Once the project is eventually built, benefits begin to flow, but those years of waiting cannot be recovered.
We have not assessed the impact of the deferment on project scope, which may reduce benefits too. Our estimate of deferred benefits is conservative because it assumes everything eventually gets built at full scope.
11 https://www.treasury.govt.nz/information-and-services/public-sector-leadership/guidance/reportingfinancial/discount-rates
We built a tool to bring this all together. Using two scenarios we can illustrate the potential channels of costs of stopping: 1) A major roading project, shelved for three years. 2) A water treatment upgrade, deferred for two.
A state highway upgrade, shelved for three years
$500 million project, paused for 3 years
A major highway upgrade is approved and enters procurement. Design, consenting and early works absorb 25 per cent of the budget. Then government priorities shift. The project sits for three years before a new procurement round brings it back to life.
business
planning & consenting,
Eg, securing & stabilising site for shutdown (if construction in progress), project respecification, re-procuring materials, project coordination and logistics
Cost escalation
Eg, material shortages & changes, inflationary pressures, scope changes
specialised skill shortages,
Effective BCR drops from 2.2 to 1.7, a 21 per cent reduction in what the project delivers per dollar. Jobs at risk: 578 direct and 1,694 across the supply chain. After three years, 80 per cent of the original project workforce will have left the industry.
BCR of 2.2 is the mid-point for NZ transport projects, consistent with published Roads of National Significance data (range 0.7 to 3.1). Cost escalation uses the fixed-budget scenario at 3.4 per cent pa construction inflation. Deferred benefits calculated as NPV loss from shifting the benefit stream forward by 3 years at a 5 per cent discount rate over a 75-year asset life.
$50 million project, paused for 2 years
A council designs and consents a water treatment upgrade. Budget constraints during a fiscal tightening push it past the next long-term plan cycle. Two years pass before work restarts.
Eg, business cases, planning & consenting, design & engineering work
Resumption costs
Eg, securing & stabilising site for shutdown (if construction in progress), project respecification, re-procuring materials, project coordination and logistics
Cost escalation
Eg, material shortages & changes, inflationary pressures, scope changes
Workforce costs
Eg, wage inflation, specialised skill shortages, increased regulatory compliance
Direct costs
Eg, freight & delivery, materials, equipment, site preparation
Effective BCR drops from 3.5 to 2.9. Water projects start with higher BCRs, but a two-year pause still erodes 17 per cent of project efficiency. Jobs at risk: 58 direct and 169 across the supply chain. After two years, two-thirds of the original project workforce will have moved on.
BCR of 3.5 is the mid-point for three waters projects. Water infrastructure tends to have higher BCRs because the counterfactual is severe: untreated water, consent breaches, public health risk. Cost escalation uses the fixed-budget scenario at 3.4 per cent pa construction inflation.
The pattern is consistent. Pausing a project costs roughly half its value in combined direct costs and deferred benefits. Direct costs, which fall on the project budget, run between 20 and 27 per cent of project value. Deferred benefits to citizens add another 30 per cent.
A project that was worth doing before the pause is still worth doing after. But it delivers less per dollar, takes longer to restart than anyone plans for, and the workers who knew how to build it have moved on.
Stop-start has cost New Zealand at least $11.8 billion over 25 years. The estimate is conservative because it excludes client-side sunk costs, which interviews suggest can be substantial for large and complex projects.
The cost is borne everywhere. Taxpayers fund the same project twice. Small suppliers cannot hold capacity through a dry spell with no backlog to absorb. People wait years for water, transport and resilience.
A funded pipeline, ring-fenced maintenance, counter-cyclical investment, and accountability when projects are paused are the right levers.