6 PART-TIME ARTS EDUCATION
SCHOOL POPULATION
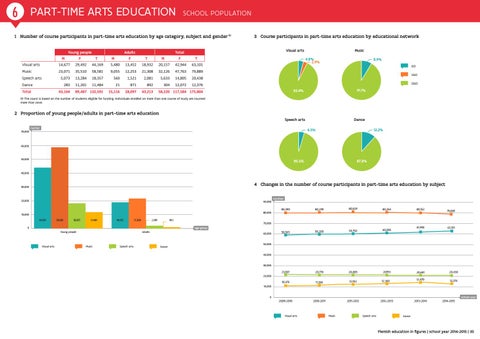
1 Number of course participants in part-time arts education by age category, subject and gender (1) Young people
Adults
M
F
T
Visual arts
14,677
29,492
44,169
Music
23,071
35,510
5,073 283
Speech arts Dance
43,104
Total
M
3 Course participants in part-time arts education by educational network Visual arts
Total
F
T
M
F
T
5,480
13,452
18,932
20,157
42,944
63,101
58,581
9,055
12,253
21,308
32,126
47,763
79,889
13,284
18,357
560
1,521
2,081
5,633
14,805
20,438
11,201
11,484
21
871
892
304
12,072
12,376
89,487 132,591
15,116
28,097
43,213
Music 4.8% 2.9%
8.9% GO VGO OGO
91.1%
92.4%
58,220 117,584 175,804
(1) The count is based on the number of students eligible for funding. Individuals enrolled on more than one course of study are counted more than once.
2 Proportion of young people/adults in part-time arts education Speech arts 70,000
number
Dance 4.5%
12.2%
60,000
50,000
95.5%
87.8%
40,000
4 Changes in the number of course participants in part-time arts education by subject
30,000
20,000
90,000
80,000
10,000 44,169
58,581
18,357
11,484
18,932
21,308
892
2,081
0 Young people
Visual arts
Speech arts
80,390
80,299
80,829
80,354
58,565
59,200
59,750
60,595
60,000
Dance
21,007
20,778
20,805
20793
20,681
20,438
10,375
11,386
12,102
12,360
12,470
12,376
2009-2010
2010-2011
2011-2012
80,152
79,889
61,948
63,101
70,000
age group
Adults
Music
number
50,000
40,000
30,000 20,000 10,000
0
Visual arts
Music
2012-2013
Speech arts
2013-2014
2014-2015
school year
Dance
Flemish education in figures | school year 2014-2015 | 35