6 PART-TIME ARTS EDUCATION
SCHOOL POPULATION
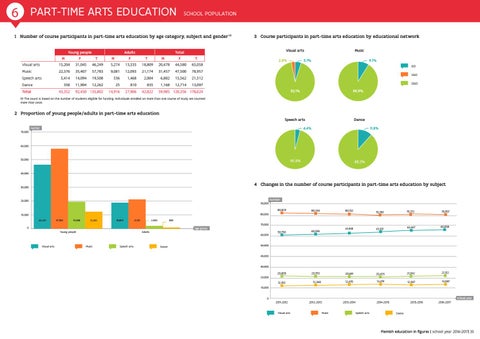
1 Number of course participants in part-time arts education by age category, subject and gender (1) Young people
Adults
M
F
T
Visual arts
15,204
31,045
46,249
Music
22,376
35,407
5,414 358
Speech arts Dance Total
43,352
M
3 Course participants in part-time arts education by educational network Visual arts
Total
F
T
M
F
T
5,274
13,535
18,809
20,478
44,580
65,058
57,783
9,081
12,093
21,174
31,457
47,500
78,957
14,094
19,508
536
1,468
2,004
6,882
15,562
21,512
11,904
12,262
25
810
835
1,168
12,714
13,097
92,450 135,802
14,916
27,906
42,822
Music
5.1%
2.8%
9.1% GO VGO OGO
92.1%
59,985 120,356 178,624
90.9%
(1) The count is based on the number of students eligible for funding. Individuals enrolled on more than one course of study are counted more than once.
2 Proportion of young people/adults in part-time arts education Speech arts
Dance
4.4%
number 70,000
11.8%
60,000
7,1%
50,000
95.5%
11,9% 88.2%
40,000
4 Changes in the number of course participants in part-time arts education by subject
30,000
20,000
90,000
number 80,829
80,354
59,750
60,595
20,805
20,793
80,000
10,000 46,249
57,783
19,508
12,262
18,809
21,174
80,152
78,789
79,372
78,957
61,948
63,101
64,447
65,058
20,681
20,435
21,042
21,512
12,470
13,479
12,937
13,097
835
2.004
70,000
0
age group Young people
Visual arts
Adults
Music
Speech arts
60,000
Dance
50,000
40,000
30,000 20,000
12,102
12,360
10,000
0
2011-2012 Visual arts
2012-2013 Music
2013-2014
2014-2015 Speech arts
2015-2016
2016-2017
school year
Dance
Flemish education in figures | school year 2016-2017| 35