6 PART-TIME ARTS EDUCATION
SCHOOL POPULATION
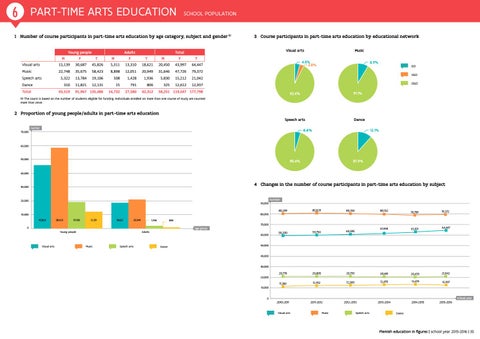
1 Number of course participants in part-time arts education by age category, subject and gender (1) Young people
Adults
M
F
T
Visual arts
15,139
30,687
45,826
Music
22,748
35,675
5,322 310
Speech arts Dance
43,519
Total
M
3 Course participants in part-time arts education by educational network Visual arts
Total
F
T
M
F
T
5,311
13,310
18,621
20,450
43,997
64,447
58,423
8,898
12,051
20,949
31,646
47,726
79,372
13,784
19,106
508
1,428
1,936
5,830
15,212
21,042
11,821
12,131
15
791
806
325
12,612
12,937
91,967 135,486
14,732
27,580
42,312
Music
4.8% 2.8%
8.9%
GO VGO OGO
58,251 119,547 177,798
91.1%
92.4%
(1) The count is based on the number of students eligible for funding. Individuals enrolled on more than one course of study are counted more than once.
2 Proportion of young people/adults in part-time arts education Speech arts 70,000
number
Dance
4.6%
12.1%
60,000
50,000
87.9%
95.4%
40,000
4 Changes in the number of course participants in part-time arts education by subject
30,000
20,000
90,000
80,000
10,000 45,826
58,423
19,106
12,131
18,621
20,949
number 80,299
80,829
80,354
59,200
59,750
60,595
20,778
20,805
11,386
2010-2011
80,152
78,789
79,372
61,948
63,101
64,447
20,793
20,681
20,435
21,042
12,102
12,360
12,470
13,479
12,937
2011-2012
2012-2013
2013-2014
806
1,936
70,000
0 Young people
Visual arts
age group
Adults
Music
Speech arts
60,000
Dance
50,000
40,000
30,000 20,000 10,000
0
school year
Visual arts
Music
Speech arts
2014-2015
2015-2016
Dance
Flemish education in figures | school year 2015-2016 | 35