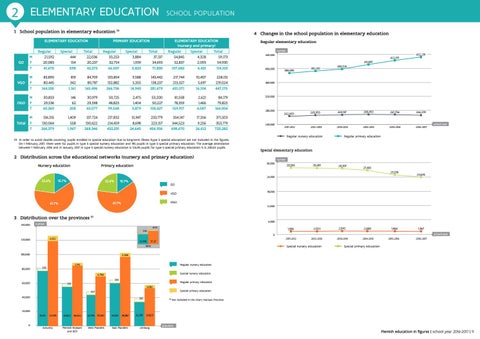
Elementaryeducation Leerlingen EDUCATION SCHOOL POPULATION 2 ELEMENTARY 1 School population in elementary education (1) ELEMENTARY EDUCATION
4 Changes in the school population in elementary education
PRIMARY EDUCATION
ELEMENTARY EDUCATION (nursery and primary) Regular Special Total 54,845 4,328 59,173 52,837 2,093 54,930 107,682 6,421 114,103
M F T
Regular 21,592 20,083 41,675
Special 444 154 598
Total 22,036 20,237 42,273
Regular 33,253 32,754 66,007
Special 3,884 1,939 5,823
Total 37,137 34,693 71,830
VGO
M F T
83,890 80,445 164,335
819 342 1,161
84,709 80,787 165,496
133,854 132,882 266,736
9,588 5,355 14,943
143,442 138,237 281,679
217,744 213,327 431,071
10,407 5,697 16,104
228,151 219,024 447,175
OGO
M F T
30,833 29,536 60,369
146 62 208
30,979 29,598 60,577
50,725 48,823 99,548
2,475 1,404 3,879
53,200 50,227 103,427
81,558 78,359 159,917
2,621 1,466 4,087
84,179 79,825 164,004
M Total F T
136,315 130,064 266,379
1,409 558 1,967
137,724 130,622 268,346
217,832 214,459 432,291
15,947 8,698 24,645
233,779 223,157 456,936
354,147 344,523 698,670
17,356 9,256 26,612
371,503 353,779 725,282
GO
(1) In order to avoid double counting, pupils enrolled in special education due to long-term illness (type 5 special education) are not included in the figures. On 1 February 2017, there were 132 pupils in type 5 special nursery education and 195 pupils in type 5 special primary education. The average attendance between 1 February 2016 and 31 January 2017 in type 5 special nursery education is 126,95 pupils; for type 5 special primary education it is 200,63 pupils.
Regular elementary education number 440,000
400,000
386,696
392,351
399,729
360,000
320,000
280,000
240,000
262,603
265,953
269,197
268,453
267,756
266,379
2011-2012
2012-2013
2013-2014
2014-2015
2015-2016
2016-2017
Regular nursery education
Regular primary education
number
28,566
28,481
28,307
27,483 25,578
22.6%
24,000
15.7%
22.6%
15.7%
18,000
OGO
61.7%
12,000
3 Distribution over the provinces (1) 140,000
24,645
GO VGO
61.7%
6,000
number 623
144
1,986
2,023
2,042
2,000
1,984
1,967
2011-2012
2012-2013
2013-2014
2014-2015
2015-2016
2016-2017
school year
0 6,932
120,000
11,768 12,948
17.,57
BCR 100,000
80,000
school year
Special elementary education 30,000
Primary education
432,291
411,097
2 Distribution across the educational networks (nursery and primary education) Nursery education
422,911
Special nursery education
Special primary education
5,306 2,916
593
Regular nursery education Special nursery education
4,786 399
60,000
Regular primary education
293
4,082 Special primary education
337 40,000
345
(1)
Not included in the chart: Hainaut Province
20,000 76,511 0
121,976
Antwerp
54,822
86,642
Flemish Brabant and BCR
42,756 70,901
59,461
West Flanders
East Flanders
98,887
32,785
53,825
Limburg
province
Flemish education in figures | school year 2016-2017 | 11