Elementary education Leerlingen EDUCATION SCHOOL POPULATION 2 ELEMENTARY 1 School population in elementary education (1) ELEMENTARY EDUCATION
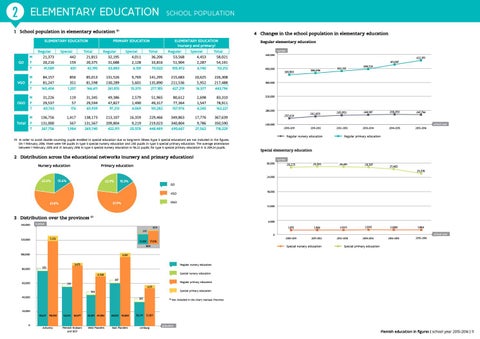
4 Changes in the school population in elementary education
PRIMARY EDUCATION
ELEMENTARY EDUCATION (nursery and primary) Regular Special Total 53,568 4,453 58,021 51,904 2,287 54,191 105,472 6,740 112,212
M F T
Regular 21,373 20,216 41,589
Special 442 159 601
Total 21,815 20,375 42,190
Regular 32,195 31,688 63,883
Special 4,011 2,128 6,139
Total 36,206 33,816 70,022
VGO
M F T
84,157 81,247 165,404
856 351 1,207
85,013 81,598 166,611
131,526 130,289 261,815
9,769 5,601 15,370
141,295 135,890 277,185
215,683 211,536 427,219
10,625 5,952 16,577
226,308 217,488 443,796
OGO
M F T
31,226 29,537 60,763
119 57 176
31,345 29,594 60,939
49,386 47,827 97,213
2,579 1,490 4,069
51,965 49,317 101,282
80,612 77,364 157,976
2,698 1,547 4,245
83,310 78,911 162,221
M Total F T
136,756 131,000 267,756
1,417 567 1,984
138,173 131,567 269,740
213,107 209,804 422,911
16,359 9,219 25,578
229,466 219,023 448,489
349,863 340,804 690,667
17,776 9,786 27,562
367,639 350,590 718,229
GO
(1) In order to avoid double counting, pupils enrolled in special education due to long-term illness (type 5 special education) are not included in the figures. On 1 February 2016, there were 139 pupils in type 5 special nursery education and 230 pupils in type 5 special primary education. The average attendance between 1 February 2015 and 31 January 2016 in type 5 special nursery education is 116.22 pupils; for type 5 special primary education it is 209.24 pupils.
Regular elementary education number 440,000
400,000
392,351
399,729
320,000
280,000
257,424
262,603
265,953
269,197
268,453
267,756
2011-2012
2012-2013
2013-2014
2014-2015
2015-2016
school year
240,000 2010-2011
Regular nursery education
Regular primary education
Special elementary education number 30,000
Primary education
381,983
386,696
360,000
2 Distribution across the educational networks (nursery and primary education) Nursery education
422,911 411,097
28,225
28,566
28,481
28,307
27,483 25,578
22.6%
24,000
15.6%
22.9%
15.3%
GO 18,000
VGO OGO
61.9%
61.8%
12,000
3 Distribution over the provinces (1) 140,000
6,000
number 613
142
0 7,253
120,000
11,768 12,696
17,036
BCR 100,000
80,000
1,975
1,986
2010-2011
2011-2012
2,023
2,042
2,000
1,984
2013-2014
2014-2015
2015-2016
school year
Special nursery education
2012-2013
Special primary education
5,551 3,673
570
Regular nursery education Special nursery education
4,930 397
60,000
Regular primary education
299
4,171 Special primary education
353 40,000
365
(1)
Not included in the chart: Hainaut Province
20,000 76,627 0
118,933
Antwerp
54,492
84,677
Flemish Brabant and BCR
43,301 69,584
West Flanders
60,051
96,840
East Flanders
33,241
52,821
Limburg
province
Flemish education in figures | school year 2015-2016 | 11