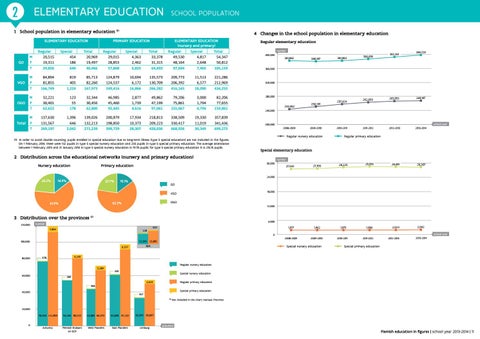
education Leerlingen ELEMENTARY EDUCATION SCHOOL POPULATION 2 Elementary 1 School population in elementary education (1) Elementary education
4 Changes in the school population in elementary education
Primary education
elementary education (nursery and primary) Regular Special Total 49,530 4,817 54,347 48,164 2,648 50,812 97,694 7,465 105,159
M F T
Regular 20,515 19,311 39,826
Special 454 186 640
Total 20,969 19,497 40,466
Regular 29,015 28,853 57,868
Special 4,363 2,462 6,825
Total 33,378 31,315 64,693
VGO
M F T
84,894 81,855 166,749
819 405 1,224
85,713 82,260 167,973
124,879 124,537 249,416
10,694 6,172 16,866
135,573 130,709 266,282
209,773 206,392 416,165
11,513 6,577 18,090
221,286 212,969 434,255
OGO
M F T
32,221 30,401 62,622
123 55 178
32,344 30,456 62,800
46,985 45,460 92,445
2,877 1,739 4,616
49,862 47,199 97,061
79,206 75,861 155,067
3,000 1,794 4,794
82,206 77,655 159,861
M Total F T
137,630 131,567 269,197
1,396 646 2,042
139,026 132,213 271,239
200,879 198,850 399,729
17,934 10,373 28,307
218,813 209,223 428,036
338,509 330,417 668,926
19,330 11,019 30,349
357,839 341,436 699,275
GO
(1) In order to avoid double counting, pupils enrolled in special education due to long-term illness (type 5 special education) are not included in the figures. On 1 February 2014, there were 132 pupils in type 5 special nursery education and 235 pupils in type 5 special primary education. The average attendance between 1 February 2013 and 31 January 2014 in type 5 special nursery education is 111.78 pupils; for type 5 special primary education it is 215.15 pupils.
Regular elementary education number 400,000
23.2%
22.7%
15.1%
280,000
243,482
250,391
257,424
262,603
265,953
269,197
2011-2012
2012-2013
2013-2014
240,000
school year
200,000 2008-2009
2009-2010
Regular nursery education
2010-2011
Regular primary education
Special elementary education number
27,543
27,705
28,225
28,566
28,481
28,307
1,977
1,962
1,975
1,986
2,023
2,042
2008-2009
2009-2010
2011-2012
2012-2013
18,000
OGO 12,000
3 Distribution over the provinces (1)
6,000
number 7,894
128
622 0
11.768 15,801 12,342
100,000
BCR
6,257
school year
Special nursery education
2010-2011
2013-2014
Special primary education
4,149
578
5,384 60,000
399,729
GO
62.2%
61.9%
80,000
392,351
24,000
14.9%
VGO
120,000
386,696
320,000
30,000
Primary education
380,197
381,983
360,000
2 Distribution across the educational networks (nursery and primary education) Nursery education
381,882
Regular nursery education 450
Special nursery education
289 4,623
Regular primary education
368 40,000
Special primary education
357 (1)
Not included in the chart: Hainaut Province
20,000
0
76,534 111,853
54,165 80,222
44,002 66,372
61,096 91,132
33,354 50,097
Antwerp
Flemish Brabant en BCR
West Flanders
East Flanders
Limburg
province
Flemish education in figures | school year 2013-2014 | 11