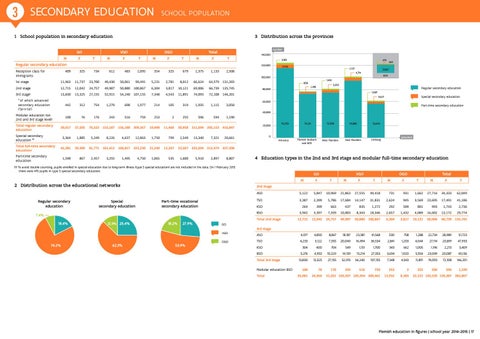
Elementary education EDUCATIONLeerlingen SCHOOL POPULATION 3 SECONDARY 1 School population in secondary education GO M
F
3 Distribution across the provinces VGO
T
M
F
OGO T
M
number
Total
F
T
M
F
T
Regular secondary education 409
Reception class for immigrants
140,000 3,183 120,000
325
734
612
483
1,095
354
325
679
1,375
1,133
473
5,943
2,127
2,508
1st stage
11,963
11,737
23,700
49,430
50,061
99,491
5,231
2,781
8,012
66,624
64,579 131,203
2nd stage
12,715
12,042
24,757
49,987
50,880 100,867
6,304
3,817
10,121
69,006
66,739 135,745
13,830
3rd stage
*
13,325
27,155
52,915
54,240 107,155
7,348
4,543
11,891
74,093
858
Regular secondary education 1,007
442
312
754
1,279
698
1,977
214
105
319
1,935
1,115
3,050
Modular education (on 2nd and 3rd stage level)
100
76
176
243
516
759
253
2
255
596
594
1,190
Total regular secondary education
39,017
37,505
76,522 153,187 156,180 309,367
19,490
11,468
3,364
1,885
12,863
1,750
799
42,381
39,390
81,771 161,413 160,817 322,230
21,240
12,267
1,590
867
1,065
535
Special secondary education
3,627
*
60,000
Part-time secondary education 40,000
Special secondary education (1) Total full-time secondary education
3,959
2,418
80,000
BCR
1,632
72,108 146,201
of which advanced secondary education (‘Se-n-Se’)
13,867
4,714 100,000
669
Part-time secondary education
5,249
2,457
8,226
3,255
4,637
1,495
4,750
2,549
13,340
7,321
115,959
20,000
30,958 211,694 205,153 416,847
0
20,661
Antwerp
74,261
Flemish Brabant and BCR
1,600
5,910
2,897
8,807
12.3% 25.4%
Part-time vocational secondary education
18.2%
27.9%
62.3%
East Flanders
Limburg
GO
province
F
VGO
OGO
T
M
F
T
M
F
Total T
M
F
T
53.9%
ASO
5,122
5,847
10,969
21,863
27,555
49,418
731
931
1,662
27,716
34,333
62,049
TSO
3,387
2,399
5,786
17,684
14,147
31,831
2,624
945
3,569
23,695
17,491
41,186
KSO
264
399
663
437
835
1,272
292
509
801
993
1,743
2,736
BSO
3,942
3,397
7,339
10,003
8,343
18,346
2,657
1,432
4,089
16,602
13,172
29,774
12,715
12,042
24,757
49,987
50,880 100,867
6,304
3,817
10,121
69,006
66,739 135,745
ASO
4,017
4,850
8,867
18,187
23,381
41,568
530
758
1,288
22,734
28,989
51,723
TSO
4,233
3,122
7,355
20,040
16,494
36,534
2,841
1,203
4,044
27,114
20,819
47,933
KSO
304
400
704
549
1,151
1,700
343
662
1,005
1,196
2,213
3,409
BSO
5,276
4,953
10,229
14,139
13,214
27,353
3,634
1,920
5,554
23,049
20,087
43,136
13,830
13,325
27,155
52,915
54,240
107,155
7,348
4,543
11,891
74,093
72,108
146,201
100
76
176
243
516
759
253
2
255
596
594
1,190
26,081
24,950
51,031 103,507 105,954 209,461
13,932
8,383
Total 2nd stage GO VGO
74.2%
West Flanders
2nd stage
7.4% 18.4%
56,649
4 Education types in the 2nd and 3rd stage and modular full-time secondary education
M
2 Distribution across the educational networks Special secondary education
94,880
33,507 225,034 212,474 437,508
(1) To avoid double counting, pupils enrolled in special education due to long-term illness (type 5 special education) are not included in the data. On 1 February 2015 there were 470 pupils in type 5 special secondary education.
Regular secondary education
75,098
OGO
3rd stage
Total 3rd stage Modular education BSO Total
22,315 143,520 139,287 282,807
Flemish education in figures | school year 2014-2015 | 17