17_089_1 FHR reports
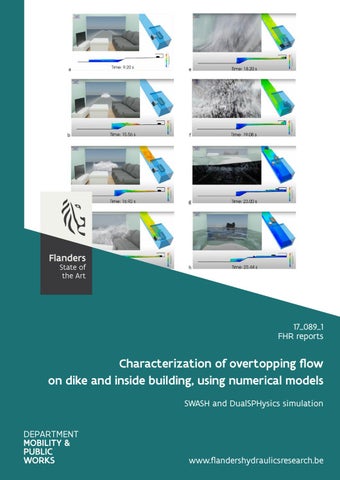
Characterization of overtopping flow on dike and inside building, using numerical models SWASH and DualSPHysics simulation
www.flandershydraulicsresearch.be
Characterization of overtopping flow on dike and inside building, using numerical models SWASH and DualSPHysics simulation
Suzuki, T.; Altomare, C.; Garcia-Feal, O.; Verwaest, T.; Mostaert, F.
Cover figure © The Government of Flanders, Department of Mobility and Public Works, Flanders Hydraulics Research Legal notice Flanders Hydraulics Research is of the opinion that the information and positions in this report are substantiated by the available data and knowledge at the time of writing. The positions taken in this report are those of Flanders Hydraulics Research and do not reflect necessarily the opinion of the Government of Flanders or any of its institutions. Flanders Hydraulics Research nor any person or company acting on behalf of Flanders Hydraulics Research is responsible for any loss or damage arising from the use of the information in this report. Copyright and citation © The Government of Flanders, Department of Mobility and Public Works, Flanders Hydraulics Research 2020 D/2020/3241/302 This publication should be cited as follows: Suzuki, T.; Altomare, C.; Garcia-Feal, O.; Verwaest, T.; Mostaert, F. (2020). Characterization of overtopping flow on dike and inside building, using numerical models: SWASH and DualSPHysics simulation. Version 1.0. FHR reports, 17_089_1. Flanders Hydraulics Research: Antwerp Reproduction of and reference to this publication is authorised provided the source is acknowledged correctly. Document identification Customer: Keywords (3-5): Knowledge domains: Text (p.): Confidential:
Flanders Hydraulics Research Ref.: WL2020R17_089_1 Overtopping; overtopping flow; shallow foreshore; SWASH; DualSPHysics Coastal protection > Coastal safety against extreme storms > Sea dikes > Numerical modelling 24 Appendices (p.): / ܈No ܈Available online
Author(s):
Suzuki, T.; Garcia-Feal, O.
Control Name Reviser(s):
Project leader:
Altomare, C.
Verwaest, T.
Signature CORRADO ALTOMARE DNI Y0838488Z
Firmado digitalmente por CORRADO ALTOMARE - DNI Y0838488Z Fecha: 2021.02.01 11:57:29 +01'00'
Getekend door:Toon Verwaest (Signature Getekend op:2021-02-01 13:29:32 +01:0 Reden:Ik keur dit document goed
Approval Head of Division:
F-WL-PP10-2 Version 7 Valid as from 3/01/2017
Mostaert, F.
Getekend door:Frank Mostaert (Signature Getekend op:2021-02-01 12:56:29 +01:0 Reden:Ik keur dit document goed
Characterization of overtopping flow on dike and inside building, using numerical models - SWASH and DualSPHysics simulation
Abstract The global climate change has manifold impacts on the ocean and its behaviour which directly translates to the coastal/nearshore region as well as the governing processes. One such climate-induced response of the coastal region is the increased frequency and intensity of extreme waves, leading to increased overtopping risk. To adopt effective countermeasures, it is useful to understand the overtopping processes in detail. In this report, wave overtopping flow is simulated using two numerical models, SWASH and DualSPHysics, to understand overtopping flow characteristics on the promenade and inside buildings representing ones that exist along the Belgian coast. The investigation in SWASH quantifies the relationship between the overtopping discharge and the possibility fora person to tumble, as well as the relationship between the overtopping discharge and the possibility for windows to be destroyed by overtopping waves. In the second part in order to understand the risk of overtopping, a new coupling method is established. Through the state-of-the-art visualization technique, DualSPHysics simulation results are visualized. Thanks to the visualization the process of overtopping bore is now revealed, and we can understand what can happen during the inundation in the case of severe overtopping. The DualSPHysics 3D simulation reveals that there is a risk when the wave motion combines with furniture.
Final version
WL2020R17_089_1
III
F-WL-PP10-2 Version 7 Valid as from 3/01/2017
Characterization of overtopping flow on dike and inside building, using numerical models - SWASH and DualSPHysics simulation
Contents Abstract ............................................................................................................................................................ III Contents ............................................................................................................................................................ V List of tables...................................................................................................................................................... VI List of Figures ................................................................................................................................................... VII 1
Introduction ............................................................................................................................................... 1
2
Numerical models...................................................................................................................................... 2
3
2.1
Overview ............................................................................................................................................ 2
2.2
SWASH model .................................................................................................................................... 2
2.3
DualSPHysics model........................................................................................................................... 2
2.4
Coupling method ............................................................................................................................... 3
Overtopping flow characterization using SWASH ..................................................................................... 4 3.1
3.1.1
Target average overtopping discharge ...................................................................................... 4
3.1.2
Test matrix ................................................................................................................................. 4
3.1.3
Bathymetry ................................................................................................................................ 5
3.1.4
Model settings ........................................................................................................................... 6
3.2
Overtopping flow properties compared with q................................................................................. 7
3.2.1
q-Vmax relationship .................................................................................................................. 7
3.2.2
q-hmax and q-umax relationship............................................................................................... 8
3.2.3
Discussions................................................................................................................................. 9
3.3
Overtopping flow force and q ......................................................................................................... 10
3.3.1
Physical model test .................................................................................................................. 10
3.3.2
Reduction factor ...................................................................................................................... 10
3.3.3
q-F relationship from SWASH .................................................................................................. 12
3.3.4
Strength of windows................................................................................................................ 12
3.4
4
Settings .............................................................................................................................................. 4
Overtopping flow properties inside buildings ................................................................................. 13
3.4.1
Stability of human.................................................................................................................... 13
3.4.2
Discussion and conclusion ....................................................................................................... 17
Overtopping flow characterization inside building using DualSPHysics+SWASH.................................... 18 4.1
Overtopping risk inside an apartment............................................................................................. 18
4.2
Modified coupling method .............................................................................................................. 19
5
Conclusions .............................................................................................................................................. 22
6
References ............................................................................................................................................... 23
Final version
WL2020R17_089_1
V
Characterization of overtopping flow on dike and inside building, using numerical models - SWASH and DualSPHysics simulation
List of tables Table 1 – Variation of test parameters.............................................................................................................. 4
VI
WL2020R17_089_1
Final version
Characterization of overtopping flow on dike and inside building, using numerical models - SWASH and DualSPHysics simulation
List of Figures Figure 1 – Building facade in de Haan (left) and Raversijde (right) ................................................................... 1 Figure 2 – Bathymetries..................................................................................................................................... 5 Figure 3 – q-V relationship (with and without promenade).............................................................................. 7 Figure 4 – q-hmax (upper panel) and q-umax (lower panel) relationships ....................................................... 8 Figure 5 – time series of h and u (cases with q~1 l/s/m)................................................................................... 9 Figure 6 – q-F relationship obtained in the CREST experiment ....................................................................... 10 Figure 7 – Reduction factor of the promenade (upper: reduction due to the promenade, lower: reduction due to higher crest level) ........................................................................................................................................ 11 Figure 8 – Force estimation using SWASH for different promenade width .................................................... 12 Figure 9 – Configuration of R bathymetry. Promenade width 0 m (upper) and 20 m (lower) ....................... 13 Figure 10 – RSK_R_7_3_12_69_90_00 (prom 0 m, q~1 l/s/m) ....................................................................... 14 Figure 11 – RSK_R_7_3_12_69_85_20 (prom 20 m, q~1 l/s/m) ..................................................................... 15 Figure 12 – RSK_R_7_5_12_69_90_00 (prom 0 m, q~10 l/s/m) ..................................................................... 16 Figure 13 – RSK_Q_7_5_12_69_85_00 (prom 20 m, q~10 l/s/m)................................................................... 17 Figure 14 – Calibration of wave boundary condition at the coupling point between DualSPHysics and SWASH ......................................................................................................................................................................... 20 Figure 15 – Visualization of DualSPHysics calculations ................................................................................... 21
Final version
WL2020R17_089_1
VII
Characterization of overtopping flow on dike and inside building, using numerical models - SWASH and DualSPHysics simulation
1 Introduction In order to maintain certain safety levels in the Belgian coast, the Flemish government conducts Safety Assessment every 6 years and executes countermeasures where they are necessary. An average overtopping discharge q of 1 l/s/m at the safety line during the occurrence of superstorms (i.e. 1000-year storm) is the present criteria in the Safety Assessment to assess the coastal safety level in Belgium. We presume that the number of victims due to the superstorm is limited if the overtopping discharge is less than this criterion. However, the criterion of 1 l/s/m could be optimised rigorously investigating the risks for people (i.e. casualties). Especially, the risk for people on the promenade and inside the buildings during superstorms has not been thoroughly studied and discussed yet. We do not assume that there would be people on the promenade during the extreme conditions, however, there is a high chance of people living in the ground floor of the buildings situated on those promenades. As it can be seen in Figure 1 - Google Earth street view images taken at the Belgian coast, the entrance door and windows of the ground floor rooms are directly facing the sea. Therefore, risk for people residing inside these buildings is not an exception: overtopping flow might propagate inside through the windows and doors, if those are broken by the overtopping flow impact. However again, we do know what kind of overtopping flow can cause damage to the doors and windows and break them. In Eurotop II, individual overtopping volume (V) of 600 l/m is one criterion to assess risk for pedestrians but it does not give further detailed explanation. We are particularly interested in how our criterion of 1 l/s/m corresponds to the overtopping characteristics, Vmax (maximum individual volume), hmax (maximum overtopping flow depth) and umax (maximum overtopping flow velocity). By investigating these variables we can understand the physical phenomena and the associated risk better. Even further, we are also interested in knowing how the maximum forcing due to Vmax, hmax and umax impacts the people residing inside the buildings. In order to evaluate that, first we need to know if the windows and doors can be destroyed by the overtopping flow. Therefore, force estimation is also one of our interests in this study. In summary, overtopping flows on promenade and inside the buildings are characterised in this study using the state-of-the-art numerical models. It is further discussed that which conditions are critical for safety living along the Belgian coast. Towards this, we investigate the below variables: • • •
Overtopping flow characteristics (i.e. q-Vmax, q-hmax, q-umax relationships) Overtopping flow force on a vertical wall (i.e. q-Fmax relationship) Quantitative evaluation of flow inside buildings and possible risk (i.e. u-h time series) Figure 1 – Building facade in de Haan (left) and Raversijde (right)
Final version
WL2020R17_089_1
1
Characterization of overtopping flow on dike and inside building, using numerical models - SWASH and DualSPHysics simulation
2 Numerical models 2.1 Overview In order to understand overtopping flow on the dike (on the promenade/inside building) numerical models are applied. Numerical models are useful as it is much easier to investigate flow structure compared to physical model tests where often only point measurement is feasible. It is also possible to visualize the flow pattern interacting with structures and objects. First, the SWASH model (Zijlema et al., 2011) is used to investigate overtopping flow characteristics (q-Vmax, q-hmax, q-umax relationships) and overtopping flow force on a vertical wall. Second, the flow inside buildings is visualized by coupling DualSPHysics and SWASH such that discussion on possible risks for the people residing inside promenade buildings can be established. Motivation of the coupling method is described as follows: In Belgium, the foreshore is characterised by the combination of the relatively mild slope (e.g. 1/35-1/50) and the very or extremely shallow water at the toe of the dike (Hofland et al., 2017). This configuration makes it inefficient to apply a detailed CFD model (e.g. DualSPHysics, OpenFOAM) standalone, since the computational domain is too large and one test run takes longer duration thereby increasing the computational. Instead of using standalone CFD model, coupling relatively lighter models will be useful for the detailed modelling of the dike. Additionally, by selecting the time window including the biggest wave, the simulation time is further reduced. In this study, ML (multilayer) piston method (Altomare et al., 2015) is modified for the sake of coupling efficiency. This method uses DualSPHysics (Crespo et al., 2015) for the detailed wave-structure interaction based on mesh-free SPH method, while offshore and nearshore wave transformation is calculated by SWASH based on non-linear shallow water equation with non-hydrostatic pressure. Using this coupling method, the computational time will be drastically reduced while the quality of the wave is guaranteed. Such reduction on the computational cost is important in this kind of study where the simulation is done in 3D, which will cost much more computational time.
2.2 SWASH model Modelling in SWASH is conducted using one-layer approach for simplicity. The accuracy is guaranteed as it is validated in Suzuki et al. (2017) and Suzuki et al. (2018) for shallow foreshore configuration. Furthermore, the one-layer mode makes the post processing a bit easier for the treatment of overtopping layer characteristics (i.e. one velocity). Note that the wave tips on the dike become bore due to the heavy breaking on the shallow foreshore and thus the velocity is quasi uniform over the vertical profile.
2.3 DualSPHysics model DualSPHysics is used to understand how overtopping waves propagate inside the buildings. In this numerical experiment we also consider more realistic situation which includes furniture inside the room in the building apartment. Such interaction between fluid and multiple objects in practice are impossible with the currect state-of-the-art to model in mesh-based numerical models such as OpenFOAM, however it is relatively easy in SPH models such as DualSPHysics due to the nature of mesh-free methods. Note that DualSPHysics model has a sophisticated structure-structure interaction model (i.e. Chrono) but it is not used in this study since the purpose of this visualization is to understand overall behaviour of the objects in the flow during a time window of the highest overtopping event.
2
WL2020R17_089_1
Final version
Characterization of overtopping flow on dike and inside building, using numerical models - SWASH and DualSPHysics simulation
2.4 Coupling method We have established several different methods to couple SWASH and DualSPHysics. One of the earliest models is ML-Piston (multi-layered piston) method discussed in Altomare et al. (2015). In this method DualSPHysics uses layered velocity information at the coupling point which is calculated in SWASH. However, this method has a limitation that the coupling point cannot be placed at very shallow zone, due to incapability of the piston type boundary creating bore on the shallow foreshore with a limited volume of the water. Furthermore ML-Piston does not have active wave absorption system (i.e., re-reflection can occur at the piston) and thus it is not the best coupling model to simulate domains where reflection cannot be ignored. Note that the reflection problem was solved in Altomare et al. (2017) which implements the active wave absorption system for one layer mode. One of the latest coupling methods is the improved relaxation zone method (Altomare et al., 2018). This method does not have a physical piston but the DualSPHysics model controls the movement of the particles in a sophisticated way which makes it possible to avoid the influence of the reflection. We assumed that this method can consider the coupling point at a shallower zone, but it is still not fully capable to place the coupling point very close to the dike. Apart from SWASH-DualSPHysics coupling, Verbrugghe et al. (2018) developed an innovative method to couple other light wave models with DualSPHysics by means of the inlet and outlet method. This method is, in practice, a two-way coupling achieved using python script (exchanged velocity data each other at the coupling point). The purpose of the DualSPHysics calculation is to visualize the biggest overtopping flow inside an apartment, including some wave-object interaction to see how wave influences the furniture inside the apartment. Taking into account the fact that the time window of the one biggest wave (or bore) propagating from the toe of the dike to the apartment is short (e.g. ~30 s) and thus it is possible to ignore the influence of the rereflection at the boundary of the wave generation even if the boundary is located very close to the toe of the dike. Therefore, we use one layered piston for the coupling for the sake of simplicity. However as stated above, the water volume is not enough for the one layered piston to generate the biggest bore in very shallow zone (i.e. close to the toe) if we use normal methodology of the coupling (passing velocity data calculated in SWASH to DualSPHysics). Therefore, we calibrated the movement of the one layered piston in order to find the optimal movement able to represent the biggest wave.
Final version
WL2020R17_089_1
3
Characterization of overtopping flow on dike and inside building, using numerical models - SWASH and DualSPHysics simulation
3 Overtopping flow SWASH
characterization
using
3.1 Settings 3.1.1
Target average overtopping discharge
In this study it is important to obtain wide range of variations of the overtopping discharges in order to understand the overall overtopping flow characteristics on the dike/inside building. To this end, we tried to obtain the wide range of average overtopping discharges in 3 different orders, namely 1, 10, and 100 l/s/m. Note that those different average overtopping discharges are achieved by changing the input conditions (see next section). Even though the safety criteria for the Belgian coast is fixed at 1 l/s/m as of now, however it is important to see the phenomena and the consequences of the different average overtopping discharges. Those will also be used for further discussion of new criteria and future sea level rise scenarios. 3.1.2
Test matrix
Test matrix is created based on the CREST wave basin test (project number 17_039) which overtopping discharge will be in the range of 0-500 l/s/m. Note that the matrix is not exactly the same (e.g. only one wave period, two dike toe, four crest levels, and two promenade width). The setting of the numerical model is also not exactly of the same condition as the physical model (e.g. one-layer calculation and only limited to long crested waves; the bathymetry is not exactly the same – no transition slope). The variation of the parameters is shown in Table 1. Note that the identification of the test (example) is expressed as below: •
RSK_Q_7_3_12_65_85_00 project name_test type_water level_wave height_period_dike toe_dike crest_promenade width Table 1 – Variation of test parameters
Project name abb.
Test type
RSK
Q V R
4
Water level [m TAW] 7 8
Offshore wave height [m]
Offshore wave period [s]
Level dike toe [m TAW]
Level dike crest [m TAW]
Promenade length [m]
3 4 5
12
6.5 6.9
8.5 9.0 9.5 10.0
0 20
WL2020R17_089_1
Final version
Characterization of overtopping flow on dike and inside building, using numerical models - SWASH and DualSPHysics simulation
3.1.3
Bathymetry
Bathymetry is created for each configuration following the rules listed below. • • • • • • •
Flat bottom at -15 m TAW is created for 200 m in front of the wave generator Foreshore slope is 1/35 connecting the flat bottom to the dike toe point Dike slope is 1/2 connecting the dike toe point to the dike crest point Promenade is 1/50 and extends the length specified Test type Q is aimed to obtain overtopping, and thus no vertical wall at the end of the promenade Test type V is aimed to obtain overtopping flow characteristics with a vertical wall Test type R is aimed to obtain overtopping flow characteristics with an apartment room and a vertical wall
The bathymetry is categorized into 6 listed below (also shown in Figure 2). • • • • • •
RSK-Q-00: overtopping estimation, without promenade (1/50 slope) RSK-Q-20: overtopping estimation, with 20 m promenade (1/50 slope) RSK-V-00: force estimation at the wall, without promenade (1/50 slope) RSK-V-20: force estimation at the wall, with 20 m promenade (1/50 slope) RSK-R-00: velocity estimation in a 5 m room (flat bottom) without promenade (1/50 slope) RSK-R-20: velocity estimation in a 5 m room (flat bottom) with 20 m promenade (1/50 slope) Figure 2 – Bathymetries
RSK-Q-7-3-12-65-85-00
10
0 -10 0
100
200
300
400
500
600
700
800
900
1000
1100
Level [m TAW]
Level [m TAW]
10
5 930
940
950
x [m]
RSK-Q-7-3-12-65-85-20
-10 0
100
200
300
400
500
600
700
800
900
1000
1100
5 930
940
950
x [m]
200
300
400
500
600
700
800
900
1000
1100
Level [m TAW]
Level [m TAW]
0
100
5 930
940
950
x [m]
200
300
400
500
600
700
800
900
1000
1100
Level [m TAW]
Level [m TAW]
0
100
5 930
940
950
x [m]
200
300
400
500
600
700
800
900
1000
1100
Level [m TAW]
Level [m TAW]
0
100
5 930
940
950
x [m]
200
300
400
500
600
700
800
900
x [m]
1000
1100
Level [m TAW]
Level [m TAW]
0
100
960
970
980
960
970
980
970
980
10
-10 0
980
x [m]
RSK-R-7-3-12-65-85-20
10
970
10
-10 0
960
x [m]
RSK-R-7-3-12-65-85-00
10
980
10
-10 0
970
x [m]
RSK-V-7-3-12-65-85-20
10
960
10
-10 0
980
x [m]
RSK-V-7-3-12-65-85-00
10
970
10
0
Level [m TAW]
Level [m TAW]
10
960
x [m]
5 930
940
950
960
x [m]
*Red points indicate velocity measurement points
Final version
WL2020R17_089_1
5
Characterization of overtopping flow on dike and inside building, using numerical models - SWASH and DualSPHysics simulation
3.1.4
Model settings
Version of SWASH model and calculation environment The SWASH version 5.01 is used here. Calculations are conducted in the high computing cluster of FHR, mostly using the node named ‘stevin’. Only serial runs were executed as the parallel runs does not accelerate the calculation significantly and the size of the print file is still kept minimum. Grid resolution 0.5 m grid is used for this study. 0.5 m is currently being used for the safety assessment (Safety Assessment 2015; Suzuki et al., 2016). Number of fluid layer The SWASH model was validated for overtopping estimations for mild slope and very and extremely shallow foreshores based on one-layer (Suzuki et al., 2017). The one-layer settings might give some error on 2nd order wave generation and wave propagation due to dispersion relation error according to Rijnsdorp et al. (2014). However, the error is somewhat limited (as shown in Suzuki et al., 2018) and for the simplicity of the modelling, we decided to use one-layer mode in this study. We always evaluate flow properties or force linked to the average overtopping discharge q at the same location, so the error due to the wave generation or wave propagation will be negligible. Wave generation 2nd order wave generation is activated, so that low frequency waves are included (while the accuracy is not the best with one-layer calculation). Breaking Standard wave breaking control parameters, alpha=0.6 and beta=0.3 are used for wave breaking, and those values are also used in Suzuki et al. (2017). Bottom friction The Manning formula with a Manning’s coefficient of 0.019 is used to represent bottom friction for the entire domain, both for sandy beach and the dike. Note that 0.019 is recommended value for wave simulations in the user manual. This must be due to the fact that the Manning’s coefficient for sand (e.g. the grain size of 0.3-0.4 mm) is around this value. For the dike it is assumed that the bottom of the promenade is often an unfinished concrete, and which Manning’s coefficient is around 0.014-0.020 and thus 0.019 should be an acceptable choice according to Suzuki et al. (2018). Numeric As for the numeric, the Keller-box scheme is used for the simulation since the number of the vertical layer is one. The momentum scheme is moment conservative. MUSCL limiter is used for the discretization to achieve second order accuracy. Time integration is explicit and a maximum Courant number of 0.5 is used to cope with high and nonlinear waves used in this study.
6
WL2020R17_089_1
Final version
Characterization of overtopping flow on dike and inside building, using numerical models - SWASH and DualSPHysics simulation
3.2 Overtopping flow properties compared with q 3.2.1
q-Vmax relationship
The mean overtopping discharge, q, is in general defined as a time averaged overtopping discharge over statistically significant number of waves. Goda (2010) mentioned that the minimum number of waves can be 100 but recommends to consider more number of waves e.g. 1000 waves. We typically use 1000 waves which corresponds to 3h 20 min duration in real time when Tp=12s (cfr. Safety Assessment 2015). However, we here divided the 1000 waves into 3 portions (each portion roughly one hour), in order to get more examples. It is noted that 300 waves’ result are still possible to reduce results dispersion based on the discussion in Romano et al. (2015). Figure 3 shows the relationship between q and V (overtopping volume of one event) for the cases with promenade at 0 and 20 m. As shown in the figure, 1 l/s/m gives maximum overtopping volume Vmax around 1000-2000 l/m for both cases (no significant difference). CREST physical model result (only with promenade = 0 m) has almost the same results. From this result we can say that Vmax is determined by q. Even though Allsop et al. (2008) indicated that the maximum individual overtopping volumes are more suitable hazard indicators, yet in this case Vmax and q both give the same information. This might be due to the fact that the incident significant wave height in the shallow foreshore case is not significantly different at the toe of the dike (toe depth is 0.5 m) for different offshore wave conditions. Figure 3 – q-V relationship (with and without promenade) 10
5
SWASH shallow prom0m SWASH shallow prom20m
V [l/m]
10
4
10 3
10
10
2
1
10
-2
10
-1
10 0
10
1
10
2
10 3
q [l/s/m]
Final version
WL2020R17_089_1
7
Characterization of overtopping flow on dike and inside building, using numerical models - SWASH and DualSPHysics simulation
3.2.2
q-hmax and q-umax relationship
As can be seen in the last section, there were not so much difference of q-Vmax relationship for different promenade widths 0 and 20 m. However q-hmax relationship shown in Figure 4 is different: the flow depth is higher in promenade 0 m compared to promenade 20 m. For example, 1 l/s/m gives h=15 cm for the 20 m promenade case at the h=30 cm for the 20 m promenade case. From q-hmax relationship 1 l/s/m gives 2.5 m/s for the 0 m promenade case and 3.2 m/s for the 20 m promenade case. As noticed, the difference is not big. Note that hmax and umax are the maximam values obtained from the entire time series. Figure 4 – q-hmax (upper panel) and q-umax (lower panel) relationships 1.8 SWASH shallow prom0m
1.6
SWASH shallow prom20m
1.4 1.2
h [m]
1 0.8 0.6 0.4 0.2 0 10
-2
10
-1
10
0
10
1
10
2
10
10
1
10
2
10 3
3
q [l/s/m] 8 SWASH shallow prom0m SWASH shallow prom20m
7
6
u [m/s]
5
4
3
2
1
10
-2
10
-1
10 0
q [l/s/m]
8
WL2020R17_089_1
Final version
Characterization of overtopping flow on dike and inside building, using numerical models - SWASH and DualSPHysics simulation
3.2.3
Discussions
It is interesting to note that on one hand the q-Vmax gives very similar relationships between different promenade widths and on the other hand q-hmax shows a strong influence of the promenade width. In order to understand these differences, the time series of flow properties (h, u and acceleration) under an overtopping event of similar V (both case around 1000 l/s/m) is presented in Figure 5. As can be seen in the figure, it is obvious that the h of the case with promenade length 0 m give higher peak while the flow duration is significantly different. The overtopping of the case with promenade width 20 m lasts about 4 times longer than one in promenade 0 m and this is why it gives the similar V value. The overtopping flow depth of the overtopping waves are decreasing due to the gravity acting on the overtopped bore when it is propagating over the promenade. These relationships give an indication that the overtopping flow depth and flow velocity might be more relevant to describe the overtopping hazard compared to the maximum individual overtopping volume Vmax, in the case of gentle and shallow foreshore. Figure 5 – time series of h and u (cases with q~1 l/s/m)
RSK_Q_7_3_12_69_90_00: q=0.98 l/s/m, V=973 l/m, h=0.27 m, u=3.2 m/s, duration (>1 cm)=5.0 s 0.3
Overtopping flow thickness RSK-Q-7-3-12-69-90-00 q= 0.97667 l/s/m
h [m]
0.2
0.1
0 1.104
1.1045
1.105
1.1055
1.106
1.1065 10
4
Overtopping flow velocity 3
u [m/s]
2 1 0 1.104
1.1045
1.105
1.1055
1.106
t [s]
1.1065 10
4
RSK_Q_7_3_12_69_85_20: q=0.71 l/s/m, V=974 l/m, h=0.14 m, u=2.6 m/s, duration (>1 cm)=20.0 s 0.3
Overtopping flow thickness RSK-Q-7-3-12-69-85-20 q= 0.71333 l/s/m
h [m]
0.2
0.1
0 1.1045
1.105
1.1055
1.106
1.1065
1.107
1.1075 10
4
Overtopping flow velocity 3
u [m/s]
2 1 0 1.1045
1.105
1.1055
1.106
1.1065
t [s]
Final version
WL2020R17_089_1
1.107
1.1075 10
4
9
Characterization of overtopping flow on dike and inside building, using numerical models - SWASH and DualSPHysics simulation
3.3 Overtopping flow force and q 3.3.1
Physical model test
q-F relationship obtained by physical model test is shown in Figure 6. q= 1 l/s/m gives F=0.4 kN/m on an average and 2 kN for +2 sigma. However, this q is obtained under the condition of promenade 0 m while F is measured at the end of the 20 m promenade. Therefore, it is not correct to link this q directly to the F here. Here the q is expressed as q_p0m and F is F_p20m. •
q_p0m= 1 l/s/m gives F_p20m=0.4 kN/m in average and 2 kN for +2 sigma. Figure 6 – q-F relationship obtained in the CREST experiment
3.3.2
Reduction factor
In order to correct the relationship q and F above, SWASH result is used to obtain reduction factor (q for prom 0m vs q for prom 20m). Figure 7 (upper one) shows the relationship of q for prom 0m vs q for prom 20m. From this figure it can be concluded that the reduction factor of the promenade (+0.4 m higher crest level due to 2% slope) is about 5-7 times. The main reason of this reduction is not the bottom friction (n=0.019 is used) but slightly higher crest +0.4 m due to 2% slope. The reason is explained by the lower figure which shows the reduction factor when higher crest level +0.5 m. As figure shows, reduction factor is almost the same as the case above, since the crest level is almost the same. Therefore it can be concluded that the main reason of the reduction of q for 20 m promenade is due to the higher crest level. To conclude, physical model result is translated (=looking into the F_p20m value at q_p0m=5-7 l/s/m instead of q_p0m = 1 l/s/m to obtain relationship q_p20m – F_p20m) as follows. •
10
q_p20m= 1 l/s/m (i.e. q_p0m=7 l/s/m) gives F_p20m=2 kN/m in average and 10 kN for 2 sigma.
WL2020R17_089_1
Final version
Characterization of overtopping flow on dike and inside building, using numerical models - SWASH and DualSPHysics simulation Figure 7 – Reduction factor of the promenade (upper: reduction due to the promenade, lower: reduction due to higher crest level) 20 18
[-]
16
Factor q
prom 0m
/q
prom 20m
14 12 10 8 6 4 2 0 10
-2
10
-1
10
q
0
10
prom 20m
1
10
2
10
1
10
2
10 3
3
[l/s/m]
20 18
Factor q/q
crest+50cm
[-]
16 14 12 10 8 6 4 2 0 10
-2
10
-1
10 0
10
q [l/s/m]
Final version
WL2020R17_089_1
11
Characterization of overtopping flow on dike and inside building, using numerical models - SWASH and DualSPHysics simulation
3.3.3
q-F relationship from SWASH
The hydrodynamics decides the forcing on the structure (Chen et al., 2015). In this study, the façade is assumed to be broken. However, if the façade is strong enough the safety of the people inside the building is maintained. According to Streicher (2019), the force acting on a vertical wall on the promenade can be quasi-hydrostatic in gentle and shallow foreshore case. Therefore, the force in such case can be estimated roughly if hmax is known. One of the effective evacuation strategies is the vertical evacuation, however in order to make sure this evacuation method is safe, first the criteria of force to the building needs to be known. Therefore, an estimation of force acting on a building is necessary. The force estimation using SWASH is shown in Figure 8. From this figure (red points) it can be concluded that •
q_p20m= 1 l/s/m gives F_p20m=2 kN/m.
This result (average F) corresponds to the physical model shown in Figure 6, while scatter (sigma value) is different. Scatter is a function of test matrix, so it is natural that the value is not the same (i.e. test matrix is different). In case the wall is located at the dike crest •
q_p0m= 1 l/s/m gives F_p20m=5 kN/m. Figure 8 – Force estimation using SWASH for different promenade width 10 3 SWASH shallow prom0m
10
2
10
1
10
0
Level [m TAW]
F [kN/m]
SWASH shallow prom20m
10
5 930
940
950
960
970
980
970
980
10
-1
10
-1
10 0
10
1
Level [m TAW]
x [m] 10
5 930
940
950
10
2
960
x [m]
10 3
q [l/s/m]
3.3.4
Strength of windows
One of the most vulnerable part of the buildings are the windows. According to (Chen et al., 2017), the strength of the window is a function of its configuration. As an example consider a configuration of 2 x 2 m. The strength for this configuration can be estimated as 4 kN/m on average. Considering the order of magnitude of loadings and strengths are similar, it is well possible for a window to be broken by overtopping waves. Next section is a calculation using SWASH under an assumption that the windows are broken (or no window).
12
WL2020R17_089_1
Final version
Characterization of overtopping flow on dike and inside building, using numerical models - SWASH and DualSPHysics simulation
3.4 Overtopping flow properties inside buildings 3.4.1
Stability of human
Stability is one of the key factors for the safety of the people. Endoh & Takahashi, (1995) discussed the human stability taking into account different human instability modes, slipping and tumbling. Sandoval and Bruce, (2017) revisited the same taking into account the buoyancy and its position and shows different criteria by ages and genders. The bathymetry is extended 5 m horizontally (no slope) and this is assumed as a room. See bathymetry with ‘_R’ annotation in Figure 9. Velocity measurement will be at the entrance, middle, in front of the wall in the 5 m room. The lines shown in Figure 10 to Figure 13 are criteria for 2.5 year old children, an average adult and a tall adult. The criteria are expressed as the combination of u and h. However, in general umax and hmax does not occur at the exact same moment (there is a time-lag) as can be seen in the figures. If one wants to check stability properly, then one needs to use a model which can describe the combination of u and h in a time series. Since it is based on 1000 waves, the line goes the same trajectory many times. In case the stability is evaluated by standalone hmax in combination with standalone umax, then the hazard is somewhat overestimated. From all the calculation we selected 4 cases for the detailed investigation of flow inside buildings below. • • • •
RSK_R_7_3_12_69_90_00 (prom 0 m, q~1 l/s/m) RSK_R_7_3_12_69_85_20 (prom 20 m, q~1 l/s/m) RSK_R_7_5_12_69_90_00 (prom 0 m, q~10 l/s/m) RSK_R_7_5_12_69_85_00 (prom 20 m, q~10 l/s/m)
Figure 10 Figure 11 Figure 12 Figure 13
Bottom of each figure shows u-h line calculated in SWASH. As you can see, flow depth becomes high when it is closer to the wall. When it reached to the highest water level, the velocity becomes around zero, and then the reflected waves go back to the sea as if it is a dam break test. It is obvious that the overtopping of less than 1 l/s/m, the risk seems to be limited to vulnerable people in the case listed here. However, the q becomes more than 10 l/s/m, the lines are exceeding all the stability curves for all types of humans.
Level [m TAW]
Figure 9 – Configuration of R bathymetry. Promenade width 0 m (upper) and 20 m (lower)
10
5 930
5m 940
950
960
970
980
Level [m TAW]
x [m] 10
5m 5 930
940
950
960
970
980
x [m]
Final version
WL2020R17_089_1
13
Characterization of overtopping flow on dike and inside building, using numerical models - SWASH and DualSPHysics simulation Figure 10 – RSK_R_7_3_12_69_90_00 (prom 0 m, q~1 l/s/m) Overtopping flow thickness RSK-R-7-3-12-69-90-00 average q= 0.98 l/s/m
h [m]
0.5
0
0
2000
4000
8000
10000
12000
8000
10000
12000
Overtopping flow velocity
4
u [m/s]
6000
2 0 0
2000
4000
6000
t [s]
1 Stab.Cr. 2.5 year Stab.Cr. avg adult Stab.Cr. tall adult
0.8
at entrance
layer flow thickness [m]
middle at wall
0.6
0.4
0.2
0 0
0.5
1
1.5
2
2.5
3
3.5
4
4.5
5
layer flow velocity [m/s]
14
WL2020R17_089_1
Final version
Characterization of overtopping flow on dike and inside building, using numerical models - SWASH and DualSPHysics simulation Figure 11 – RSK_R_7_3_12_69_85_20 (prom 20 m, q~1 l/s/m) Overtopping flow thickness RSK-R-7-3-12-69-85-20 average q= 0.71 l/s/m
h [m]
0.4 0.2 0
0
2000
4000
6000
8000
10000
12000
8000
10000
12000
Overtopping flow velocity
u [m/s]
2 1 0 0
2000
4000
6000
t [s]
1 Stab.Cr. 2.5 year Stab.Cr. avg adult Stab.Cr. tall adult
0.8
at entrance
layer flow thickness [m]
middle at wall
0.6
0.4
0.2
0 0
0.5
1
1.5
2
2.5
3
3.5
4
4.5
5
layer flow velocity [m/s]
Final version
WL2020R17_089_1
15
Characterization of overtopping flow on dike and inside building, using numerical models - SWASH and DualSPHysics simulation Figure 12 – RSK_R_7_5_12_69_90_00 (prom 0 m, q~10 l/s/m)
16
WL2020R17_089_1
Final version
Characterization of overtopping flow on dike and inside building, using numerical models - SWASH and DualSPHysics simulation Figure 13 – RSK_Q_7_5_12_69_85_00 (prom 20 m, q~10 l/s/m)
3.4.2
Discussion and conclusion
Needless to say, that q and Vmax are still very important parameters to get the first idea to estimate how severe will be the overtopping event. However, time dependent value u and h are more relevant to understand the risk on the dike in details as shown in this study. These parameters have a direct link to the stability of a human. Oppenheimer et al. (2019) identified 6 scenarios of layouts for the sea level rise (SLR). Some of them indicated to have structures in front of the properties to defend from the SLR. From the present study, it became clear that the time dependent h and u needs to be evaluated on top of average overtopping discharge and Vmax, in order to understand the risk in detail. Apparently, the influence of the promenade is positive in the sense that it reduces not only q but also h, as also indicated in Altomare et al. (2020a). Eventually the forcing on pedestrians, vehicles and structures will be reduced due to the effect of the promenade. The effect can be strengthened if extra obstacles are placed on top of the promenade, for instance sea walls (Veale et al., 2012) and vegetation. The key will be how to reduce q and Vmax and also make overtopping event duration longer, so that h-u line stays in a small range. Note that the result shown here is something to do with the failing criteria: it is not directly linked with the number of causalities. In this aspect, further research will be necessary to quantify it.
Final version
WL2020R17_089_1
17
Characterization of overtopping flow on dike and inside building, using numerical models - SWASH and DualSPHysics simulation
4 Overtopping flow characterization inside building using DualSPHysics+SWASH 4.1 Overtopping risk inside an apartment Wave overtopping is one of the greatest concerns in coastal communities for safety. However, detailed postovertopping processes on the dike/promenade located in mild and shallow foreshore are not fully understood due to the fact that the present safety criteria are typically based on the time-averaged information (i.e. q, average overtopping discharge over a certain duration such as 1000 waves). One of the main concerns is the behavior of the maximum overtopping wave (i.e. the biggest wave out of 1000 waves), which will give very hig velocities and large flow depths which will increase the risk to people on the promenade or even inside an apartment facing to the sea. It is assumed that no one is on the promenade/dike during an extreme storm, but it cannot be excluded completely. Moreover, the overtopping waves even can destroy the window of the apartment and thus propagate into the room. The behavior of waves inside an apartment is much more complicated taking account there are many objects inside the room (eg furniture) which also causes an extra risk. In this visualization, we try to understand what can be extra risk components in such a situation. In this study, we limited the visualization one case, namely the case with q~10 l/s/m at the safety line.
18
WL2020R17_089_1
Final version
Characterization of overtopping flow on dike and inside building, using numerical models - SWASH and DualSPHysics simulation
4.2 Modified coupling method The overtopping flow is visualized by means of the coupling model, DualSPHysics and SWASH. However as stated earlier, the standard coupling methods will not be optimum in terms of the computational effort since the target wave in this visualization is only one wave. Therefore we developed a simple but efficient method for this visualization. In order to simulate the wave propagation in DualSPHysics, many efficient models have been developed in the last years by coupling with lighter wave propagation models (Altomare et al., 2015; 2018; Verbrugghe et al, 2018). However, none of the models is fully applicable to simulate wave overtopping in mild and shallow foreshore when the coupling point comes to very/extremely shallow water. The limitation of those models are related to 1) non-linearity, and 2) volume of the water mass in the DualSPHysics domain. In this work, an efficient coupling method is developed to be able to simulate the post-overtopping processes of the maximum wave on the promenade in mild and shallow foreshore based on the ML-Piston technique (Altomare et al., 2015) and calibration. Calibration by changing the piston movement is conducted in order to match the time series of overtopping velocity and flow depth between SWASH and DualSPHysics output under a condition without a wall at the end of the room. First SWASH run is conducted for the entire time series of a storm (i.e. 1000 waves) for a case of q~10 l/s/m (actual selection is the case of Q_7_5_12_69_85_20 and q is 13 l/s/m). Then a time window of the maximum wave overtopping is selected (~30 s) and output of u and h are extracted at the end of the room (without the wall at the end, which gives idealized incident wave time series at the ‘safety line’). This time series is a benchmark of the calibration. Then the piston movement in DualSPHysics is calibrated until the signal of u and h in the model becomes close to the output of u and h in SWASH. Note that the DualSPHysics calculation is conducted in 2DV mode so that the computationally not too expensive (the computational time of one run is within 1 hour). The result of the calibration is shown in Figure 14. As indicated in the figure, the flow thickness and velocity of the maximum overtopping event are reproduced effectively: the first 4-5 seconds is most important for the post-overtopping processes since the discharge in the time window is the largest. Note that the differences in the latter part of the flow thickness can be further optimized if one continues the calibration. However, the purpose of the visualization is to see the impression of the overtopping and thus it does not need to be perfectly correct in this stage. Based on this calibration, finally, DualSPHysics 3D simulation with the calibrated piston movement is conducted together with some furniture and visualized it using Blender, see Figure 15 (explanation of each snapshot is shown here below). Note that the eyepoint of the 3D image is at 1.6 m assuming a person of 1.70-1.75 m high. a) b) c) d) e) f) g) h)
Before overtopping Overtopping over the dike Bore propagating on the promenade Bore is interacting with furniture Furniture hit to the wall at the end of the room Furniture is pushed to the ceiling Reflected wave bring the furniture to offshore Water level inside the room is decreasing
Final version
WL2020R17_089_1
19
Characterization of overtopping flow on dike and inside building, using numerical models - SWASH and DualSPHysics simulation
As can be seen in the figure, the biggest overtopping event of 13 l/s/m case (maximum overtopping volume V~10000 l/s/m) is quite energetic: the bore can move the furniture and these hit to the wall behind. Even though the flow depth without a vertical wall is around 0.3 – 0.4 m but combined with the bore propagation and reflection the highest water level goes up to the ceiling 2.4 m high at ‘one point’. ‘one point’ means that the splash induced by reflection and furniture gives a high peaky tip. Note that the cross-sectional view at the bottom figure is representing the highest water level in the whole width in practice (whole domain in ydirection since it is like a side view of wave flume with a certain width), and therefore the water level is not that high for entire y-direction. The fact that the water level in y-direction is not uniform (=not like longcrested wave but like a short crested wave) is due to 3D effect induced by the furniture (if there is no furniture then the wave is less disturbed). This happens due to the accumulation of water mass due to the bore propagation (it is not ‘wave’ anymore since the still water level is below the promenade). However, the SWASH simulation in the previous chapter indicated that the highest water level is around 1.2 m with wall configuration. Looking at the details of the calibration result the flow depth after 5 seconds after the bore reached to the ‘safety line’ is even underestimated. However, the interaction with furniture might have contributed to lead higher water levels in DualSPHysics. Under this condition, furniture is pushed up and hit to the ceiling. It is now clear that the furniture can cause a big risk under such a situation – if people are inside the room the furniture not only hits people but also squash people between the furniture and wall. Note that further validation will be necessary if this calibration method represents the reality. Also, it is interesting to visualize different overtopping events such as 1 l/s/m. Figure 14 – Calibration of wave boundary condition at the coupling point between DualSPHysics and SWASH Overtopping flow thickness
h [m]
0.5
0 7000
7005
7010
7015
7020
7025
7030
7035
7040
7045
7050
7035
7040
7045
7050
Overtopping flow velocity
8
u [m/s]
6 4 2 0 7000
7005
7010
7015
7020
7025
7030
t [s]
1
20
WL2020R17_089_1
Final version
Characterization of overtopping flow on dike and inside building, using numerical models - SWASH and DualSPHysics simulation Figure 15 – Visualization of DualSPHysics calculations
a
e
b
f
c
g
d
h
Final version
WL2020R17_089_1
21
Characterization of overtopping flow on dike and inside building, using numerical models - SWASH and DualSPHysics simulation
5 Conclusions In this study, SWASH and DualSPHysics models are used to understand the overtopping risk. In the first part overtopping risk on a dike in gentle and shallow foreshores is investigated using SWASH, a NLSW equation solver. The model has been validated in different studies applied for shallow foreshores (Suzuki et al. 2017 and Suzuki et al., 2018). One of the benefits to use SWASH in this study is that the model can output h and u in time series while measurement of u on a dike in the physical model test is often a challenge. Using SWASH the risk on the dike can be evaluated in detail, in the function of time. On top, SWASH is relatively a light wave model, and thus it is possible to obtain overtopping flows in different wave conditions and bathymetries. It is often the case in practice that the coastal safety is evaluated by the average overtopping discharge and maximum individual volume Vmax. However, it becomes clear from this study that overtopping risk is not only characterized by q and Vmax: time-dependent h and u are also useful and even better parameters to characterize risks on dikes more in detail. For instance, two cases in the example of this study show different h, even though the two cases show very similar Vmax. This was due to the influence of the promenade which made h smaller and the duration longer. It is noted that the combination of stand-alone hmax and umax can lead to an overestimation of the hazard and therefore time-dependent h and u are better for the proper assessment. The investigation indicated that a high overtopping discharge can make any age of human unstable (=fall down). Furthermore windows can be destroyed by overtopping waves which results in flooding of the buildings. In the second part in order to understand the risk of overtopping, a new coupling method is established. By means of the state-of-the-art visualization technique, DualSPHysics simulation results are visualized. Thanks to the visualization the process of overtopping bore is revealed and we can understand what can be happened during the inundation in the case of severe overtopping. The DualSPHysics 3D simulation reveals that there is a risk when the wave motion combines with furniture. Further study on the characterization of overtopping waves will be useful since a proper assessment of wave overtopping is an essential key for designing coastal structures which provides safety for people in coastal area. Numerical modelling is a strong tool to evaluate risks in different scenarios. Note that a part of the present work of SWASH modelling has been further investigated and analysed (incl. some setting changes), and eventually published in JMSE, see Suzuki et al. (2020).
22
WL2020R17_089_1
Final version
Characterization of overtopping flow on dike and inside building, using numerical models - SWASH and DualSPHysics simulation
6 References Allsop, N.W.H.; Bruce, T.; Pullen, T.; van der Meer, J. (2008). Direct Hazards From Wave Overtopping – the Forgotten Aspect of Coastal Flood Risk Assessment ? 43rd DEFRA Flood Coast. Manag. Conf. (July): 1–11 Altomare, C.; Domínguez, J.M.; Crespo, a J.C.; Suzuki, T.; Caceres, I.; Gómez-Gesteira, M. (2015). Hybridization of the Wave Propagation Model SWASH and the Meshfree Particle Method SPH for Real Coastal Applications. Coast. Eng. J. 57(4): 1550024. doi:doi:10.1142/S0578563415500242 Altomare, C.; Dominguez, J.M.; Crespo, A.J.C.; González-Cao, J.; Suzuki, T.; Gómez-Gesteira, M.; Troch, P. (2017). Long-crested wave generation and absorption for SPH-based DualSPHysics model. Coast. Eng. An Int. J. Coastal, Harb. Offshore Eng. 127: 37–54. Available at: https://hdl.handle.net/10.1016/j.coastaleng.2017.06.004 Altomare, C.; Tagliafierro, B.; Dominguez, J.M.; Suzuki, T.; Viccione, G. (2018). Improved relaxation zone method in SPH-based model for coastal engineering applications. Appl. Ocean Res. 81: 15–33. Available at: https://hdl.handle.net/10.1016/j.apor.2018.09.013 Chen, X; Jonkman, S.N.; Pasterkamp, S.; Suzuki, T.; Altomare, C. (2017). Vulnerability of buildings on coastal dikes due to wave overtopping. Water 9(6): 394–419. Available at: https://hdl.handle.net/10.3390/w9060394 Chen, Xuexue; Hofland, B.; Altomare, C.; Suzuki, T.; Uijttewaal, W. (2015). Forces on a vertical wall on a dike crest due to overtopping flow. Coast. Eng. ISBN 978-0-9896611-2-6 95: 94–104. doi:10.1016/j.coastaleng.2014.10.002 Crespo, A.J.C.; Domínguez, J.M.; Rogers, B.D.; Gómez-Gesteira, M.; Longshaw, S.; Canelas, R.; Vacondio, R.; Barreiro, A.; García-Feal, O. (2015). DualSPHysics: Open-source parallel CFD solver based on Smoothed Particle Hydrodynamics (SPH). Comput. Phys. Commun. 187: 204–216. doi:10.1016/j.cpc.2014.10.004 Endoh, K.; Takahashi, S. (1995). Numerically Modeling Personnel Danger on a Promenade Breakwater Due to Overtopping Waves, in: (1995). 24th International Conference on Coastal Engineering, October 23-28, 1994, Kobe, Japan. pp.1016–1029 Goda, Y. (2010). Random Seas and Design of Maritime Structures. 3rd ed. Advanced Series on Ocean Engineering, 33 (P. L.-F. Liu, Ed.). World Scientific. ISBN 978-981-4282-39-0. doi:10.1142/7425 Hofland, B.; Chen, X.; Altomare, C.; Oosterlo, P. (2017). Prediction formula for the spectral wave period T m1 , 0 on mildly sloping shallow foreshores 123(February): 21–28. doi:10.1016/j.coastaleng.2017.02.005 Rijnsdorp, D.P.; Smit, P.B.; Zijlema, M. (2014). Non-hydrostatic modelling of infragravity waves under laboratory conditions. Coast. Eng. 85: 30–42. doi:10.1016/j.coastaleng.2013.11.011 Romano, A.; Bellotti, G.; Briganti, R.; Franco, L. (2015). Uncertainties in the physical modelling of the wave overtopping over a rubble mound breakwater : The role of the seeding number and of the test duration. Coast. Eng. 103: 15–21. doi:10.1016/j.coastaleng.2015.05.005 Sandoval, C.; Bruce, T. (2017). Wave overtopping hazard to pedestrians: video evidence from real accidents, in: (2017). Coasts, Marine Structures and Breakwaters 2017. ISBN 9780727763174. pp.501–512. Available at: http://www.ice-conferences.com/coasts,-marine-structures-and-breakwaters-2017/
Final version
WL2020R17_089_1
23
Characterization of overtopping flow on dike and inside building, using numerical models - SWASH and DualSPHysics simulation
Suzuki, T.; Altomare, C.; Veale, W.; Verwaest, T.; Trouw, K.; Troch, P.; Zijlema, M. (2017). Efficient and robust wave overtopping estimation for impermeable coastal structures in shallow foreshores using SWASH. Coast. Eng. 122. doi:10.1016/j.coastaleng.2017.01.009 Suzuki, T; Altomare, C.; De Roo, S.; Vanneste, D.; Mostaert, F. (2018). Manning’s roughness coefficient in SWASH: application to overtopping calculation. Version 2.. FHR reports, 17_026_1. Flanders Hydraulics Research: Antwerp Suzuki, T; De Roo, S.; Altomare, C.; Zhao, G.; Kolokythas, G.K.; Willems, M.; Verwaest, T.; Mostaert, F. (2016). Toetsing kustveiligheid 2015 - Methodologie: toetsingsmethodologie voor dijken en duinen. 10.0. WL Rapporten, 14_014. Waterbouwkundig Laboratorium: Antwerpen Suzuki, T.; Altomare, C.; Yasuda, T.; Verwaest, T. (2020). Characterization of Overtopping Waves on Sea Dikes with Gentle and Shallow Foreshores. J. Mar. Sci. Eng. 8(10): 752. doi:10.3390/jmse8100752 Verbrugghe, T.; Domínguez, J.M.; Crespo, A.J.C.; Altomare, C.; Stratigaki, V.; Troch, P.; Kortenhaus, A. (2018). Coupling methodology for smoothed particle hydrodynamics modelling of non-linear wave-structure interactions. Coast. Eng. 138: 184–198. doi:10.1016/j.coastaleng.2018.04.021 Zijlema, M.; Stelling, G.; Smit, P. (2011). SWASH: An operational public domain code for simulating wave fields and rapidly varied flows in coastal waters. Coast. Eng. 58(10): 992–1012
24
WL2020R17_089_1
Final version
DEPARTMENT MOBILITY & PUBLIC WORKS Flanders hydraulics Research Berchemlei 115, 2140 Antwerp T +32 (0)3 224 60 35 F +32 (0)3 224 60 36 waterbouwkundiglabo@vlaanderen.be www.flandershydraulicsresearch.be