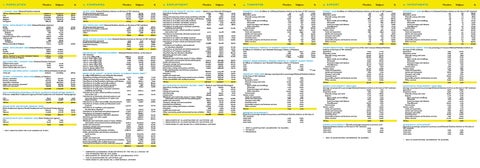
1 . P O P U L AT I O N
Flanders
Belgium
%
6,016,024 2,966,640 3,049,384 5.727.649 288.375
10,396,421 5,087,176 5,309,245 9.536.134 860.287
57.9% 58.3% 57.4% 60.1%
112,149 107,039 +5,110 +3,449 +1,661 +27,790 +32,900 -3,640 +36,540 33,709
53.5% 55.0%
1 JA N UA RY 2 0 0 4 (National Statistics Institute) TOTA L P O P U L AT I O N
Men Women Belgians Foreigners
P O P U L . D E V E LO P M E N T I N 2 0 0 3 (National Statistics Institute)
Births Deaths Natural growth Belgians Foreigners Migration balance (after corrections) Total growth Belgians Foreigners Balance naturalized Belgians
59,964 58,910 +1,054 -268 +1,322 +15,778 +16,832 +455 +16,377 12,324
TOTA L G R OW T H ( A F T E R C O R R E C T I O N S )
Balance naturalized Belgians
9.98‰ 9.81‰ +0.18‰ +2.80‰ 2.05‰ 22.3% 60.1% 17.6% 3,616,913
36.6%
TOTA L
238,143 431,209 435,781 103,257 65,648 1.274.038
78,712 96,006 174,718
23.2% 59.7% 17.1% 6,207,845
58.3%
401,970 761,484 800,504 182,655 128,293 2.274.906
59.2% 56.6% 54.4% 56.5% 51.2% 56.0%
212,415 239,891 452,306
37.1% 40.0% 38.6%
U N E M P LOY E D J O B - S E E K E R S F E B R UA RY 2 0 0 5
(State Employment Agency; Flemish Employment and Vocational Traning Agency) Men 106,249 277,103 Women 124,105 312,276 TOTA L 230,354 589,379 U N E M P LOYM E N T R AT E F E B R UA RY 2 0 0 5 (State Employment Agency)
Men Women TOTA L
7.2% 10.4% 8.7%
* O N LY R E G I S T R AT I O N S F O R M A I N C O U R S E S O F S T U DY.
11.5% 15.4% 13.3%
NV (Incorporated company) BVBA (Limited liability company) Individual company Other
1,611 8,870 15,071 2,601 28,153
2,735 14,783 25,928 4,587 48,033
58.9% 60.0% 58.1% 56.7% 58.6%
NV (Incorporated company) BVBA (Limited liability company) Individual company Other
1,739 3,878 18,931 2,003 26,551
3,271 6,709 32,743 3,953 46,676
53.2% 57.8% 57.8% 50.7% 56.9%
B U S I N E S S E S BY T U R N OV E R C AT E G O RY * (National Statistics Institute on the basis of
(February 2005) (State Employment Agency; Flemish Employment and Vocational Training Agency)
TOTA L
62.1% 62.9% 60.8% 50.3% 60.7%
VAT statistics) 0 to <0.25 million EUR 0.25 to <0.50 million EUR 0.50 to <1.00 million EUR 1.00 to <2.00 million EUR 2.00 to <5.00 million EUR 5.00 to <10.00 million EUR 10.00 to <50.00 million EUR 50.00 million EUR and more
FULLY UNEMPLOYED INDIVIDUALS ENTITLED TO RECEIVE UNEMPLOYMENT BENEFITS
Men Women
AC T I V E 2 0 0 3 (National Statistics Institute on the basis of VAT statistics) NV (Incorporated company) 51,357 82,732 BVBA (Limited liability company) 112,404 178,638 Individual company 224,919 369,781 Other 28,465 56,611 TOTA L 417,145 687,762
TOTA L
10.81‰ 10.32‰ +0.49‰ +3.17‰ 3.25‰
S C H O O L AT T E N DA N C E 2 0 0 2 -2 0 0 3 (Ministry of Flanders)
Nursery education Primary education Secondary education Higher non-university education* University education*
%
C O M P. H AV I N G C E A S E D I N 2 0 0 3 (National Statistics Institute on the basis of VAT statistics)
WO R K I N G AG E P O P U L AT I O N 1 JA N UA RY 2 0 0 4 (National Statistics Institute)
20-64 jaar
Belgium
TOTA L
AG E S T R U C T U R E 1 JA N UA RY 2 0 0 4 (National Statistics Institute)
Children (0-19 years) Working age (20-64 years) Senior citizens (65 years and +)
Flanders
N E W C O M PA N I E S 2 0 0 3 (National Statistics Institute on the basis of VAT statistics)
P O P U L . D E V E LO P M E N T 2 0 0 3 (National Statistics Institute)
Births Deaths Natural growth
2 . C O M PA N I E S
38.3% 39.7% 39.1%
258,524 32,551 21,155 13,471 10,083 4,261 4,055 1,119
431,396 50,290 32,554 20,796 15,281 6,401 5,985 1,807
59.9% 64.7% 65.0% 64.8% 66.0% 66.6% 67.8% 61.9%
G R O S S VA L U E A D D E D * * AT B A S I C P R I C E S , AT C U R R E N T P R I C E S 2 0 0 3 * * *
(in million EUR) (Instituut voor Nationale Rekeningen) Agriculture, hunting and forestry; fishing 2,377.1 Mining and quarrying except energy producing materials 98.4 Manufacture of food products, beverages and tobacco 4,371.1 Manufacture of textiles and textile products 1,708.8 Manufacture of leather and leather products 75.3 Manufacture of wood and wood products 520.0 Manufacture of pulp, paper, and paper products; publishing and printing 2,121.7 Manufacture of coke, refined petroleum products and nuclear fuel 974.1 Manufacture of chemicals, chemical products and man-made fibres; manufacture of rubber and plastic products 7,668.6 Manufacture of other non-metallic mineral products 1,107.2 Manufacture of basic metals and fabricated metal products 4,323.0 Manufacture of machinery and equipment not elsewhere classified 1,724.3 Manufacture of electrical and optical equipment 2,256.7 Manufacture of transport equipment 3,004.9 78,9%Manufacturing not elsewhere classified 1,101.7 Electricity, gas and water supply 3,170.9 Construction 7,910.9 Wholesale and retail trade; repair of motor vehicles, motorcycles and personal and household goods 19,197.4 Hotels and restaurants 2,413.7 Transport, storage and communication 9,128.2 Financial intermediation 4,714.7 Real estate, renting and business activities 32,832.0 Public administration and defence; compulsory social security 8,210.6 Education 8,948.7 Health and social work 10,201.0 Other community, social and personal service activities 2,573.3 Private households with employed persons 513.0 Financial intermediation services indirectly measured -5,154.4 TOTA L 138,092.9
3,328.6 307.7 6,105.2 1,999.3 88.9 695.0
71.4% 32.0% 71.6% 85.5% 84.7% 74.8%
3,364.4
63.1%
1,330.3
73.2%
10,508.3 2,366.7
73.0% 46.8%
6,154.6
70.2%
2,707.3 3,072.7 3,808.2 1,353.8 5,801.0 11,990.4
63.7% 73.4% 81.4% 54.7% 66.0%
30,403.5 4,067.0 17,327.9 14,534.6 56,902.3
63.1% 59.3% 52.7% 32.4% 57.7%
20,490.5 16,604.5 17,759.8 5,498.6 1,372.1 -8,993.4 240,949.8
40.1% 53.9% 57.4% 46.8% 37.4% 57.3% 57.3%
T U R N OV E R C AT E G O R I E S W E R E R E V I E W E D BY T H E N I S A S A R E S U LT O F THE INTRODUCTION OF THE EURO * * B R E A K D OW N BY I N D U S T RY S E C TO R I N AC C O R DA N C E W I T H T H E C L A S S I F I C AT I O N O F AC T I V I T I E S A 3 1 * * * 2 0 0 3 R E S U LT S A R E B A S E D O N A P R OV I S I O N A L M E T H O D *
3 . E M P L OY M E N T
Flanders
Belgium
%
4 . T U R N OV E R
Flanders
Belgium
%
5. EXPORT
Flanders
Belgium
%
E M P LOY E E S BY I N D U S T RY S E C TO R * 2 0 0 3 * * * (Instituut voor Nationale Rekeningen)
T U R N OV E R * 2 0 0 3 (in billions of ¤) (National Statistics Institute on the basis of VAT statistics)
E X P O R T * 2 0 0 3 (in billions of ¤) (National Statistics Institute on the basis of VAT statistics)
Agriculture, hunting and forestry 22,066 Fishing 487 Mining and quarrying except energy producing materials 638 Manufacture of food products, beverages and tobacco 60,595 Manufacture of textiles and textile products 37,061 Manufacture of leather and leather products 1,489 Manufacture of wood and wood products 8,534 Manufacture of pulp, paper, and paper products; publishing and printing 28,615 Manufacture of coke, refined petroleum products and nuclear fuel 4,224 Manufacture of chemicals, chemical products and man-made fibres 47,409 Manufacture of rubber and plastic products 19,505 Manufacture of other non-metallic mineral products 16,713 Manufacture of basic metals and fabricated metal products 63,588 Manufacture of machinery and equipment not elsewhere classified 24,673 Manufacture of electrical and optical equipment 31,818 Manufacture of transport equipment 44,500 Manufacturing not elsewhere classified 21,878 Electricity, gas and water supply 11,732 Construction 115,145 Wholesale and retail trade; repair of motor vehicles, motorcycles and personal and household goods 274,942 Hotels and restaurants 58,006 Transport, storage and communication 142,659 Financial intermediation 44,300 Real estate, renting and business activities 213,841 Public administration and defence; compulsory social security 180,100 Education 191,470 Health and social work 209,987 Other community, social and personal service activities 49,068 Private households with employed persons 37,494 TOTA L 1,962,537
Agriculture Secondary sector Minerals, energy and water Industry Basic metals and metallurgy Chemicals Food, beverages and tobacco Other industries Construction Tertiary sector Trade and reparation Hotels and restaurants Transport and traffic Financial sector Immovable property and business services Other services
Agriculture Secondary sector Minerals, energy and water Industry Basic metals and metallurgy Chemicals Food, beverages and tobacco Miscellaneous Construction Tertiary sector Trade and reparation Hotels and restaurants Transport and traffic Financial sector Immovable property and business services Other services
27,699 534 3,064 86,192 42,546 1,795 12,534
79.7% 91.2% 20.8% 70.3% 87.1% 83.0% 68.1%
44,536
64.3%
5,428
77.8%
70,035 25,225 31,224
67.7% 77.3% 53.5%
96,498
65.9%
39,531 45,619 57,179 25,621 24,927 185,663
62.4% 69.7% 77.8% 85.4% 47.1% 62.0%
459,355 100,058 253,750 128,284 358,338
59.9% 58.0% 56.2% 34.5% 59.7%
424,328 355,539 365,985 105,046 85,066 3,461,599
42.4% 53.9% 57.4% 46.7% 44.1% 56.7%
SELF-EMPLOYED BY INDUSTRY SECTOR** 2003*** (Instituut voor Nationale Rekeningen)
Agriculture, hunting and forestry Fishing Mining and quarrying Manufacturing Construction Wholesale and retail trade; repair of motor vehicles, motorcycles and personal and household goods Hotels and restaurants Transport, storage and communication Financial intermediation Real estate, renting and business activities Education Health and social work Other community, social and personal service activities TOTA L
45,149 76 16 15,918 28,035
69,070 210 70 26,047 45,670
65.4% 36.2% 22.9% 61.1% 61.4%
86,949 28,701 8,833 7,509 137,091 1,618 27,256 28,137 415,288
142,899 45,275 14,710 11,489 222,961 2,556 49,941 45,930 676,828
60.8% 63.4% 60.0% 65.4% 61.5% 63.3% 54.6% 61.3% 61.4%
* B R E A K D OW N BY C L A S S I F I C AT I O N O F AC T I V I T I E S A 3 1 * * B R E A K D OW N BY C L A S S I F I C AT I O N O F AC T I V I T I E S A 1 7 * * * 2 0 0 3 R E S U LT S A R E B A S E D O N A P R OV I S I O N A L M E T H O D
6,1 266,5 36,6 198,3 65,6 36,7 32,1 63,9 31,6 506,2 335,7 8,5 61,9 9,2 79,6 11,3 778,8
73.6% 64.0% 37.7% 68.6% 69.1% 67.5% 75.9% 51.1% 66.0% 63.4% 7.5% 59.3% 68.2% 28.4% 48.1% 53.1% 63.7%
(in billions of ¤) (Instituut voor Nationale Rekeningen, Ministry of Flanders) 2001 145,1 254,2 2002 148,9 261,1 2003 **153,6 269,5 2004 ***160,1 ***280,6
57.1% 57.0% 57.0% 57.1%
TOTA L
4,5 170,6 13,8 136,0 45,3 24,8 24,4 32,6 20,9 320,8 226,6 5,1 42,2 2,6 38,3 6,0 495,9
N O M I N A L G R O S S R E G I O N A L P R O D U C T G R OW T H AT C U R R E N T M A R K E T P R I C E S
(in billions of ¤) (Instituut voor Nationale Rekeningen, Ministry of Flanders) 2001 1.0% 0.7% 2002 0.7% 0.9% 2003 **1.3% 1.3% 2004 ***2.6%
***2.4%
T U R N OV E R * 2 0 0 2 -2 0 0 3 (Average annual growth in percentage) (National Statistics Institute
TOTA L
0.2% 2.2% -14.9% 4.3% 1.2% -2.7% 1.9% -10.0% 2.6% 4.9% 4.2% 3.8% 6.4% -9.0% 9.2% 5.3% 3.9%
4.8% 2.5% -6.5% 4.1% 1.0% 0.0% 2.1% 11.3% 4.0% 4.4% 2.5% 4.0% 6.4% 6.7% 11.0% 5.0% 3.7%
T U R N OV E R : D E V E LO P M E N T *
(Growth in percentage compared to previous year) (National Statistics Institute on the basis of VAT statistics) 2000-2001 4.3% 6.0% 2001-2002 4.3% 3.8% 2002-2003 3.9% 3.7% * N E W C L A S S I F I C AT I O N AC C O R D I N G TO N AC E B E L * * E S T I M AT E *** PROGNOSIS
0,7 145,0 13,1 129,7 46,9 28,9 14,3 39,6 2,2 251,1 165,5 0,3 39,3 3,6 40,9 1,5 396,8
71.6% 65.9% 42.5% 68.2% 68.9% 68.2% 79.8% 47.4% 72.1% 66.9% 71.9% 48.1% 80.3% 22.0% 39.5% 36.1% 66.6%
E X P O R T- O R I E N TAT I O N * 2 0 0 3 (export in % of the 2002 turnover) (National Statistics
G R O S S R E G I O N A L P R O D U C T AT C U R R E N T M A R K E T P R I C E S
on the basis of VAT statistics) Agriculture Secondary sector Minerals, energy and water Industry Basic metals and metallurgy Chemicals Food, beverages and tobacco Other industries Construction Tertiary sector Trade and reparation Hotels and restaurants Transport and traffic Financial sector Immovable property and business services Other services
TOTA L
0,5 95,5 5,6 88,4 32,3 19,7 11,4 18,7 1,6 168,1 118,9 0,1 31,5 0,8 16,1 0,6 264,1
Institute on the basis of VAT statistics) Agriculture Secondary sector Minerals, energy and water industry Basic metals and metallurgy Chemicals Food, beverages and tobacco Miscellaneous Construction Tertiary sector Trade and reparation Hotels and restaurants Transport and traffic Financial sector Immovable property and business services Other services TOTA L
11.9% 56.0% 40.5% 65.0% 71.4% 79.5% 46.7% 57.4% 7.6% 52.4% 52.5% 2.8% 74.6% 30.6% 42.1% 9.2% 53.3%
12.2% 54.4% 35.9% 65.4% 71.6% 78.7% 44.4% 61.9% 7.0% 49.6% 49.3% 3.4% 63.4% 39.4% 51.3% 13.6% 51.0%
6. INVESTMENTS
Flanders
Belgium
%
I N V E S TM E N T S* 2 0 0 3 (in billions of ¤) (National Statistics Institute on the basis of VAT statistics) Agriculture 0,4 0,6 68.6% Secondary sector 6,4 9,5 67.9% Minerals, energy and water 0,7 1,4 48.1% Industry 4,8 6,7 71.7% Basic metals and metallurgy 1,5 2,2 67.4% Chemicals 1,1 1,5 73.5% Food, beverages and tobacco 0,8 1,1 73.9% Miscellaneous 1,3 2,0 67.4% Construction 0,9 1,3 69.6% Tertiary sector 10,8 19,0 56.6% Trade and reparation 3,0 4,2 70.4% Hotels and restaurants 0,4 0,6 63.5% Transport and traffic 2,4 4,3 55.4% Financial sector 0,5 2,0 27.3% Immovable property and business services 3,6 6,4 57.1% Other services 0,8 1,5 55.0% TOTA L 17,6 29,1 60.5% I N V E S TM E N T S Q U OTA* 2 0 0 3 (in percentage of turnover) (National Statistics Institute on the basis of VAT statistics) Agriculture 9.5% 10.2% Secondary sector 3.8% 3.6% Minerals, energy and water 4.9% 3.8% Industry 3.6% 3.4% Basic metals and metallurgy 3.3% 3.4% Chemicals 4.4% 4.0% Food, beverages and tobacco 3.2% 3.3% Miscellaneous 4.1% 3.1% Construction 4.5% 4.3% Tertiary sector 3.4% 3.8% Trade and reparation 1.3% 1.3% Hotels and restaurants 8.0% 7.5% Transport and traffic 5.7% 7.0% Financial sector 20.9% 21.7% Immovable property and business services 9.5% 8.0% Other services 13.5% 13.0% TOTA L 3.6% 3.7%
E X P O R T: D E V E LO P M E N T * 2 0 0 2 -2 0 0 3
I N V E S TM E N T S : D E V E LO P M E N T * 2 0 0 2 -2 0 0 3
(Average annual growth in percentage) (National Statistics Institute on the basis of VAT statistics) Agriculture -14.6% 1.9% Secondary sector -1.8% -1.5% Minerals, energy and water 11.0% 18.3% Industry -2.7% -3.3% Basic metals and metallurgy -2.7% -2.2% Chemicals -4.6% -9.5% Food, beverages and tobacco 1.3% 0.5% Miscellaneous -26.9% -1.0% Construction 8.8% 7.7% Tertiary sector 12.8% 15.3% Trade and reparation 13.3% 15.3% Hotels and restaurants 30.9% 44.2% Transport and traffic 10.3% 10.1% Financial sector -19.9% 22.2% Immovable property and business services 16.5% 20.6% Other services 7.9% 10.3% TOTA L 7.0% 8.5%
(Average annual growth in percentage) (National Statistics Institute on the basis of VAT statistics) Agriculture -13.1% -8.8% Secondary sector -5.5% -4.3% Minerals, energy and water -15.3% -11.3% Industry -4.2% -3.3% Basic metal and metallurgy 2.4% 5.1% Chemicals -9.1% -8.4% Food, beverages and tobacco -4.1% -4.2% Miscellaneous -15.0% -7.3% Construction -4.3% -1.3% Tertiary sector 1.5% 1.2% Trade and reparation 15.1% 9.2% Hotels and restaurants -7.8% -8.9% Transport and traffic -5.6% -0.8% Financial sector 20.7% 10.7% Immovable property and business services 2.5% -0.9% Other services -22.4% -10.0% TOTA L -1.6% -0.9%
E X P O R T: D E V E LO P M E N T * (Growth percentage compared to previous year)
I N V E S TM E N T S : D E V E LO P M E N T *
(National Statistics Institute on the basis of VAT statistics) 2000-2001 6.4% 2001-2002 3.4% 2002-2003 7.0%
(Growth in percentage compared to previous year) (National Statistics Institute on the basis of VAT statistics) 2000-2001 2.0% 4.9% 2001-2002 -3.1% -5.8% 2002-2003 -1.6% -0.9%
*
9.6% 4.9% 8.5%
N E W C L A S S I F I C AT I O N AC C O R D I N G TO N AC E B E L *
N E W C L A S S I F I C AT I O N AC C O R D I N G TO N AC E B E L