BASISONDERWIJS Leerlingen EDUCATION School population 3 SECONDARY 1 School population in secondary education GO M
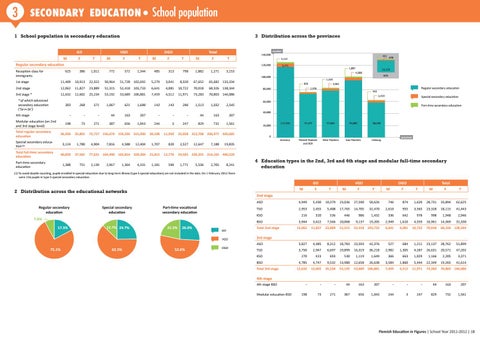
3 Distribution across the provinces VGO
F
T
M
F
OGO T
M
Total
F
T
M
F
T
Regular secondary education Reception class for immigrants
140,000
number
120,000
625
386
1,011
772
572
1,344
485
313
798
1,882
1,271
431
3,142 5,471
1,887
3,153
1st stage
11,409
10,913
22,322
50,964
51,728 102,692
5,279
3,041
8,320
67,652
65,682 133,334
2nd stage
12,062
11,827
23,889
51,315
52,418 103,733
6,641
4,081
10,722
70,018
68,326 138,344
3rd stage *
12,632
12,602
25,234
53,192
53,689 106,881
7,459
4,512
11,971
73,283
70,803 144,086
* of which advanced secondary education (‘Se-n-Se’)
303
268
571
1,067
621
1,688
143
143
286
1,513
1,032
2,545
-
-
-
44
163
207
-
-
-
44
163
207
198
73
271
387
656
1,043
244
3
247
829
732
1,561
Total regular secondary education
36,926
35,801
72,727 156,674 159,226 315,900
20,108
11,950
Special secondary education (1)
3,124
1,780
Total full-time secondary education
40,050
37,581
1,388
751
4th stage Modular education (on 2nd and 3rd stage level)
Part-time secondary education
4,904
12,404
1,707
820
77,631 164,490 163,814 328,304
21,815
12,770
1,181
590
2,139
7,816
2,967
4,588
1,364
4,331
12,647
7,188
BCR
1,443 826
3,961 2,376
80,000
Regular secondary education
943 3,439
Special secondary education
60,000
Part-time secondary education 40,000
20,000
32,058 213,708 206,977 420,685 2,527
13,120
4,588 100,000
678
117,335
72,472
77,663
94,887
58,328
Antwerp
Flemish Brabant and BCR
West Flanders
East Flanders
Limburg
0
19,835
province
34,585 226,355 214,165 440,520 1,771
5,536
2,705
8,241
4 Education types in the 2nd, 3rd and 4th stage and modular full-time secondary education
(1) To avoid double counting, pupils enrolled in special education due to long-term illness (type 5 special education) are not included in the data. On 1 February 2012 there were 216 pupils in type 5 special secondary education.
GO M
2 Distribution across the educational networks Regular secondary education
Special secondary education
12.7% 24.7%
Part-time vocational secondary education
21.5%
26.0%
GO VGO
75.1%
62.5%
F
OGO
T
M
F
T
M
Total
F
T
M
F
T
2nd stage
7.6% 17.3%
VGO
52.6%
OGO
ASO
4,949
5,430
10,379
23,036
27,590
50,626
746
874
1,620
28,731
33,894
62,625
TSO
2,953
2,455
5,408
17,765
14,705
32,470
2,610
955
3,565
23,328
18,115
41,443
KSO
216
320
536
446
986
1,432
336
642
978
998
1,948
2,946
BSO
3,944
3,622
7,566
10,068
9,137
19,205
2,949
1,610
4,559
16,961
14,369
31,330
12,062
11,827
23,889
51,315
52,418 103,733
6,641
4,081
10,722
70,018
68,326 138,344
ASO
3,827
4,485
8,312
18,783
23,593
42,376
527
684
1,211
23,137
28,762
51,899
TSO
3,750
2,947
6,697
19,899
16,319
36,218
2,982
1,305
4,287
26,631
20,571
47,202
KSO
270
423
693
530
1,119
1,649
366
663
1,029
1,166
2,205
3,371
BSO
4,785
4,747
9,532
13,980
12,658
26,638
3,584
1,860
5,444
22,349
19,265
41,614
12,632
12,602
25,234
53,192
53,689 106,881
7,459
4,512
11,971
73,283
70,803 144,086
-
-
-
44
163
207
-
-
-
44
163
207
198
73
271
387
656
1,043
244
3
247
829
732
1,561
Total 2nd stage
3rd stage
Total 3rd stage
4th stage 4th stage BSO Modular education BSO
Flemish Education in Figures | School Year 2011-2012 | 18