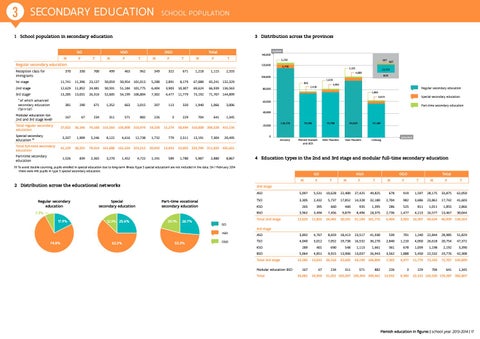
Elementary education educationLeerlingen SCHOOL POPULATION 3 SECONDARY 1 School population in secondary education GO M
F
3 Distribution across the provinces VGO
T
M
F
OGO T
M
Total
F
T
M
F
T
Regular secondary education 370
Reception class for immigrants
140,000
number 3,250
120,000
330
700
499
463
962
349
322
671
1,218
1,115
457
5,778
2,101
2,333
1st stage
11,741
11,396
23,137
50,059
50,954 101,013
5,288
2,891
8,179
67,088
65,241 132,329
2nd stage
12,629
11,852
24,481
50,591
51,184 101,775
6,404
3,903
10,307
69,624
66,939 136,563
3rd stage
13,285
13,031
26,316
52,605
54,199 106,804
7,302
4,477
11,779
73,192
71,707 144,899
*
of which advanced secondary education (‘Se-n-Se’)
381
290
671
1,352
663
2,015
207
113
320
1,940
1,066
3,006
Modular education (on 2nd and 3rd stage level)
167
67
234
311
571
882
226
3
229
704
641
1,345
Total regular secondary education
37,822
36,346
74,168 153,566 156,908 310,474
19,220
11,274
3,337
1,909
12,738
1,732
779
41,159
38,255
79,414 161,688 161,524 323,212
20,952
12,053
1,526
839
1,191
589
13,724
4,689 100,000
BCR
1,610
843
3,991
2,418
80,000
667
Regular secondary education 1,063
Special secondary education
3,619
*
60,000
Part-time secondary education 40,000
Special secondary education (1) Total full-time secondary education Part-time secondary education
5,246
2,365
8,122
3,270
4,616
1,452
4,722
2,511
13,191
7,304
116,276
73,286
75,798
94,929
57,180
Antwerp
Flemish Brabant and BCR
West Flanders
East Flanders
Limburg
20,000
30,494 210,608 204,528 415,136
0
20,495
33,005 223,799 211,832 435,631 1,780
5,987
2,880
8,867
4 Education types in the 2nd and 3rd stage and modular full-time secondary education
(1) To avoid double counting, pupils enrolled in special education due to long-term illness (type 5 special education) are not included in the data. On 1 February 2014 there were 446 pupils in type 5 special secondary education.
Special secondary education
12.3% 25.6%
Part-time vocational secondary education
20.1%
26.7%
62.2%
VGO
OGO
T
M
F
T
M
F
Total T
M
F
T
53.3%
ASO
5,097
5,531
10,628
22,400
27,425
49,825
678
919
1,597
28,175
33,875
62,050
TSO
3,305
2,432
5,737
17,852
14,328
32,180
2,704
982
3,686
23,861
17,742
41,603
KSO
265
395
660
460
935
1,395
286
525
811
1,011
1,855
2,866
BSO
3,962
3,494
7,456
9,879
8,496
18,375
2,736
1,477
4,213
16,577
13,467
30,044
12,629
11,852
24,481
50,591
51,184 101,775
6,404
3,903
10,307
69,624
66,939 136,563
ASO
3,892
4,767
8,659
18,413
23,517
41,930
539
701
1,240
22,844
28,985
51,829
TSO
4,040
3,012
7,052
19,738
16,532
36,270
2,840
1,210
4,050
26,618
20,754
47,372
KSO
289
401
690
548
1,113
1,661
361
678
1,039
1,198
2,192
3,390
BSO
5,064
4,851
9,915
13,906
13,037
26,943
3,562
1,888
5,450
22,532
19,776
42,308
13,285
13,031
26,316
52,605
54,199 106,804
7,302
4,477
11,779
73,192
71,707 144,899
167
67
234
311
882
226
3
229
704
26,081
24,950
51,031 103,507 105,954 209,461
13,932
8,383
Total 2nd stage GO VGO
74.8%
F
2nd stage
7.3% 17.9%
GO M
2 Distribution across the educational networks Regular secondary education
province
OGO
3rd stage
Total 3rd stage Modular education BSO Total
571
641
1,345
22,315 143,520 139,287 282,807
Flemish education in figures | school year 2013-2014 | 17