6 PART-TIME ARTS EDUCATION
School population
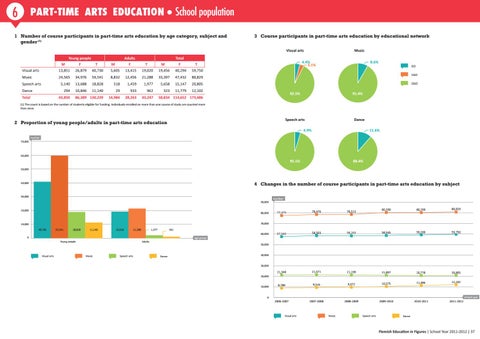
1 Number of course participants in part-time arts education by age category, subject and gender (1)
3 Course participants in part-time arts education by educational network Visual arts
Young people
Adults
M
F
T
Visual arts
13,851
26,879
40,730
Music
24,565
34,976
5,140 294
Speech arts Dance Total
43,850
M
Total
F
T
M
F
T
5,605
13,415
19,020
19,456
40,294
59,750
59,541
8,832
12,456
21,288
33,397
47,432
80,829
13,688
18,828
518
1,459
1,977
5,658
15,147
20,805
10,846
11,140
29
933
962
323
11,779
12,102
86,389 130,239
14,984
28,263
43,247
Music
4.4% 3.1%
8.6%
GO VGO OGO
92.5%
58,834 114,652 173,486
91.4%
(1) The count is based on the number of students eligible for funding. Individuals enrolled on more than one course of study are counted more than once.
Speech arts
2 Proportion of young people/adults in part-time arts education
Dance
4.9% 70,000
11.6%
number
60,000
95.1%
88.4%
50,000
40,000
4 Changes in the number of course participants in part-time arts education by subject
30,000 90,000 20,000
80,000
number 80,390
80,299
80,829
58,263
58,565
59,200
59,750
21,571
21,199
21,007
20,778
20,805
8,789
9,516
9,672
10,375
11,386
12,102
2006-2007
2007-2008
2008-2009
2009-2010
2010-2011
2011-2012
77,475
78,476
78,513
57,545
58,503
21,348
70,000
10,000 40,730
59,541
18,828
11,140
19,020
21,288
1,977
962 60,000
0 Young people
Visual arts
age group
Adults
Music
Speech arts
50,000
Dance
40,000
30,000 20,000 10,000
0
school year
Visual arts
Music
Speech arts
Dance
Flemish Education in Figures | School Year 2011-2012 | 37