6 PART-TIME ARTS EDUCATION
SCHOOL POPULATION
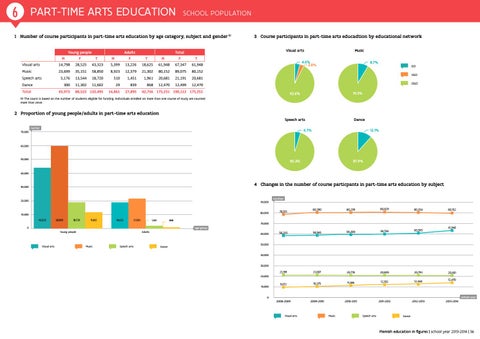
1 Number of course participants in part-time arts education by age category, subject and gender (1) Young people
Adults
M
F
T
Visual arts
14,798
28,525
43,323
Music
23,699
35,151
5,176 300
Speech arts Dance
43,973
Total
M
3 Course participants in part-time arts educadtion by educational network Visual arts
Total
F
T
M
F
T
5,399
13,226
18,625
61,948
67,347
61,948
58,850
8,923
12,379
21,302
80,152
89,075
80,152
13,544
18,720
510
1,451
1,961
20,681
21,191
20,681
11,302
11,602
29
839
868
12,470
12,499
12,470
88,522 132,495
14,861
27,895
Music
4.6% 2.8%
8.7%
GO VGO OGO
42,756 175,251 190,112 175,251
91.3%
92.6%
(1) The count is based on the number of students eligible for funding. Individuals enrolled on more than one course of study are counted more than once.
2 Proportion of young people/adults in part-time arts education Speech arts 70,000
number
Dance
4.7%
12.1%
60,000
50,000
95.3%
87.9%
40,000
4 Changes in the number of course particpants in part-time arts education by subject
30,000
20,000
90,000
80,000
10,000 43,323
58,850
18,720
11,602
18,625
21,302
868
1,961
0
number 80,390
80,299
80,829
80,354
58,263
58,565
59,200
59,750
60,595
21,199
21,007
20,778
20,805
20,793
9,672
10,375
11,386
12,102
12,360
2008-2009
2009-2010
2010-2011
2011-2012
2012-2013
78,513
70,000
age group Young people
Visual arts
Adults
Music
Speech arts
60,000
Dance
80,152
61,948
50,000
40,000
30,000 20,000 10,000
0
20,681 12,470
school year
Visual arts
Music
Speech arts
2013-2014
Dance
Flemish education in figures | school year 2013-2014 | 36