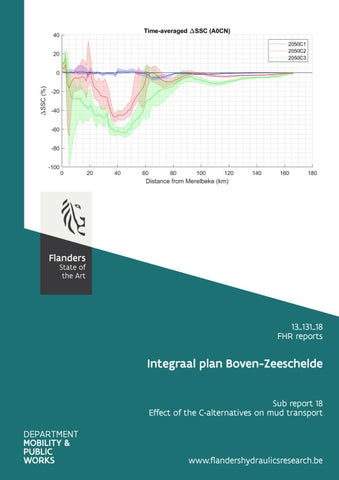
13_131_18 FHR reports
Integraal plan Boven-Zeeschelde Sub report 18 Effect of the C-alternatives on mud transport
www.flandershydraulicsresearch.be
Integraal Plan Bovenzeeschelde Sub report 18 – Effect of the C-alternatives on mud transport
Bi, Q.; Vanlede, J.; Smolders, S.; Mostaert, F.
Cover figure © The Government of Flanders, Department of Mobility and Public Works, Flanders Hydraulics Research Legal notice Flanders Hydraulics Research is of the opinion that the information and positions in this report are substantiated by the available data and knowledge at the time of writing. The positions taken in this report are those of Flanders Hydraulics Research and do not reflect necessarily the opinion of the Government of Flanders or any of its institutions. Flanders Hydraulics Research nor any person or company acting on behalf of Flanders Hydraulics Research is responsible for any loss or damage arising from the use of the information in this report. Copyright and citation © The Government of Flanders, Department of Mobility and Public Works, Flanders Hydraulics Research 2021 D/2021/3241/141 This publication should be cited as follows: Bi, Q.; Vanlede, J.; Smolders, S.; Mostaert, F. (2021). Integraal Plan Bovenzeeschelde: Sub report 18 – Effect of the Calternatives on mud transport. Version 3.0. FHR Reports, 13_131_18. Flanders Hydraulics Research: Antwerp Reproduction of and reference to this publication is authorised provided the source is acknowledged correctly. Document identification Customer: Keywords (3-5): Knowledge domains: Text (p.): Confidential:
IMDC iov. dVW-RegioCentraal Ref.: WL2021R13_131_18 Scaldis; mud; sediment transport Hydraulics and sediment > Sediment > Cohesive sediment > Numerical modelling 58 Appendices (p.): 9 ܈No ܈Available online
Author(s):
Bi, Q.
Control Name Reviser(s):
Project leader:
Vanlede, J., Smolders, S.
Vanlede, J.
Signature Getekend door:Joris Vanlede (Signature) Getekend op:2021-07-12 15:52:10 +02:0 Reden:Ik keur dit document goed
Getekend door:Sven Smolders (Signature Getekend op:2021-07-12 15:47:33 +02:0 Reden:Ik keur dit document goed
Getekend door:Joris Vanlede (Signature) Getekend op:2021-07-12 15:54:02 +02:0 Reden:Ik keur dit document goed
Approval Head of Division:
F-WL-PP10-2 Version 7 Valid as from 3/01/2017
Mostaert, F.
Getekend door:Stefan Geerts (Signature) Getekend op:2021-07-13 08:49:22 +02:0 Reden:Ik keur dit document goed
Integraal Plan Bovenzeeschelde - Sub report 18 – Effect of the C-alternatives on mud transport
Abstract The calibrated mud transport model based on the 3D Scaldis HD model is used to analyse the effects of three potential alternative bathymetries: the C alternatives. This report describes the effects of the C alternatives against a future reference situation (2050REF_C). The focus is on the effects on the mud transport and suspended sediment concentrations in the Upper Sea Scheldt, under 3 different scenarios (boundary conditions), namely A0CN, AminCL and AplusCH. The model results are described in terms of differences between the reference run and the C alternatives. They are presented and interpreted in multiple ways as (1) the relative effect on suspended sediment concentration (ΔSSC), (2) the decomposed sediment transport (advection and tidal pumping), and (3) plots of expected sedimentation and erosion. The results are synthesised in a discussion for each alternative.
Final version
WL2021R13_131_18
III
F-WL-PP10-2 Version 7 Valid as from 3/01/2017
Integraal Plan Bovenzeeschelde - Sub report 18 – Effect of the C-alternatives on mud transport
Contents Abstract ............................................................................................................................................................ III Contents ............................................................................................................................................................ V List of tables..................................................................................................................................................... VII List of figures .................................................................................................................................................. VIII 1
Introduction ............................................................................................................................................... 1
2
Units and reference plane ......................................................................................................................... 2
3
The Calibrated Mud Model and Scenarios ................................................................................................ 3 3.1
3.1.1
Parametrisation of dredging and disposal................................................................................. 3
3.1.2
Roughness parametrisation....................................................................................................... 4
3.1.3
The reference bathymetry and the bathymetry of C-alternatives ............................................ 4
3.2
4
5
Model set-up ..................................................................................................................................... 3
Boundary conditions........................................................................................................................ 15
3.2.1
Upstream Boundary Conditions .............................................................................................. 15
3.2.2
Downstream Boundary Conditions ......................................................................................... 15
3.3
Initialization of the model ............................................................................................................... 16
3.4
Alternatives and scenarios for the mud model ............................................................................... 16
3.4.1
Representative discharges for 2013 and 2050 ........................................................................ 16
3.4.2
Tidal range scenarios ............................................................................................................... 17
3.4.3
Sea level rise scenarios ............................................................................................................ 18
3.4.4
Scenarios for the mud model .................................................................................................. 18
3.4.5
Overview of Model Runs ......................................................................................................... 18
3.4.6
Simulation period .................................................................................................................... 19
Methodology of Determining the Effects ................................................................................................ 20 4.1
Evaluation Framework..................................................................................................................... 20
4.2
Polygons and transects .................................................................................................................... 21
4.3
Tidal Asymmetry .............................................................................................................................. 24
4.4
Delta SSC (ΔSSC) .............................................................................................................................. 24
4.5
Decomposition of sediment transport and flux .............................................................................. 25
4.6
Sedimentation and erosion ............................................................................................................. 27
4.7
Bed shear stress and its exceedance time....................................................................................... 27
Results ..................................................................................................................................................... 29
Final version
WL2021R13_131_18
V
Integraal Plan Bovenzeeschelde - Sub report 18 – Effect of the C-alternatives on mud transport
5.1
5.1.1
SSC and ΔSSC ........................................................................................................................... 29
5.1.2
Sedimentation plots ................................................................................................................ 34
5.2
2050C2 ............................................................................................................................................. 36
5.2.1
SSC and ΔSSC ........................................................................................................................... 36
5.2.2
Sedimentation plots ................................................................................................................ 40
5.2.3
Explanatory parameters: bed shear stress and velocity magnitude ....................................... 42
5.3
2050C3 ............................................................................................................................................. 43
5.3.1
SSC and ΔSSC ........................................................................................................................... 43
5.3.2
Sedimentation plots ................................................................................................................ 46
5.3.3
Explanatory parameter: velocity magnitude ........................................................................... 48
5.4
6
2050C1 ............................................................................................................................................. 29
Long term sinks................................................................................................................................ 49
5.4.1
FCA-CRT ................................................................................................................................... 49
5.4.2
Depoldered areas .................................................................................................................... 50
5.4.3
Total Sediment Balance ........................................................................................................... 52
Discussion and conclusion ....................................................................................................................... 53 6.1
Discussion ........................................................................................................................................ 53
6.2
Conclusions ...................................................................................................................................... 56
7
References ............................................................................................................................................... 57
Appendix 1
Polygons for ΔSSC calculation.................................................................................................. A1
Polygons for 2050C1 .................................................................................................................................... A1 Polygons for 2050C2 .................................................................................................................................... A3 Polygons for 2050C3 .................................................................................................................................... A5 Appendix 2
VI
Bottom evolution in FCA-CRTs and depoldering areas over 50 years ..................................... A7
WL2021R13_131_18
Final version
Integraal Plan Bovenzeeschelde - Sub report 18 – Effect of the C-alternatives on mud transport
List of tables Table 1 – Physical parameters used in the mud model..................................................................................... 3 Table 2 – Overview of all measures in the C alternatives (IMDC, 2021) ........................................................... 5 Table 3 – Imposed mud concentrations at upstream tributaries.................................................................... 15 Table 4 – Tidal range scenarios ....................................................................................................................... 17 Table 5 – List of the different scenarios/alternatives runs.............................................................................. 19 Table 6 – Selected explanatory and evaluation parameters from the evaluation framework ....................... 20
Final version
WL2021R13_131_18
VII
Integraal Plan Bovenzeeschelde - Sub report 18 – Effect of the C-alternatives on mud transport
List of figures Figure 1 – The bathymetry used in the 2050REF_C .......................................................................................... 4 Figure 2 – Bathymetry of the Upper Sea Scheldt in 2050REF_C (km 1-13) ....................................................... 7 Figure 3 – Bathymetry of the Upper Sea Scheldt in 2050REF_C (km 14-34) ..................................................... 7 Figure 4 – Bathymetry of the Upper Sea Scheldt in 2050REF_C (km 35-56) ..................................................... 8 Figure 5 – Bathymetry of the Upper Sea Scheldt in 2050REF_C (km 56-64) ..................................................... 8 Figure 6 – Bathymetry of the Upper Sea Scheldt in 2050C1 (km 1-13)............................................................. 9 Figure 7 – Bathymetry of the Upper Sea Scheldt in 2050C1 (km 14-34)........................................................... 9 Figure 8 – Bathymetry of the Upper Sea Scheldt in 2050C1 (km 35-56)......................................................... 10 Figure 9 – Bathymetry of the Upper Sea Scheldt in 2050C1 (km 56-64)......................................................... 10 Figure 10 – Bathymetry of the Upper Sea Scheldt in 2050C2 (km 1-13)......................................................... 11 Figure 11 – Bathymetry of the Upper Sea Scheldt in 2050C2 (km 14-34)....................................................... 11 Figure 12 – Bathymetry of the Upper Sea Scheldt in 2050C2 (km 35-56)....................................................... 12 Figure 13 – Bathymetry of the Upper Sea Scheldt in 2050C2 (km 56-64)....................................................... 12 Figure 14 – Bathymetry of the Upper Sea Scheldt in 2050C3 (km 1-13)......................................................... 13 Figure 15 – Bathymetry of the Upper Sea Scheldt in 2050C3 (km 14-34)....................................................... 13 Figure 16 – Bathymetry of the Upper Sea Scheldt in 2050C3 (km 35-56)....................................................... 14 Figure 17 – Bathymetry of the Upper Sea Scheldt in 2050C3 (km 56-64)....................................................... 14 Figure 18 – Upstream discharges used in mud model scenarios .................................................................... 17 Figure 19 – The zone with changed bottom friction in the tidal range scenarios........................................... 18 Figure 20 – Polygons for 2050_REF_C (polygons 1-13, 87-88) ........................................................................ 21 Figure 21 – Polygons for 2050_REF_C (polygons 13-31, 85-86) ...................................................................... 22 Figure 22 – Polygons for 2050_REF_C (polygons 32-58, 78-84) ...................................................................... 22 Figure 23 – Polygons for 2050_REF_C (polygons 59-77) ................................................................................. 23 Figure 24 – Map of the Scheldt estuary with main tributaries and most important locations. The thalweg is indicated with the red dotted line................................................................................................................... 23 Figure 25 – Methodology of working with Deltas ........................................................................................... 24 Figure 26 – Bathymetry differences between 2050C1 and 2050REF_C in the Upper Sea Scheldt ................. 29 Figure 27 – Time-averaged surface SSC and depth-average SSC in 2050C1 ................................................... 30 Figure 28 – Depth-averaged sediment concentration in the upstream zone km 0-5 at a certain time step.. 31 Figure 29 – Time-averaged depth-averaged ΔSSC (2050C1) ........................................................................... 31 Figure 30 – Cross-sectionally averaged velocity bias during ebb and flood (2050C1). ................................... 32 Figure 31 – The effect of C1 on the exceedance rate of bed shear stress > 1 Pa in the Upper Sea Scheldt from km 23-65 (A0CN) ............................................................................................................................................. 33
VIII
WL2021R13_131_18
Final version
Integraal Plan Bovenzeeschelde - Sub report 18 – Effect of the C-alternatives on mud transport
Figure 32 – Comparison of depth-averaged and surface ΔSSC (2050C1_A0CN)............................................. 33 Figure 33 – Time-averaged vertical profiles of SSC at km 19 in the main channel in 2050REF_C_A0CN and 2050C1_A0CN .................................................................................................................................................. 34 Figure 34 – Effect of C1 on sedimentation and erosion (m) after 40 days from Km24-65 (A0CN) ................. 35 Figure 35 – Effect of C1 on sedimentation and erosion after 40 days from Km1-23 (A0CN) ......................... 35 Figure 36 – Time-averaged surface SSC and depth-average SSC in 2050C2 ................................................... 37 Figure 37 – Bathymetry differences between 2050C2 and 2050REF_C in the Upper Sea Scheldt ................. 38 Figure 38 – Time-averaged depth-averaged ΔSSC (2050C2) ........................................................................... 38 Figure 39 – Effect of 2050C2 on tidal asymmetry Tflood/Tebb............................................................................ 39 Figure 40 – Comparison of depth-averaged and surface ΔSSC (2050C2_A0CN)............................................. 40 Figure 41 – Effect of C2 on sedimentation and erosion (m) after 40 days from Km24-65 (A0CN) ................. 41 Figure 42 – Effect of C2 on sedimentation and erosion (m) after 40 days from Km1-23 (A0CN) ................... 41 Figure 43 – The effect of C2 on the exceedance rate of bed shear stress > 1 Pa in the Upper Sea Scheldt from km 23-65 (A0CN) ............................................................................................................................................. 42 Figure 44 – The effect of C2 on the frequency of velocity magnitude > 0.65 m/s in the Upper Sea Scheldt from km 1-23 (A0CN) ............................................................................................................................................... 42 Figure 45 – Time-averaged surface SSC and depth-average SSC in 2050C3 ................................................... 43 Figure 46 – Bathymetry differences between 2050C3 and 2050REF_C in the Upper Sea Scheldt ................. 44 Figure 47 – Time-averaged depth-averaged ΔSSC (2050C3) ........................................................................... 45 Figure 48 – Comparison of depth-averaged and surface ΔSSC (2050C3_A0CN)............................................. 46 Figure 49 – Effect of C3 on sedimentation and erosion (m) after 40 days from Km24-65 (A0CN) ................. 47 Figure 50 – Effect of C3 on sedimentation and erosion (m) after 40 days from Km1-23 (A0CN) ................... 47 Figure 51 – The effect of C3 on the frequency of velocity magnitude > 0.65 m/s in the Upper Sea Scheldt from km 1-23 (A0CN) ............................................................................................................................................... 48 Figure 52 – Sedimentation rate in FCA-CRTs expressed in TDM/yr ................................................................ 49 Figure 53 – Sedimentation rate expressed in TDM/yr in depoldered areas (2050REF_C).............................. 50 Figure 54 – Sedimentation rate expressed in TDM/yr in depoldered areas (2050C1).................................... 50 Figure 55 – Sedimentation rate expressed in TDM/yr in depoldered areas (2050C2).................................... 51 Figure 56 – Sedimentation rate expressed in TDM/yr in depoldered areas (2050C3).................................... 51 Figure 57 – The estimated yearly sedimentation averaged over 50 years ..................................................... 52 Figure 58 – Time-averaged depth-averaged SSC along the Scheldt estuary (A0CN) ...................................... 53 Figure 59 – The time-averaged depth-averaged ΔSSC of C alternatives (A0CN) ............................................ 54 Figure 60 – Averaged total sediment transport (A0CN) .................................................................................. 55 Figure 61 – Averaged sediment transport due to advection (A0CN) .............................................................. 55 Figure 62 – Averaged sediment transport due to tidal pumping (A0CN)........................................................ 56 Figure 63 – Polygons for 2050_C1 (polygons 1-13, 87-88) .............................................................................. A1 Figure 64 – Polygons for 2050_C1 (polygons 13-31, 85-86) ............................................................................ A1
Final version
WL2021R13_131_18
IX
Integraal Plan Bovenzeeschelde - Sub report 18 – Effect of the C-alternatives on mud transport
Figure 65 – Polygons for 2050_C1 (polygons 32-58, 79-84) ............................................................................ A2 Figure 66 – Polygons for 2050_C1 (polygons 59-78) ....................................................................................... A2 Figure 67 – Polygons for 2050_C2 (polygons 1-13, 91-92) .............................................................................. A3 Figure 68 – Polygons for 2050_C2 (polygons 13-31, 89-90) ............................................................................ A3 Figure 69 – Polygons for 2050_C2 (polygons 32-58, 79-88) ............................................................................ A4 Figure 70 – Polygons for 2050_C2 (polygons 59-78) ....................................................................................... A4 Figure 71 – Polygons for 2050_C3 (polygons 1-13, 90-91) .............................................................................. A5 Figure 72 – Polygons for 2050_C3 (polygons 13-31, 88-89) ............................................................................ A5 Figure 73 – Polygons for 2050_C3 (polygons 32-58, 79-87) ............................................................................ A6 Figure 74 – Polygons for 2050_C3 (polygons 59-78) ....................................................................................... A6 Figure 75 – Sedimentation rate in FCA-CRTs over 50 years ............................................................................ A7 Figure 76 – Sedimentation rate in depoldered areas with sea level rise (2050REF_C)................................... A8 Figure 77 – Sedimentation rate in depoldered areas with sea level rise (2050C1) ........................................ A8 Figure 78 – Sedimentation rate in depoldered areas with sea level rise (2050C2) ........................................ A9 Figure 79 – Sedimentation rate in depoldered areas with sea level rise (2050C3) ........................................ A9
X
WL2021R13_131_18
Final version
Integraal Plan Bovenzeeschelde - Sub report 18 – Effect of the C-alternatives on mud transport
1 Introduction Based on the SCALDIS model, a mud transport model, as a part of a high-resolution sediment transport model for the whole Scheldt estuary is developed and calibrated. The details of the mud model are reported in Smolders et al. (2018). The main objective of this mud transport model is to study future (time horizon = 2050) scenarios/alternatives of the Scheldt estuary by quantifying the effects compared to the reference case, e.g. the effects on suspended sediment concentration (SSC), sediment flux through zones of interest and erosion/deposition on intertidal flats and subtidal channels. The present report describes the model results with new future bathymetry alternatives in the tidalinfluenced zones of the estuary. These new alternatives are called C-alternatives and developed with the following mindset (IMDC, 2021): •
C1 alternative: Tackle the most prominent nautical bottlenecks (Km 0 – Ringvaart, km 10 – Wetteren, km 15 till km 17 – Hoogland and Uitbergen, Km 30 – Kasteeltje, km 40 – Kramp). Looking for opportunities in the river and redefining the Sigma plan to improve habitat and to reduce the increase in tidal amplitude.
•
C2 alternative: Tackle also less prominent nautical bottlenecks and define additional measures for the most prominent bottlenecks. Include additional opportunities in the valley (depolderings, side channels) to improve habitat and to reduce the increase in tidal amplitude.
•
C3 alternative: Yet additional nautical measures for a limited number of locations (Uitbergen, Paardenweide, Kasteeltje) and additional measures (larger depolderings, additional depoldering at Weert, undeepening at Temse) aiming at providing extra system resilience while also improving habitat conditions.
All the C alternatives are designed based on the sustainable bathymetry for 2050 (IMDC, 2015). The overview of the implemented measures is described in Bi et al. (2020a).
Final version
WL2021R13_131_18
1
Integraal Plan Bovenzeeschelde - Sub report 18 – Effect of the C-alternatives on mud transport
2 Units and reference plane Time is expressed in CET (Central European Time). Depth, height and water levels are expressed in meter TAW (Tweede Algemene Waterpassing). Bathymetry and water levels are positive above the reference plane. The horizontal coordinate system is RD Parijs. Distance along the estuary is measured in km from the lock in Merelbeke.
2
WL2021R13_131_18
Final version
Integraal Plan Bovenzeeschelde - Sub report 18 – Effect of the C-alternatives on mud transport
3 The Calibrated Mud Model and Scenarios 3.1 Model set-up The mud model used for the analysis of C alternatives is based on the same calibrated mud model used in the analysis of B alternatives (Bi et al., 2018). The main difference between the mud model for C- and the B-alternatives is the computational grid or the mesh. Due to the new measures in C-alternatives (C1-C2-C3), the previous mesh has to be extended to accommodate the additional depoldered and FCA/FCA-CRT areas. Moreover, the new FCA/FCA-CRT areas also require updating the configuration of culverts in the domain. The rest of the model settings are kept the same as in the mud model for the B alternatives. An overview of the physical parameters for the mud model is given in Table 1. Table 1 – Physical parameters used in the mud model
3.1.1
Physical parameters
CAL_007
INITIAL MUD CONCENTRATION (g/L)
0.5
DENSITY OF THE SEDIMENT (kg/m3)
2650
CONSTANT SEDIMENT SETTLING VELOCITY (m/s)
5.0E-04
HINDERED SETTLING
NO
NUMBER OF SEDIMENT BED LAYERS
1
INITIAL THICKNESS OF SEDIMENT LAYERS (m)
0.0
MUD CONCENTRATIONS PER LAYER (kg/m3)
500
EROSION COEFFICIENT (kg/m2/s)
1.0E-04
CRITICAL EROSION SHEAR STRESS OF THE MUD LAYERS (Pa)
0.05
CRITICAL SHEAR STRESS FOR DEPOSITION (Pa)
1.0E06
Parametrisation of dredging and disposal
A point source is placed in the model near Oosterweel, releasing disposed material into the water column. This is used to simulate the sediment disposal process in the 3D sediment transport model. According to the field observations, the yearly averaged amount of sediment deposited back in the estuary is 4.545.995 Tons (averaged over period 2007 – 2015). This number is converted into a constant sediment release rate at the point source to make sure the same amount of material is put back into the system. This point source remains the same in all the reference cases and the C alternatives.
Final version
WL2021R13_131_18
3
Integraal Plan Bovenzeeschelde - Sub report 18 – Effect of the C-alternatives on mud transport
In the mud model there is no material dredged from the locks and docks. Although the amount of deposition and erosion is recorded, the bottom elevation is not updated due to decoupling between hydrodynamics and bottom evolution. Therefore, there is no effect . 3.1.2
Roughness parametrisation
Instead of using spatial varying bottom roughness (Manning coefficients) as in the hydrodynamic model, a constant and uniform Manning coefficient (0.02) is used in the mud model, same as in the model for the B alternatives (Smolders et al., 2018). Therefore, only flow velocity and water level are used from the hydrodynamics in the mud model, while the bed shear stress for erosion-deposition is computed separately. The reason for using a different roughness coefficient in the mud model is that the spatial variable Manning coefficients used in the hydrodynamic model are correcting for more than only the differences in bottom roughness, e.g. a turbulence model that might be too dissipative in the more meandering parts of the estuary. Using the same roughness of the HD model in the mud model gives undesired patterns in the calculation of the bottom shear stress and erosion rates. 3.1.3
The reference bathymetry and the bathymetry of C-alternatives
For implementing the three different C alternatives (C1, C2 and C3) in the SCALDIS model, a new reference grid is created based on the original 2050REF grid used in the B-alternatives (2050REF_B). This new reference grid, named 2050REF_C, is then used as the basis for implementing the C alternatives.
Figure 1 – The bathymetry used in the 2050REF_C
The new reference grid is obtained by extending and refining the 2050REF_B mesh in the Upper Sea Scheldt in order to include the maximum outline of all C alternatives. For the rest of the domain except in the Ringvaart (a widened and deepened Ringvaart is applied to the 2050REF_C and the C alternatives), the grid remains unmodified, in order to allow the reuse of the boundary data. In the extended areas in the Upper Sea Scheldt, the finest grid resolution is about 7 m, and the coarsest resolution is about 50 m. The new reference grid is able to accommodate the adaptations of the navigation channel, the new development of intertidal nature and the additional de-embankments and FCAs (with and without CRT), which are considered in any of the C alternatives.
4
WL2021R13_131_18
Final version
Integraal Plan Bovenzeeschelde - Sub report 18 – Effect of the C-alternatives on mud transport
The sustainable bathymetry in the 2050REF_B grid is adapted by deepening and widening of the Ringvaart and becomes the new reference grid 2050REF_C. For the extended areas in 2050REF_C, the background bathymetry that represents the current situation (provided by IMDC) is mapped to the mesh. When incorporating the C alternatives, the new bathymetry from C1, C2 and C3 is mapped to the 2050REF_C grid, respectively. The overview of the implemented measures in the C alternatives is presented in Table 2. Table 2 – Overview of all measures in the C alternatives (IMDC, 2021)
Distance to Merelbeke [km]
Overview measures C1
MHW
MLW
[m TAW]
[m TAW]
5.05
2.44
5.05
2.44
5.05
2.44
5.06
2.37
5.07
2.28
5.08
2.23
Depoldering
5.08
2.23
Additional FCA in the north
5.08
2.12
5.10
2.10
5.10
2.02
C2
C3
Ringvaart
0-3
Veerhoek
4.5
-
Melleham
5.5
Limited tidal interaction
Bommels
6.5
-
Voorde
9
Wetteren
11
DS Wetteren
12.5
FCA Wijmeers
15
Wijmeers (Hoogland)
16
Uitbergen
19
Paardenweide (Wichelen)
21
-
-
Bend cut off+depoldering
5.10
1.95
Oude Broekmeer
24-27
-
Depoldering variant 1 + side channel
Depoldering variant 2 + side channel
5.17
1.63
Appels (Scheldebroek)
28
Improved navigation by smoothing the bend (cfr Chafing)
5.20
1.50
Scheldebroek
28
FCA Scheldebroek converted into FCA-CRT
5.20
1.50
Sint-Onolfspolder
28-30
5.20
1.50
Kasteeltje
31
5.27
1.24
Dender
32.5
5.3
1.12
Final version
Deepening and widening (also present in 2050REF_C) Widening + pull back of dyke CRT without FCA
Depoldering
Widening + pull back of dyke Bend modifications + intertidal nature
-
-
Improved navigation (cfr VaG) by installing sheet piles
Bend cut off (C1: variant 1, C2: variant 2, C3: variant 3) + intertidal nature+FCA Bend cut off + intertidal nature+depoldering (C1: variant 1, C2: variant 2, C3: variant 3)
-
Depoldering variant 1 + side channel variant 1
Depoldering variant 1 + side channel variant 2
Bend smoothening + intertidal nature (C1: variant 1, C2: variant 2, C3: variant 3) -
Improved navigation by widening channel
WL2021R13_131_18
5
Integraal Plan Bovenzeeschelde - Sub report 18 – Effect of the C-alternatives on mud transport
Overview measures
MHW
MLW
[m TAW]
[m TAW]
5.34
1.02
5.38
0.91
5.40
0.85
5.44
0.75
FCA with CRT
5.50
0.59
Depoldering variant 1
Depoldering variant 2
5.55
0.40
-
Depoldering together with Blankaart
5.54
0.38
5.52
0.31
Depoldering
5.52
0.31
Local fill-in + reducing channel depth
5.46
0.15
Depoldering + new side channel
5.47
0.19
-
Depoldering + new side channel
5.47
0.16
-
Depoldering + new side channel
5.45
0.13
Distance to Merelbeke [km]
C1
Grembergen broek – Armenput
35-38
-
Waterleiding
38
Roggeman
39
Kockham (Kramp)
40
Wal-Zwijn
44-48
FCA with CRT
FCA with CRT
Blankaart
49
FCA
Akkershoofd
50
-
Tielrode Broek
55
Weert
51-56
Temse to Rupel
57-64
Schouselbroek
59
-
Schellandpolder
61
Oudbroekpolder
63
C2
C3 Depoldering
Improved navigation (cfr Chafing) by widening channel Depoldering variant 1
-
Depoldering variant 2
Bend cut off + intertidal nature (C1: variant 1; C2-C3: variant 2)
New connection with Durme + partly depoldering Tielrode Broek -
Local fill-in
The bathymetry of the 2050REF_C and the C alternatives are shown below.
6
WL2021R13_131_18
Final version
Integraal Plan Bovenzeeschelde - Sub report 18 – Effect of the C-alternatives on mud transport
Reference bathymetry The bathymetry of the 2050REF_C is shown in Figure 2 - Figure 5. There are no new measures defined in this reference case. The Ringvaart is deepened and included as a no-deposition zone in order to avoid that the zone acts as a sediment trap (as was the case in the initial B scenarios).
Figure 2 – Bathymetry of the Upper Sea Scheldt in 2050REF_C (km 1-13)
Figure 3 – Bathymetry of the Upper Sea Scheldt in 2050REF_C (km 14-34)
Final version
WL2021R13_131_18
7
Integraal Plan Bovenzeeschelde - Sub report 18 – Effect of the C-alternatives on mud transport
Figure 4 – Bathymetry of the Upper Sea Scheldt in 2050REF_C (km 35-56)
Figure 5 – Bathymetry of the Upper Sea Scheldt in 2050REF_C (km 56-64)
8
WL2021R13_131_18
Final version
Integraal Plan Bovenzeeschelde - Sub report 18 – Effect of the C-alternatives on mud transport
C1 bathymetry The bathymetry used of the C1 alternative is shown in Figure 6 - Figure 9. The new measures implemented in the C1 alternative are listed in Table 2.
Figure 6 – Bathymetry of the Upper Sea Scheldt in 2050C1 (km 1-13)
Figure 7 – Bathymetry of the Upper Sea Scheldt in 2050C1 (km 14-34)
Final version
WL2021R13_131_18
9
Integraal Plan Bovenzeeschelde - Sub report 18 – Effect of the C-alternatives on mud transport
Figure 8 – Bathymetry of the Upper Sea Scheldt in 2050C1 (km 35-56)
Figure 9 – Bathymetry of the Upper Sea Scheldt in 2050C1 (km 56-64)
10
WL2021R13_131_18
Final version
Integraal Plan Bovenzeeschelde - Sub report 18 – Effect of the C-alternatives on mud transport
C2 bathymetry The bathymetry used of the C2 alternative is shown in Figure 10 - Figure 13. The new measures implemented in the C2 alternative can be seen in Table 2.
Figure 10 – Bathymetry of the Upper Sea Scheldt in 2050C2 (km 1-13)
Figure 11 – Bathymetry of the Upper Sea Scheldt in 2050C2 (km 14-34)
Final version
WL2021R13_131_18
11
Integraal Plan Bovenzeeschelde - Sub report 18 – Effect of the C-alternatives on mud transport
Figure 12 – Bathymetry of the Upper Sea Scheldt in 2050C2 (km 35-56)
Figure 13 – Bathymetry of the Upper Sea Scheldt in 2050C2 (km 56-64)
12
WL2021R13_131_18
Final version
Integraal Plan Bovenzeeschelde - Sub report 18 – Effect of the C-alternatives on mud transport
C3 bathymetry The bathymetry used of the C3 alternative is shown in Figure 14 - Figure 17. The C3 alternative has the most new measures implemented, as listed in Table 2.
Figure 14 – Bathymetry of the Upper Sea Scheldt in 2050C3 (km 1-13)
Figure 15 – Bathymetry of the Upper Sea Scheldt in 2050C3 (km 14-34)
Final version
WL2021R13_131_18
13
Integraal Plan Bovenzeeschelde - Sub report 18 – Effect of the C-alternatives on mud transport
Figure 16 – Bathymetry of the Upper Sea Scheldt in 2050C3 (km 35-56)
Figure 17 – Bathymetry of the Upper Sea Scheldt in 2050C3 (km 56-64)
14
WL2021R13_131_18
Final version
Integraal Plan Bovenzeeschelde - Sub report 18 – Effect of the C-alternatives on mud transport
3.2 Boundary conditions 3.2.1
Upstream Boundary Conditions
Upstream tributaries feed the model with a discharge. There are 8 upstream boundaries with prescribed discharge and suspended sediment concentration. Discharges are defined as upstream boundary conditions at the Upper Sea Scheldt for Merelbeke, Dender, Zenne, Dijle, Kleine Nete, Grote Nete, Kanaal Gent - Terneuzen (Smolders et al., 2016). See also section 3.4.1 for the representative discharges. Table 3 – Imposed mud concentrations at upstream tributaries
Tributaries
Imposed concentration (g/L)
Dender
0.098
Zenne
0.062
Kleine Nete
0.041
Dijle
0.074
Grote Nete
0.045
Merelbeke
0.094
Besides of the discharges, in the mud model, sediment concentration is imposed to each upstream tributaries. The imposed sediment concentration is calculated based on the yearly averaged redistributed sediment loads as shown in Table 3 (taken from Smolders et al., 2018). These imposed concentrations stay the same in all the reference cases and scenarios. Because the upstream discharge is synthetic and remains constant most of the time (with a peak event in a short duration), the imposed SSC is derived based on the yearly sediment input. 3.2.2
Downstream Boundary Conditions
A model chain is used to generate downstream boundary conditions for the mud model. There are two levels of nesting involved in this procedure, from CSM (Continental Shelf Model) to ZUNO (Zuidelijke Noordzee), and from ZUNO to SCALDIS. Sea level rise (SLR) is implemented in the boundary of the CSM model. The effect of SLR is calculated throughout the model chain. Both water level and velocities are used as downstream boundary conditions in the SCALDIS mud model. This resolves instability issues near the North Sea boundary when there was only water level imposed in earlier versions of SCALDIS. For the actual situation, the ZUNO model (ZUNO_2013_harmonic) is used for obtaining water levels, velocity and salinity at the downstream boundary. For scenarios including Sea Level Rise The downstream boundary conditions in the mud model are inherited from the CSM-ZUNO model chain, in which the sea level rise is added into the boundary conditions of the CSM model. To be more specific, the CSM models with sea level rise scenarios (“CSM_2050_noWind_plus15cm” and “CSM_2050_noWind_plus40cm”) are used. In this case, the nested ZUNO model will naturally have sea level rise when it uses the water levels generated by CSM models as its
Final version
WL2021R13_131_18
15
Integraal Plan Bovenzeeschelde - Sub report 18 – Effect of the C-alternatives on mud transport
boundary conditions. The mud model is then nested in ZUNO model, and will therefore “inherit” the sea level rise by using water levels, velocity and salinity from the ZUNO model at its downstream boundary nodes. The downstream boundary also has a prescribed sediment concentration, which is derived from satellite images in the study of Fettweis et al. (2007). An average value of 12 mg/L is taken to represent SSC values at the North Sea. Since the simulation period is relatively short (40 days), seaward boundary is far away from the zone of interest, it does not significantly affect the Upper Sea Scheldt due to the fact that the Upper Sea Scheldt is ebb dominant and the net sediment transport is towards downstream, the seaward boundary value is kept constant over space and time, and remains the same for all alternatives and scenarios described in this report.
3.3 Initialization of the model The mud transport model is initialized with an empty bed and uniform suspension concentration of 500 mg/L as described in Smolders et al. (2018). For the hydrodynamics, the mud model is initialized with the flow field from the last time step of a 2-day pure-hydrodynamic hotstart run.
3.4 Alternatives and scenarios for the mud model The calibrated mud transport model is used to evaluate the effects of different C-alternatives (specified geometry of the Scheldt estuary), under different scenarios (a range of boundary conditions to take into account climate change, sea level rise, increasing or decreasing tidal amplitude, high or low river discharge). The list of the scenario runs is presented in Table 5. More information about the SCALDIS model can be found in (Smolders et al., 2016 ). 3.4.1
Representative discharges for 2013 and 2050
There are two different sets of synthetic discharges used as the upstream boundary conditions in the mud model scenarios. One is based on the current situations of 2013 (QN2013), and the other one is made for the future scenarios in 2050 (QN2050). Each of these synthetic time series of discharge contains one event with a peak discharge. In Figure 18, the discharges at Melle, Dender and Rupel (the sum of Zenne, Dijle, Grote Nete and Kleine Nete) for the current situation and for the 2050 scenarios are plotted together. It can be seen that the discharge becomes larger for Melle and Dender in 2050, and smaller for Rupel. The Rupel basin also has a smaller average discharge in 2050 compared to the current situation.
16
WL2021R13_131_18
Final version
Integraal Plan Bovenzeeschelde - Sub report 18 – Effect of the C-alternatives on mud transport
Figure 18 – Upstream discharges used in mud model scenarios
These two sets of upstream discharges are provided by IMDC, based on statistical analysis for the current and future scenarios (IMDC, 2015). The discharge for the current situation (QN2013) is applied in the runs with A0CN scenarios. The discharge for the 2050 (QN2050) is used in the runs with AminCL and AplusCH scenarios. The list of the runs and their boundaries conditions are summarized in Table 5. 3.4.2
Tidal range scenarios
In this study, tidal range scenarios A+, A0 and A- have been implemented in both the hydrodynamic model and the mud model. In these three scenarios, the tidal amplitude at Schelle is equal to 5.70, 5.40 and 5.00 m, respectively (Table 4). Table 4 – Tidal range scenarios
Scenario
Bottom friction
A+
The bottom friction for hydrodynamics in the 5.70 Western Scheldt is lowered.
A0
The bottom friction for hydrodynamics in the 5.40 (current tidal range) Western Scheldt remains as in the SCALDIS hydrodynamic model.
A-
The bottom friction for hydrodynamics in the 5.00 Western Scheldt is increased.
Final version
Tidal amplitude at Schelle (m)
WL2021R13_131_18
17
Integraal Plan Bovenzeeschelde - Sub report 18 – Effect of the C-alternatives on mud transport
The increase and decrease of the tidal range is realised in the model by changing the roughness (Manning coefficient) in the Western Scheldt. The zone with altered bottom roughness is indicated in Figure 19. For the scenario “A+”, the Manning coefficient at each point in the red zone is decreased by 0.00426; for the scenario “A-”, the Manning coefficient at each point in the red zone is increased by 0.00554. These values were determined by calibration in order to achieve the target tidal amplitudes at Schelle. For the Western Scheldt, these changes will impact the sediment results in an unrealistic way. However, since this region is away from the Upper Sea Scheldt, the impact on the model results in the zone of interest is limited.
Figure 19 – The zone with changed bottom friction in the tidal range scenarios (red indicates the area with changes).
3.4.3
Sea level rise scenarios
The following sea level rise scenarios are modelled in different runs for 2050: -
The “current” situation (CN, +0 cm in 2050);
-
The “low” scenario (CL, +15 cm in 2050);
-
The “high” scenario (CH, +40 cm in 2050).
The downstream boundary conditions for “CL” and “CH” scenarios are generated from CSM-ZUNO model, instead of adding the values directly on the water levels at the boundary. 3.4.4
Scenarios for the mud model
The “current” situation CN is always used in the reference cases for comparison, and it is combined with an unchanged tidal range (A0CN). The tidal range scenario A+ is combined with the sea level rise CH (AplusCH). The tidal range scenario A- is combined with the sea level rise CL (AminCL). More information about the scenarios is given in IMDC (2015). 3.4.5
Overview of Model Runs
Twelve model runs are devised to study the effects of C-alternatives on the mud transport. The overview of model runs is listed in Table 5.
18
WL2021R13_131_18
Final version
Integraal Plan Bovenzeeschelde - Sub report 18 – Effect of the C-alternatives on mud transport Table 5 – List of the different scenarios/alternatives runs
Discharge type
Amplitude correction
Sea level scenario
QN2013
A0
CN
QN2050
A-
CL
2050REF_C_QN_AplusCH
QN2050
A+
CH
2050C1_QN_A0CN
QN2013
A0
CN
QN2050
A-
CL
2050C1_QN_AplusCH
QN2050
A+
CH
2050C2_QN_A0CN
QN2013
A0
CN
QN2050
A-
CL
2050C2_QN_AplusCH
QN2050
A+
CH
2050C3_QN_A0CN
QN2013
A0
CN
QN2050
A-
CL
QN2050
A+
CH
Code
Year
Bathymetry (alternatives)
2050REF_C_QN_A0CN 2050REF_C_QN_AminCL
2050C1_QN_AminCL
2050C2_QN_AminCL
2050C3_QN_AminCL
2050
2050
2050
2050
2050C3_QN_AplusCH
REF_C
C1
C2
C3
(A0, A+, A-): Different tidal range scenarios. (CN, CL, CH): Sea level rise scenarios. 3.4.6
Simulation period
All the runs have a simulation period of 42 days, including a pure hydrodynamic spin up period of 2 days. For the runs 2050REF_C_QN_A0CN, 2050C1_QN_A0CN, 2050C2_QN_A0CN and 2050C3_QN_A0CN, the simulation period is from 2013/07/29 22:20:00 to 2013/09/09 22:20:00. For the rest of the runs, the 2050 future scenarios are applied, with the simulation period from 2050/08/09 22:00:00 to 2050/09/20 22:00:00.
Final version
WL2021R13_131_18
19
Integraal Plan Bovenzeeschelde - Sub report 18 – Effect of the C-alternatives on mud transport
4 Methodology of Determining the Effects 4.1 Evaluation Framework The evaluation of alternatives is based on the evaluation framework for the Integrated Plan Upper Sea Scheldt. This partial evaluation framework addresses elements of the EIA disciplines Water and Fauna & Flora. The partial framework is based on the well-established Evaluation Method for the Scheldt Estuary (EMSE) (IMDC, 2018). The EMSE is a mostly quantitative and multidisciplinary approach to evaluating the state of the estuarine system of the Scheldt. The method is divided in themes but many links and relations between those themes are included in the method. The EMSE has a hierarchical structure that also has been adopted in the evaluation framework for the current project. A difference is made between explanatory and evaluation parameters. These are grouped under indicators and themes. Note that an explanatory parameter can come back under different indicators. The different explanatory and evaluation parameters that are described in this report are indicated in green in the table below. Table 6 – Selected explanatory and evaluation parameters from the evaluation framework
Theme
Indicator
Evaluation Parameter
Water Quality Sediment and morphology
Explanatory Parameter SPM concentration
Sediment management
Maintenance dredging volumes
Sedimentation/erosion (maps) Bottom shear stress Suspended sediment fluxes
Hydrodynamics
Tidal asymmetry
The evaluation framework is applied to the B-alternatives in the Integrated Plan and described in Bi et al. (2018). The same evaluation methodology is applied to the C-alternatives, as well as to the “Current” and “Reference” situation. It is worth pointing out that, ΔSSC (see §4.4) used in this study is calculated from surface SSC and depth-averaged SSC respectively. The suspended sediment flux and its decomposed products (see §4.5) is based on cross-sectionally averaged quantities.
20
WL2021R13_131_18
Final version
Integraal Plan Bovenzeeschelde - Sub report 18 – Effect of the C-alternatives on mud transport
4.2 Polygons and transects For analysing the effects of the C-alternatives, a set of new polygons and transects are created for aggregating the results along the Scheldt Estuary. The polygons are defined together the University of Antwerp in order to fit the set-up of their ecological system model (Bi et al. 2020b). The transects used in the analysis are the shared edges between two adjacent polygons along the main channel. The new polygons for the C alternatives are based on the previous polygons used for the B alternatives. The new polygons from the North Sea to the Rupel remain the same as before, since the C alternatives only consist of new measures upstream of Rupel. Although these polygons are kept the same, their numbers can change according to the polygons added/removed/merged in the upstream. In the C-alternatives, there are 74 polygons covering the main channel from Vlissingen to the upstream boundary at Merelbeke. Although for each C alternatives, some of the polygons may have slight different shapes, the total number is always the same. Moreover, most of the transects between these polygons are kept the same as in the polygons for the B alternatives. Only few transects are changed slightly in terms of the angle to the thalweg. Therefore, numbering of polygons in the channel stays the same, and changing numbering is limited to the “dead-end” systems and the part of the North Sea. The total number of the new measures, especially the new depoldered areas, FCA-CRT areas, differ from each other in the C alternatives, therefore, the numbering of these areas, unlike the polygons for the main channels, is different in each case. The new polygons for the 2050REF_C runs are shown in Figure 20 Figure 23. The rest of the polygons used in the C1-C2-C3 alternative runs are shown in the Appendix 1 Polygons for ΔSSC calculation.
Figure 20 – Polygons for 2050_REF_C (polygons 1-13, 87-88)
Final version
WL2021R13_131_18
21
Integraal Plan Bovenzeeschelde - Sub report 18 – Effect of the C-alternatives on mud transport
Figure 21 – Polygons for 2050_REF_C (polygons 13-31, 85-86)
Figure 22 – Polygons for 2050_REF_C (polygons 32-58, 78-84)
22
WL2021R13_131_18
Final version
Integraal Plan Bovenzeeschelde - Sub report 18 – Effect of the C-alternatives on mud transport
Figure 23 – Polygons for 2050_REF_C (polygons 59-77)
In this report, the thalweg distance is defined as the distance from Merelbeke near the upstream boundary. Therefore, the polygon number (indicated with red numbers in Figure 20 - Figure 23) is converted into the distance from Merelbeke based on the thalweg defined by the dotted line in Figure 24. The centroid point in each polygon is used when measuring the distance to Merelbeke. The distance of a transect to the Merelbeke is defined in a similar way based on the thalweg in Figure 24.
Figure 24 – Map of the Scheldt estuary with main tributaries and most important locations. The thalweg is indicated with the red dotted line.
Final version
WL2021R13_131_18
23
Integraal Plan Bovenzeeschelde - Sub report 18 – Effect of the C-alternatives on mud transport
4.3 Tidal Asymmetry An important factor that could cause residual sediment transport in estuaries is tidal asymmetry. In the Western Scheldt it is a principal factor influencing the sediment exchange between the ebb tidal delta and the estuary, as well as between the various part of the estuary (Wang et al., 1999). Eulerian asymmetries (Friedrichs, 2011) are determined based on local (point) variations of velocity and water level. For better interpreting the effects found in the mud model, the tidal asymmetry based on duration of flood-period and ebb-period is calculated and used in this report: 𝑇𝑇flood 𝑇𝑇ebb
With Tebb = duration of ebb flow during the tidal cycle and Tflood = duration of flood flow during the tidal cycle. The duration of ebb and flood flow is computed based on the cross-sectionally averaged velocity at each transects along the Scheldt estuary
4.4 Delta SSC (ΔSSC) Three models that are downstream in the modelling chain (ecosystem, fish and bird model) take either surface or depth-averaged SSC as an input. The modelling chain is explained in more detail in Smolders et al. (2018). These models are termed ‘subsequent models’ further in the text. The methodology of working with Deltas as shown in Figure 25 comes down to the simple notion that we don’t pass the modelled concentrations in the different scenarios on to the subsequent models, but that we rather calculate the relative effect of a change in bathymetry and/or boundary conditions in a dimensionless measure Δ. This dimensionless measure is then used to perturb the measured data that was used in setting up a subsequent model to take into account the expected effect in change of SSC.
Figure 25 – Methodology of working with Deltas
In the ecological system (ES) model, the surface SSC changes are more relevant since it affects the light saturation in the water, hence the primary production. In this case, the surface ΔSSC is computed. For the fish model, the depth-averaged SSC becomes more important than the surface SSC. Hence, we choose to calculate both the surface delta’s and depth-averaged delta’s over the spatial extent of the boxes in the ecosystem model.
24
WL2021R13_131_18
Final version
Integraal Plan Bovenzeeschelde - Sub report 18 – Effect of the C-alternatives on mud transport
The delta of SSC at time step t is computed in each polygon (as described in §4.2) of the ecosystem model and it is defined as: ∆𝑆𝑆𝑆𝑆𝑆𝑆 (𝑡𝑡) =
𝐶𝐶𝑠𝑠𝑠𝑠𝑠𝑠 − 𝐶𝐶𝑟𝑟𝑟𝑟𝑟𝑟 𝐶𝐶𝑟𝑟𝑟𝑟𝑟𝑟
(1)
in which Csce and Cref are the area-weighted mud concentration (surface concentration or depth averaged concentration depending on the purpose) from the scenario and the reference, respectively. 𝐶𝐶𝑠𝑠𝑠𝑠𝑠𝑠 = 𝐶𝐶𝑟𝑟𝑟𝑟𝑟𝑟 =
1 � 𝑐𝑐 𝑑𝑑𝑑𝑑 𝐴𝐴 𝐴𝐴 𝑠𝑠𝑠𝑠𝑠𝑠
1 � 𝑐𝑐 𝑑𝑑𝑑𝑑 𝐴𝐴 𝐴𝐴 𝑟𝑟𝑟𝑟𝑟𝑟
(2)
(3)
where, csce and cref are mud concentration at each node in that polygon of the ecosystem model from the scenario and the reference, respectively, and dA is the nodal area. The nodal area is calculated based on the algorithm in Telemac-3D, which is used in the finite element method for spatial discretization. To be more specific, if a node is shared by n triangular elements, its nodal area can be found 𝐴𝐴𝑛𝑛𝑛𝑛𝑛𝑛𝑛𝑛𝑛𝑛
𝑛𝑛
1 = � 𝐴𝐴𝑖𝑖 3
(4)
𝑖𝑖=1
where Ai is the area of an element, and 1/3 means the area of the triangular element is equally shared by its 3 vertices. After that, the time series of ∆𝑆𝑆𝑆𝑆𝑆𝑆 in each Box of the ecosystem model is averaged out over a spring-neap cycle in order to get the overall changes of SSC across the estuary. 〈∆𝑆𝑆𝑆𝑆𝑆𝑆 〉 =
∑𝑡𝑡 ∆𝑆𝑆𝑆𝑆𝑆𝑆 (𝑡𝑡) 𝑇𝑇
(5)
in which, t is time step, T is the period of a spring-neap cycle used for temporal averaging. The percentile p25 and p75 of the box-averaged ∆𝑆𝑆𝑆𝑆𝑆𝑆 are also calculated over the averaging period, thus it can give an indication about how ∆𝑆𝑆𝑆𝑆𝑆𝑆 varying in time.
In order to get rid of the unrealistic mud concentration given by the model in the dry areas, at each time step only the wet points (with water depth > 20 cm) are used in the calculation of ΔSSC. Note that the wet points can be different at each time step and they can also be different between two runs (e.g. when a bend is shortened).
4.5 Decomposition of sediment transport and flux Sediment transport rate and sediment flux is calculated on the transects that separate the different boxes in the ecosystem model. We distinguish between sediment transport (kg/s) and sediment flux (kg/s/m²). The ratio between the two is the cross-sectional area at that particular transect. The total sediment transport (QT) is decomposed into three parts, which link to different driving mechanisms: •
Sediment transport related to discharge (QA);
Final version
WL2021R13_131_18
25
Integraal Plan Bovenzeeschelde - Sub report 18 – Effect of the C-alternatives on mud transport
•
Sediment transport due to tidal pumping (QP);
•
Residual term (QR). This term is not to be confounded with residual transport which is sometimes used to denote the net transport over a spring-neap cycle. The residual term here is simply the closing term in equation (17).
Let U be the cross-sectionally averaged along-channel velocity (positive sign means downstream and negative sign means upstream), calculated as ∫𝐴𝐴 𝑢𝑢𝑢𝑢𝑢𝑢 𝐴𝐴
(10)
𝑈𝑈 = 〈𝑈𝑈〉 + 𝑈𝑈′
(11)
𝑈𝑈 =
with u the along channel component of velocity and A the wetted cross section. U and A vary over time. U can be decomposed in a tidal average 〈𝑈𝑈〉 and a deviation from the tidal average U’. By definition, 〈𝑈𝑈′〉 = 0. A Godin filter is applied to obtain tidally-averaged quantities 〈 ∙ 〉. It is a set of cascaded running-mean filters introduced by Godin (1966), which is commonly used as a low-pass filter to remove diurnal, semidiurnal, and shorter-period components (Emery & Thomson, 2001). The filter consists of successive uses of three running averages of 24h, again 24h and 25h lengths. Similarly, the wetted cross section A changes due to varying water depth and it can also be decomposed into a tidal average 〈A〉 and a deviation from the tidal average A’.
The cross-sectionally averaged suspended sediment concentration C is derived in the same way from suspension concentration c. ∫𝐴𝐴 𝑐𝑐 𝑑𝑑𝑑𝑑 𝐴𝐴
(12)
𝐶𝐶 = 〈𝐶𝐶〉 + 𝐶𝐶′
(13)
𝑄𝑄 = 𝑈𝑈𝑈𝑈𝑈𝑈
(14)
〈𝑄𝑄〉 = 〈𝑈𝑈𝑈𝑈𝑈𝑈〉
(15)
𝐶𝐶 =
And C is decomposed into a tidal average part and its fluctuations:
The instantaneous sediment transport Q (kg/s), using cross-sectionally averaged quantities is
Note that this analysis uses cross-sectionally averaged quantities. Therefore, it is a 1D analysis for simplicity, in which variations over the cross section are omitted. It captures the more general driving mechanisms, such as advective transport due to mean flow, and transport due to tidal motion, but will not catch the more complex contributions related to vertical variations or variations over the cross section. This method will not pick up on net transport due to the spatial distribution of u and c (e.g. lock exchange flow). The tidally averaged sediment transport is
This can be written out as
〈𝑄𝑄〉 = 〈𝑈𝑈〉〈𝐶𝐶〉〈𝐴𝐴〉 + 〈𝑈𝑈〉〈𝐶𝐶′𝐴𝐴′〉 + 〈𝐶𝐶〉〈𝑈𝑈 ′ 𝐴𝐴′ 〉 + 〈𝐴𝐴〉〈𝑈𝑈′𝐶𝐶′〉 + 〈𝑈𝑈′𝐶𝐶′𝐴𝐴′〉
26
WL2021R13_131_18
(16)
Final version
Integraal Plan Bovenzeeschelde - Sub report 18 – Effect of the C-alternatives on mud transport
Following similar procedures in Scully et al. (2007), this is decomposed into advective transport, tidalpumping and a residual part. 〈𝑄𝑄〉 = 𝑄𝑄𝐴𝐴 + 𝑄𝑄𝑃𝑃 + 𝑄𝑄𝑅𝑅
(17)
𝑄𝑄𝐴𝐴 = 〈𝐶𝐶〉(〈𝑈𝑈〉〈𝐴𝐴〉 + 〈𝑈𝑈 ′ 𝐴𝐴′ 〉)
(18)
The term of advective transport consists of two parts , given as:
QA is directly scaled to the water discharge due to the fact that, the water discharge can be expressed as 〈𝑈𝑈𝑈𝑈〉 = 〈𝑈𝑈〉〈𝐴𝐴〉 + 〈𝑈𝑈′𝐴𝐴′〉. It is worth mentioning that QA could also include the influence of return flow. But generally discharge is dominant. The transport due to tidal pumping is then given as:
𝑄𝑄𝑃𝑃 = 〈𝑈𝑈′𝐶𝐶′〉 〈𝐴𝐴〉
(19)
where the primes indicate the deviations from the tidally averaged values. Burchard et al. (2018) denote this flux as “Tidal Covariance Transport” in general, and give tidal pumping as an example of this flux. The terms left from the decomposition are grouped together in a residual term QR. 𝑄𝑄𝑅𝑅 = 〈𝑈𝑈〉〈𝐶𝐶′𝐴𝐴′〉 + 〈𝑈𝑈′𝐶𝐶′𝐴𝐴′〉
(20)
QR is relatively small and negligible since the correlation between C’ and A’ is small. This way of decomposition of sediment transport enables us to more closely examine the processes driving sediment flux. In general, the sediment transport is larger in the downstream and smaller in the upstream. This is due to the differences of transect areas. In order to reveal more transport patterns, sediment transport can be divided by their transect areas, which is varying over time.
4.6 Sedimentation and erosion The sedimentation and erosion is computed from the model results for all the references and scenarios. It is expressed as the changes of bed layer thickness between the beginning and the end of the simulation. The last 40 days of the results are used in the calculation. In the following formula, B0 (m) is the bed thickness at the beginning of the last 40 days, and Bt (m) is the bed layer thickness at the end of the same period. 𝑆𝑆𝑆𝑆𝑆𝑆𝑆𝑆𝑆𝑆𝑆𝑆𝑆𝑆𝑆𝑆𝑆𝑆𝑆𝑆𝑆𝑆𝑆𝑆𝑆𝑆 = 𝐵𝐵𝑡𝑡 − 𝐵𝐵0
(6)
4.7 Bed shear stress and its exceedance time As mentioned in the evaluation framework (IMDC, 2018) for the model scenarios, changes in bottom shear stress lead to changes in sedimentation/erosion patterns and habitat suitability. Therefore maps are made in the study area of maximum occurring bottom shear stress during a spring-neap cycle, and exceedance time of a threshold value of 1 Pa. For getting the maximum bed shear stress, it is worth mentioning that, in the mud model, a uniform and constant bottom friction is used separately while computing the bed shear stress for sediment transport, and this bed stress is not exported in the model results. Therefore, the same computation is done again during
Final version
WL2021R13_131_18
27
Integraal Plan Bovenzeeschelde - Sub report 18 – Effect of the C-alternatives on mud transport
post-processing, using the velocity and water depth at each node for every time step, using the quadratic friction law: 1 𝜏𝜏𝑏𝑏 = 𝜌𝜌𝑤𝑤 𝐶𝐶𝐷𝐷 𝑈𝑈�𝑈𝑈� 2 𝐶𝐶𝐷𝐷 = 2𝑛𝑛2
𝑔𝑔
ℎ1/3
(8) (9)
where, τb is bed shear stress, CD is drag coefficient, 𝑈𝑈 is the depth-averaged velocity (which is also calculated in SEDI-3D), n is the Manning coefficient (0.02 in the mud model), g is gravitational constant and h is the water depth. Then the maximum value at each node is recorded during a spring-neap cycle. The exceedance time of bed shear stress > 1Pa is computed at each node based on the above bed shear stress as well. The exceedance time is presented as a ratio (%) between the number of time steps at which the bed shear stress exceeds 1Pa, and the total number of time steps.
28
WL2021R13_131_18
Final version
Integraal Plan Bovenzeeschelde - Sub report 18 – Effect of the C-alternatives on mud transport
5 Results 5.1 2050C1 5.1.1
SSC and ΔSSC
The modelled suspended sediment concentration (SSC) is aggregated in the polygons, which are presented in §4.2. The time-averaged aggregated surface SSC and depth-average SSC along the Scheldt estuary are shown in Figure 27. As can be seen, in the 2050C1 alternative runs, both surface and depth-averaged SSC are slightly lower compared to the results in the reference cases. Although the horizontal variations of SSC are slightly different under different scenarios (i.e. A0CN, AminCL and AplusCH), the general patterns are similar. In the 2050C1 runs, three zones with noticeable reductions of depth-averaged SSC can be identified, which are the zones km 50-80, km 35-45 and km 15-20. For the surface SSC, the reduction of SSC can be found in the same zones. In these zones, the following measures are implemented and the overview of the locations can be found in Figure 26: • • • • •
Undeepening of the channel from Temse to Ruple (km 58-64) New connection with Durme plus depoldering (km 55) Blankaart activated as FCA (km 49) Channel straightening and development of intertidal nature at Kramp (km 40) Bend cutoff plus adding intertidal nature at Wijmeers and Uitbergen (km 16-19)
These measures have noticeable impacts to the sediment transport, whereas the others have negligible influences.
Figure 26 – Bathymetry differences between 2050C1 and 2050REF_C in the Upper Sea Scheldt
Notice that around km 18 and km 40, the reductions in the surface SSC are local. This indicates that hydrodynamics is affected by the local measures, resulting in changes of suspension capacity at these two locations. On the other hand, in the zone km 50-80, the reduction of SSC has similar amount in both depth-averaged SSC and surface SSC. This could suggest that the reduction of SSC in this region is less subjected to the local measures. Instead, it could be due to the fact that certain amount of sediment is lost in upsteam area (e.g. around km 55) and less is available for being transported in water. In this case, the measure acting as sediment trap could have global effects on the sediment transport.
Final version
WL2021R13_131_18
29
Integraal Plan Bovenzeeschelde - Sub report 18 – Effect of the C-alternatives on mud transport
Figure 27 – Time-averaged surface SSC and depth-average SSC in 2050C1
It is worth pointing out that in all the cases in Figure 27, a drop of SSC can be seen near the upstream boundary within km 0-5 in both reference runs and 2050C1 runs. In this area, an no-sedimentation zone is implemented, hence the decrease of SSC is not due to deposition but the changes in hydrodynamics. Closer examination shows that, sediment accumulates in the lock due to the local circulation, a high concentration zone is thus formed with SSC fluctuating between 0.2 g/L and 0.3 g/L. The tidal movement in this ebbdominant area also creates a low concentration zone, which moves back and forth periodically (Figure 28). Sediment still can be transported downstream as a result of advection and diffusion.
30
WL2021R13_131_18
Final version
Integraal Plan Bovenzeeschelde - Sub report 18 – Effect of the C-alternatives on mud transport
Q
Figure 28 – Depth-averaged sediment concentration in the upstream zone km 0-5 at a certain time step
The effect of C1 alternative on the SSC (ΔSSC) is also computed and shown in Figure 29 for three scenarios. As expected, the effect of C1 is not significant. As can be seen in Figure 27, the differences in km 0-20 and km 40-50 are negligible, so we only focus on the main effects as observed in the zones mentioned above, i.e. km 50-80, km 35-45 and km 15-20. For the main effects, they are consistent under the three scenarios. The main trend observed in Figure 29 is the reduction of SSC in the Upper Sea Scheldt (most clearly for AplusCH) with minor fluctuations in between, and the reduction also extends downstream until Km 130 from Merelbeke.
Figure 29 – Time-averaged depth-averaged ΔSSC (2050C1)
Final version
WL2021R13_131_18
31
Integraal Plan Bovenzeeschelde - Sub report 18 – Effect of the C-alternatives on mud transport
As briefly discussed before, there are three regions with significant changes, in all of which the reduction of SSC can be observed. The first region is from Km 15 to Km 20, where the channel cut-off at Hoogland - Uitbergen is carried out and the new intertidal area is created. The Bergenmeersen FCA-CRT area in this region is completely depoldered. Because of these measures, the wet section area is increased and the mean velocity is decreased (Figure 30), hence, the suspension capacity is also decreased. But the effect is confined in this area, indicating that this is indeed caused by the local measures. The second region with the reduction of SSC is from Km 35 to Km 45. The most important measures are the bend cut-off plus intertidal nature development at Km 40 (Kramp). Again from Figure 27 we can see that the effect in this area is also local and can be linked to the measures at Kramp. Velocity differences (Figure 30) shows that the mean velocities during both ebb and flood are decreased significantly due to the increase of the wet section area, therefore, suspension capacity also drops, resulting in a decrease of ΔSSC.
Figure 30 – Cross-sectionally averaged velocity bias during ebb and flood (2050C1). Negative values correspond to a velocity reduction
The third region with the reduction of SSC is from Km 50 to km 80, and the effect extends further downstream although the amount of reduction is negligible as seen in Figure 27. At Km 55, the new connection with Durme is implemented plus the creation of intertidal area. This new measure tends to decrease the SSC by trapping sediment in the intertidal area, causing additional sedimentation (Figure 34). Because the Upper Sea Scheldt is ebb dominant, the sedimentation at this location reduces sediment input for the downstream, hence, the
32
WL2021R13_131_18
Final version
Integraal Plan Bovenzeeschelde - Sub report 18 – Effect of the C-alternatives on mud transport
effect is more prominent towards downstream. Another reason for the decrease of ΔSSC downstream of km 65 is the smaller bed shear stress (Figure 31), which reduces resuspension. Sedimentation is not increased in km 65-80, suggesting that the reduction of resuspension is the main cause for the effect.
Figure 31 – The effect of C1 on the exceedance rate of bed shear stress > 1 Pa in the Upper Sea Scheldt from km 23-65 (A0CN)
Figure 32 – Comparison of depth-averaged and surface ΔSSC (2050C1_A0CN)
Final version
WL2021R13_131_18
33
Integraal Plan Bovenzeeschelde - Sub report 18 – Effect of the C-alternatives on mud transport
The surface ΔSSC is compared to the depth-averaged ΔSSC in Figure 32. Overall, the surface ΔSSC and depthaveraged ΔSSC show a similar trend under all the scenarios (A0CN, AminCL and AplusCH), except that at some locations the surface ΔSSC appears to be more sensitive to the local measures. An example can be seen in Figure 32. The surface ΔSSC noticeably deviates from the depth-averaged ΔSSC at locations around Km 9 (bend modifications plus intertidal nature at Voorde), km 19, km 40 and km 58-64 (undeepening of the main channel). This is because those measures significantly affect the hydrodynamics locally (Figure 30), which could also alter the vertical profiles of SSC, leading to larger deviations in the surface SSC than in the depthaveraged SSC. An example can be found in Figure 33, in which series of vertical SSC profiles over a period of 15 days are extracted at a point in the main channel at km 19 for both 2050REF_C_A0CN and 2050C1_A0CN runs. The vertical profiles are then averaged over the period for each run and compared. Due to the decrease of mean velocity at this location (Figure 30), less sediment is kept in suspension in 2050C1_A0CN and the vertical profiles are also changes. It can be seen that the surface SSC reduces by 30%, while the depthaveraged SSC only reduces by 9% in 2050C1_A0CN.
Figure 33 – Time-averaged vertical profiles of SSC at km 19 in the main channel in 2050REF_C_A0CN and 2050C1_A0CN
The above example only accounts for one point in this zone. The illustrated deviations between surface SSC and depth-averaged SSC appear in the calculation of ΔSSC when considering the other points in this area. 5.1.2
Sedimentation plots
The effect of the C1 alternative on sedimentation and erosion after 40 days compared with 2050REF_C can be seen in Figure 34 and Figure 35, in which the positive bed changes (more sedimentation or less erosion) are indicated in red and negative bed (erosion) changes are indicated in blue. Note that the bed changes shown here are under the A0CN scenario, but it also resembles the bed changes under AminCL and AplusCH since they all show very similar patterns.
34
WL2021R13_131_18
Final version
Integraal Plan Bovenzeeschelde - Sub report 18 – Effect of the C-alternatives on mud transport
Figure 34 – Effect of C1 on sedimentation and erosion (m) after 40 days from Km24-65 (A0CN)
Figure 35 – Effect of C1 on sedimentation and erosion after 40 days from Km1-23 (A0CN)
As seen in the Figure 27, the changes in SSC are generally small in C1, therefore it is reasonable to also have small influence on sedimentation/erosion in the main channel. The most noticeable bed changes are found at about Km 55, where the new connection with Durme is implemented and extra intertidal zone is created. Sediment deposits more in the shallow area as expected. This could be one of the reasons SSC also drops in this region (Figure 34). From Km 58 to Km 64, less sediment is deposited in the main channel. This is due to the fact that the velocity becomes stronger after channel alternation. Because the mean water level increases, less sedimentation can occur on the banks. The larger velocity leads to higher bed shear stress as shown in Figure 31. Moreover, the depoldering at km 12-13, and the channel alternations at Km 19, Km 31, Km 38 and Km 40 also lead to local sedimentation and erosion patterns. There are also sedimentation/erosion occurring at the inlets/outlets of FCA-CRTs, e.g. at Km 49, Km 46 and Km 28, which are likely to be the local artefacts related to the way of modelling those structures.
Final version
WL2021R13_131_18
35
Integraal Plan Bovenzeeschelde - Sub report 18 – Effect of the C-alternatives on mud transport
5.2 2050C2 5.2.1
SSC and ΔSSC
In the 2050C2 runs, the modelled surface SSC and depth-averaged SSC under three scenarios (A0CN, AminCL and AplusCH) are computed and aggregated in the polygons defined in §4.2. The variation of SSC is presented in Figure 36. The effect of the C2 alternative has a large impact to the mud transport, and the effects are very similar under the three different scenarios, which is also confirmed by Figure 38. The main trend observed in Figure 36 is reduction of SSC in both the surface and the depth-averaged signals. Two regions can be identified based on the changes in SSC. The first region is roughly from km 5 to km 90, in which significant effects can be found; the second one is from km 100-160, in which only minor changes are presented. Since no new measures are implemented in the second region, this part of the domain is affected by the superimposed effects of the measures in the Upper Sea Scheldt. Here we focus the discussion on the first region, where all the measures are implemented. It is worth pointing out that all these measures are implemented at the same time in the model and their effects could be entangled, thus it is not possible to separate the effects of individual measures from each other. Moreover, even at the same location, different types of measures can present at the same time, e.g. bend cut-off plus creation of intertidal area at km 16-20 and km 40. Therefore, detailed evaluation of each measures are very difficult.
36
WL2021R13_131_18
Final version
Integraal Plan Bovenzeeschelde - Sub report 18 – Effect of the C-alternatives on mud transport
Figure 36 – Time-averaged surface SSC and depth-average SSC in 2050C2
Final version
WL2021R13_131_18
37
Integraal Plan Bovenzeeschelde - Sub report 18 – Effect of the C-alternatives on mud transport
Figure 37 give an overview of the bathymetry changes between the 2050C2 and 2050REF_C, as an indication for the locations of the new measures. As discussed in 5.1.1, due to the local hydrodynamic conditions near the upstream boundary, both surface and depth-averaged SSCs show a drop from km 0 to km 5. In the C2 alternative, the decrease of SSC near the upstream boundary is even enhanced due to additional measures at Km 4.8 (channel widening and removing of the dyke at Veerhoek) and at km 5.5 (the extra excavation of area at Melleham combined with CRT function).
Figure 37 – Bathymetry differences between 2050C2 and 2050REF_C in the Upper Sea Scheldt
Figure 38 – Time-averaged depth-averaged ΔSSC (2050C2)
The effect of C2 alternative on the depth-averaged SSC (depth-averaged ΔSSC) is shown in Figure 38. In general, as also confirmed in Figure 36, reduction of SSC (up to 50% reduction) is the dominant trend found in the entire Upper Sea Scheldt, with an exception near the upstream boundary which is due to local hydrodynamic conditions (see also section 5.1.1). The trend of reduction of SSC extends downstream to km 100-160, although there is no new measures in that region. It is also interesting to see the C2 alternative shows consistent effect on SSC across different scenarios (A0CN, AminCL and AplusCH), with only small deviations from each other.
38
WL2021R13_131_18
Final version
Integraal Plan Bovenzeeschelde - Sub report 18 – Effect of the C-alternatives on mud transport
Figure 39 – Effect of 2050C2 on tidal asymmetry Tflood/Tebb. Positive means more flood dominant (or less ebb dominant)
The increase of SSC in the section from Km 0 to Km 3 is most likely caused by the change of tidal asymmetry. As shown in Figure 39, the duration asymmetry Tflood/Tebb indicates that the system becomes more ebb dominant at Km 2.5. This could be the main reason for the increase of SSC since the system has the tendency of accumulating sediment around this location. Away from the upstream boundary, the SSC starts to decrease. The influence from the changes of tidal asymmetry becomes secondary. The new measures in C2 alternative start to play a more important role by bringing larger impacts to the system. The main measures that could affect SSC in the region from Km 5 to Km 65 are (additional measures compared to C1 are highlighted in bold, measures different variations compared to C1 are indicated with underline): • • • • • • • • • • • •
The development of new intertidal area with Veerhoek dikes more inland at Km 4.8; The extra excavation of area at Melleham combined with CRT function at Km 5.5; The development of new intertidal area with Bommels dikes more inland at Km 6.5; The development of new intertidal area at Km 9, where the Nautical bottleneck Voorde is resolved; New depoldered area at Kastenmeersen at Km 12.5; Channel alternative and creation of new intertidal area at Hoogland – Uitbergen - Paardenweide at Km 16-20; Combined measures including depoldering area, creation of side channels and converting FCA to FCA-CRT in the region Oude Broekmeer - Scheldebroek – Sint-Onolfspolder at Km 24-29; The new depoldered areas at Grembergen Broek and Armenput, and the new depoldered area of Roggeman with dykes more south from Km 35 to Km 39; Channel alternative and creation of new intertidal area at Kramp at Km 40; Depoldering Blankaart at Km 49; New connection with Durme at Km 55 combined with depoldering southern section of FCA-CRT area Tielrodebroek; Creation of side channels in Schouselbroek and Schelland/Oudbroekpolder, combined with activation of FCA-CRT areas in Spierbroekpolder and Hingene Broekpolder at Km 59-64.
Around km 5, the reduction of SSC is due to the new measures at Veerhoek, Melleham and Bommels. Because the main channel is ebb dominant, this also reduces sediment input to the rest of the Upper Sea Scheldt.
Final version
WL2021R13_131_18
39
Integraal Plan Bovenzeeschelde - Sub report 18 – Effect of the C-alternatives on mud transport
Further downstream the major reduction of SSC is closely linked to the lateral depoldering. This can be explained by the sediment deposition in the shallow areas. Notice that the measures in the zones km 24-29, km 35-39 and km 49 are the additional measures added in C2 compared to C1, thus, they could be responsible for the much larger impact seen in C2 alternative between km 20 and km 60. It is also interesting to see that the effect on SSC becomes less at km 60 and km 95. The first SSC recovery could be caused by the channel undeepening in Temse-Ruple (km 57-64), which leads to higher velocity and higher suspension capacity; the second one is due to the point source placed in the model for sediment dumping around km 90.
Figure 40 – Comparison of depth-averaged and surface ΔSSC (2050C2_A0CN)
For the C2 alternative, the surface ΔSSC is also compared with the depth-averaged ΔSSC in Figure 40. Overall, the surface ΔSSC follows the same trend as the depth-averaged ΔSSC, especially from Km 30 and further downstream. The deviations are mainly in the region Km 0-30 and around km 40. This may suggest that the measures such as the channel widening and dyke removal at Veerhoek at Km 4.8, bend straightening at Wijmeers and Uitbergen in km 16-20, depoldering and side channel concentration at Oude Broekmeer starting at km 25, and channel straightening plus intertidal area creation at Kramp at km 40 could significantly affect the local hydrodynamic conditions, while the other measures, especially large lateral depoldering, e.g. depoldering Grembergen Broek and Armenput (km 35-39), depoldering Blankaart (km 49), and depoldering with side channel construction from Temse to Rulpe (km 59-64) have less impact to local hydrodynamics but can affect larger-scale mud transport by trapping more sediment. 5.2.2
Sedimentation plots
The effect of C2 alternative on sedimentation and erosion after 40 days compared with 2050REF_C can be seen in Figure 41 and Figure 42. The positive bed changes (sedimentation) are indicated in red and negative bed changes (erosion) are indicated in blue. Again, the effects of C2 under the different scenarios (A0CN, AminCL and AplusCH) are consistent.
40
WL2021R13_131_18
Final version
Integraal Plan Bovenzeeschelde - Sub report 18 – Effect of the C-alternatives on mud transport
Figure 41 – Effect of C2 on sedimentation and erosion (m) after 40 days from Km24-65 (A0CN)
Figure 42 – Effect of C2 on sedimentation and erosion (m) after 40 days from Km1-23 (A0CN)
Comparing to the effect of C1, more sedimentation is found in the additional depoldered areas and FCA/FCA-CRTs in C2 scenario. This is due to the fact that sediment is transported by flow in those shallow areas and deposited there. The water motion going from the shallow area to the main channel is not strong enough to erode sediment and transport it back. In the main channel from Km 40 to Km 65, more erosion/less sedimentation happens especially near the banks. This is consistent with the pattern seen in Figure 43, in which the bed shear stress in general becomes larger in the main channel especially near the banks. This is because the mean water level increases in this zone, the previous dry areas near the banks are now subjected to the flow and less prone to sedimentation. Moreover, the decrease of SSC in the main channel is also one of the reasons for that.
Final version
WL2021R13_131_18
41
Integraal Plan Bovenzeeschelde - Sub report 18 – Effect of the C-alternatives on mud transport
From Km 4 to Km 20, slightly larger sedimentation along the channel can be observed in the C2 alternative (Figure 42). The main reason is that the mean velocity becomes smaller as shown in Figure 44, hence less sediment is kept in suspension and SSC decreases. 5.2.3
Explanatory parameters: bed shear stress and velocity magnitude
Figure 43 – The effect of C2 on the exceedance rate of bed shear stress > 1 Pa in the Upper Sea Scheldt from km 23-65 (A0CN)
Figure 44 – The effect of C2 on the frequency of velocity magnitude > 0.65 m/s in the Upper Sea Scheldt from km 1-23 (A0CN)
42
WL2021R13_131_18
Final version
Integraal Plan Bovenzeeschelde - Sub report 18 – Effect of the C-alternatives on mud transport
5.3 2050C3 5.3.1
SSC and ΔSSC
The modelled surface SSC and depth-averaged SSC in 2050C3 runs under three scenarios (A0CN, AminCL and AplusCH) are computed and the results are aggregated in the polygons defined in §4.2. The horizontal variations of aggregated SSCs in the C3 alternatives are presented in Figure 45.
Figure 45 – Time-averaged surface SSC and depth-average SSC in 2050C3
Final version
WL2021R13_131_18
43
Integraal Plan Bovenzeeschelde - Sub report 18 – Effect of the C-alternatives on mud transport
As seen in Figure 45, the C3 alternative shows similar effects on the SSC under different scenarios, which is also confirmed by the ΔSSC result in Figure 47. The influences of the new measures now extend to almost the entire estuary, although the largest reduction in SSC is found in the Upper Sea Scheldt.
Figure 46 – Bathymetry differences between 2050C3 and 2050REF_C in the Upper Sea Scheldt
The reduction of SSC in the Upper Sea Scheldt from Km 5 to Km 65 could be caused by the superimposed effects from the following measures and their locations are shown in Figure 46 (additional measures compared to C2 are highlighted in bold, measures with different variations are indicated with underline): • • • • • • • • • • • • • • •
The development of new intertidal area with Veerhoek dikes more inland at Km 4.8; The extra excavation of area at Melleham combined with CRT function at Km 5.5; The development of new intertidal area with Bommels dikes more inland at Km 6.5; The development of new intertidal area at Km 9, where the Nautical bottleneck Voorde is resolved; New depoldered area at Kastenmeersen at Km 12.5; Channel alternative and creation of new intertidal area at Hoogland – Uitbergen - Paardenweide at Km 16-20; Bend cut off and depoldering area at Paardenweide from Km 20 to Km 22; Combined measures including depoldering area, creation of side channels and converting FCA to FCACRT in the region Oude Broekmeer - Scheldebroek – Sint-Onolfspolder at Km 25-29; The new depoldered areas at Grembergen Broek and Armenput, and the new depoldered area of Roggeman with dykes more south from Km 35 to Km 39; Channel alternative and creation of new intertidal area at Kramp at Km 40; Depoldering Blankaart and Akkershoofd at Km 48-49; New connection with Durme at Km 55 combined with depoldering southern section of FCA-CRT area Tielrodebroek; New depoldered areas at Weert from Km 51 to Km 57; Channel undeepening and narrowing from Temse to Ruple from km 57 to km 64; Creation of side channels in Schouselbroek and Schelland/Oudbroekpolder, combined with activation of FCA-CRT areas in Spierbroekpolder and Hingene Broekpolder at Km 59-64.
The effect of C3 alternative on the SSC (ΔSSC) is shown in Figure 47. Comparing to the effects of C1 and C2 (Figure 29 and Figure 38), C3 alternative has the largest influence (up to 70% reduction) on the SSC in the Upper Sea Scheldt. This is consistent with the fact that the extra depoldered areas and FCA/FCA-CRTs defined in the C3 alternative are also the largest among the three C alternatives.
44
WL2021R13_131_18
Final version
Integraal Plan Bovenzeeschelde - Sub report 18 – Effect of the C-alternatives on mud transport
Figure 47 – Time-averaged depth-averaged ΔSSC (2050C3)
As seen in Figure 47, the time-averaged depth-averaged ΔSSC shows that the reduction of SSC is the main trend in the Upper Sea Scheldt and the impact of the measures extends further downstream almost until the estuary mouth. The effect of C3 under different scenarios are consistent, demonstrating that the effect of C3 found in the model is robust. Similarly as in the C2 alternative, a small area with positive ΔSSC is observed from Km 0 to Km 5 near the upstream boundary due to the horizontal changes in tidal asymmetry. Away from the upstream boundary, the SSC decreases, with the largest reduction at around Km 40-45. Because the Upper Sea Scheldt is ebbdominant, the changes of sediment input due to the measures in the upstream will also affect the SSC further downstream, and the influences can be accumulated. Again, it is worth pointing out that the same point source as found in the reference model is placed at km 95, therefore, the effect ΔSSC tends to zero at this location. Downstream of km 95, the decrease of SSC can be explained by the fact that in C3, more sediment from the disposal location is transported upstream (see Figure 60). Since the sediment amount that is disposed stays the same in all simulations, this means that less sediment is available for transport downstream from the disposal location. Since this would mean a reduction in maintenance dredging in the access channels and DGD, also the sediment disposal would decrease in reality (reduced return flow). This means that the decrease of sedimentation downstream of the disposal location is an artefact in this model, and should be studied with a model with an active dredging and disposal module.
Final version
WL2021R13_131_18
45
Integraal Plan Bovenzeeschelde - Sub report 18 – Effect of the C-alternatives on mud transport
Figure 48 – Comparison of depth-averaged and surface ΔSSC (2050C3_A0CN)
The surface ΔSSC is computed for the use in the ecosystem model, and compared with the depth-averaged ΔSSC. An example of the comparison is shown in Figure 48 under the scenario A0CN. It can be seen that the surface ΔSSC and the depth-averaged ΔSSC follow a similar trend, except that the surface ΔSSC is lower and more sensitive to the local measures especially from Km 0 to Km 30. As seen above, depoldering at Kastenmeersen (Km 12.5), channel alternation and creation of new intertidal area at Hoogland - Uitbergen - Paardenweide (Km 16-20), depoldering and side channel construction at Oude Broekmeer (km 24-27) and bend straightening at Kramp (km 40) have a large impact to the surface ΔSSC. 5.3.2
Sedimentation plots
The effect of the C3 alternative on the sedimentation/erosion is shown in Figure 49 and Figure 50. Compared with the effect of C2, more sedimentation patterns can be found in the shallow areas in the Upper Sea Scheldt. This is because more extra depoldered areas and FCA/FCA-CRTs are implemented in the Upper Sea Scheldt in the C3. It is also observed that less sedimentation is found in the navigation channel in the region from Km 35 to Km 65. This is due to the fact that more sediment deposits in the shallow areas in this region, so that less is available for being transported in the main channel by the flow. The SSC decreases and the sedimentation rates also becomes smaller.
46
WL2021R13_131_18
Final version
Integraal Plan Bovenzeeschelde - Sub report 18 – Effect of the C-alternatives on mud transport
Figure 49 – Effect of C3 on sedimentation and erosion (m) after 40 days from Km24-65 (A0CN)
Figure 50 – Effect of C3 on sedimentation and erosion (m) after 40 days from Km1-23 (A0CN)
From Km 4 to Km 23, more sedimentation can be seen in the navigation channel (Figure 50). This can be explained by the change of mean velocity as shown in Figure 51, in which the mean velocity becomes smaller, so that the suspension capacity also decreases. This is also part of the reason for the reduction of SSC in this region. Similar to what is observed in C2 alternative, slightly stronger erosion and deposition happens near the upstream boundary and the entrance to the Gentbrugge. This can only be explained by the changes of tidal asymmetry caused by the measures downstream.
Final version
WL2021R13_131_18
47
Integraal Plan Bovenzeeschelde - Sub report 18 – Effect of the C-alternatives on mud transport
5.3.3
Explanatory parameter: velocity magnitude
Figure 51 – The effect of C3 on the frequency of velocity magnitude > 0.65 m/s in the Upper Sea Scheldt from km 1-23 (A0CN)
48
WL2021R13_131_18
Final version
Integraal Plan Bovenzeeschelde - Sub report 18 – Effect of the C-alternatives on mud transport
5.4 Long term sinks We use the methodology from Vandenbruwaene et al. (2015) to estimate the long term evolution of the sedimentation in the depoldered areas and FCA-CRTs. The details are given in Bi et al. (2021). The mass changes per year in the depoldered areas and FCA-CRTs are shown below in TDM/yr. The expected bottom elevation after 50 years for each measure are also calculated and shown in Appendix 2 Bottom evolution in FCA-CRTs and depoldering areas over 50 years. Since the expected sedimentation rate in FCA’s is small (water and sediment only enters during storm conditions) we only focus on depoldered areas and FCA-CRTs. The main conclusions are summarised below. 5.4.1
FCA-CRT
The sedimentation rates in all the FCA-CRT’s under different scenarios in 2050REF_C and C alternative are shown in Figure 52.
2050REF_C AminCL
AplusCH
A0CN
12000
12000
10000
10000
8000
8000
TDM/yr
TDM/yr
A0CN
2050C1
6000 4000
4000 2000
0
0
2050C2
2050C3 AplusCH
A0CN
12000
12000
10000
10000
8000
8000
6000 4000
TDM/yr
TDM/yr
AminCL
AplusCH
6000
2000
A0CN
AminCL
AminCL
AplusCH
6000 4000
2000
2000
0
0
Figure 52 – Sedimentation rate in FCA-CRTs expressed in TDM/yr (upper left: 2050REF_C, upper right: 2050C1, lower left:2050C2, lower right:2050C3)
Final version
WL2021R13_131_18
49
Integraal Plan Bovenzeeschelde - Sub report 18 – Effect of the C-alternatives on mud transport
It can be seen that the sedimentation rate in general decreases from 2050C1 to 2050C3. This is because the mean water level becomes lower from 2050C1 to 2050C3, hence, less water enters the FCA-CRTs, resulting in less sedimentation. Also, the SPM signal becomes lower due to the additional measures from 2050 C1 to 2050C3, as is discussed in §5.1 - §5.3. The sedimentation rate is highest under AplusCH, and lowest under AminCL. This is closely related to the water level and SPM differences associated with each scenario. Generally speaking, the highest water level is found in AplusCH under the combined effects of sea level rise and increased tidal amplitude. The water level in A0CN and AminCL have less differences. For many locations, AminCL often has even lower water level because of the combined effect of decrease of tidal amplitude (-40cm) and the influence of sea level rise (+15cm). 5.4.2
Depoldered areas
The average yearly siltation for the different depoldered areas under different scenarios (A0CN, AminCL and AplusCH) can be found in Figure 53 - Figure 56.
2050REF_C 60000,00 50000,00
TDM/yr
40000,00 A0CN
30000,00
AminCL
20000,00
AplusCH
10000,00 0,00
GROOT SCHOOR
UITERDIJK
WIJMEERS DEEL2
Figure 53 – Sedimentation rate expressed in TDM/yr in depoldered areas (2050REF_C)
2050C1 60000,00
TDM/yr
50000,00 40000,00 30000,00
A0CN
20000,00
AminCL
10000,00
AplusCH
0,00
Figure 54 – Sedimentation rate expressed in TDM/yr in depoldered areas (2050C1)
50
WL2021R13_131_18
Final version
Integraal Plan Bovenzeeschelde - Sub report 18 – Effect of the C-alternatives on mud transport
2050C2 60000,00
TDM/yr
50000,00 40000,00 30000,00 20000,00
A0CN
10000,00
AminCL AplusCH
0,00
Figure 55 – Sedimentation rate expressed in TDM/yr in depoldered areas (2050C2)
2050C3 60000,00 TDM/yr
50000,00 40000,00 30000,00 20000,00
A0CN Veerhoek
Melleham
Bommels
Kastenmeersen
Wijmeers Deel 2
Bergenmeersen
Paardeweide
Oude Broekmeer
Sint-Onolfspolde
Grembergen Broek
Armenput
Roggeman
AminCL Uiterdijk
Weert 1
Tielrode
Weert 2
Groot Schoor
Schouselbroek
Schellandpolder
0,00
Blankaart-…
10000,00
AplusCH
Figure 56 – Sedimentation rate expressed in TDM/yr in depoldered areas (2050C3)
For the depoldered areas, especially in C2 and C3 alternatives, the sedimentation is much larger compared to the sedimentation in FCA-CRTs. For most of the depoldered areas, the bottom elevation is always below the MHW at neap tide. Depending on the difference between the initial platform elevation and the local MHW, the initial sedimentation can be large if the difference is large, but the sedimentation rate will eventually converge to a steady pace, which is usually much lower that the initial sedimentation rate. The sedimentation rate is larger under the faster sea level rise scenario (AplusCH), and lower under the slower sea level rise scenario (AminCL). Comparing the results in C alternatives, for the same measure under the same scenario, we can see that the 2050C3 has the lowest sedimentation rate because the MHW is the lowest among the three C alternatives, and also the SPM signal is lowest.
Final version
WL2021R13_131_18
51
Integraal Plan Bovenzeeschelde - Sub report 18 – Effect of the C-alternatives on mud transport
5.4.3
Total Sediment Balance
For each C alternative, the yearly averaged sedimentation rate (expressed in tons of dry matter per year) from each measure is summed up and shown in Figure 57. The total depoldering area is also calculated and given in the same figure.
300 000
30 000 000
250 000
25 000 000
200 000
20 000 000
150 000
15 000 000
100 000
10 000 000
50 000
5 000 000
0
Depoldering area (m2)
TDM (Ton)
Yearly-averaged sedimentation
0
Depoldering
FCA-CRT
Depoldering area
Figure 57 – The estimated yearly sedimentation averaged over 50 years
Comparing to the average yearly sediment load coming into the Scheldt catchment (including Upper Scheldt, Lower Scheldt, and all the tributaries), which is in the range 236,000 - 287,000 TDM/yr according to the monitoring data (Van Hoestenberghe et al. 2014), the yearly sedimentation estimated in the FCA-CRTs and depoldered areas are not negligible. Especially in 2050C2 and 2050C3 with much larger depoldering areas, the yearly sedimentation takes up a major portion of the measured sediment input for the whole catchment (Figure 57). This is important in an ebb-dominant system like the Upper Sea Scheldt, because the main part of the sediment input upstream will be deposited in these sediment sinks, and only a small amount will be available for advective transport downstream. This sedimentation is consistent with the decrease in SSC that is found in the alternatives.
52
WL2021R13_131_18
Final version
Integraal Plan Bovenzeeschelde - Sub report 18 – Effect of the C-alternatives on mud transport
6 Discussion and conclusion 6.1 Discussion The effects of the three C alternatives on SSC are shown in Figure 58 (in absolute values) and Figure 59 (relative to the reference as ΔSSC). Because the effect on SSC is only slightly different under the different scenarios (A0CN, AminCL and AplusCH), we only focus on the A0CN scenario in this section. The detailed results for each scenario are discussed in chapter 5. The C1 alternative has the lowest impact to the SSC in the Upper Sea Scheldt, while C2 and C3 show a much larger influence in the Sea Scheldt (km 0-100). This can be mainly attributed to the larger area of (relatively low-lying) depoldered area that is added to the system in C2 and C3 (see Figure 57). The Upper Sea Scheldt is ebb dominant, so the sediment supply is mainly the upstream sediment discharge. The depoldered areas and FCA/FCA-CRTs that are added in C2 and C3 act as sediment sinks (see the discussion in section 5.4). In an ebb dominant system, this leaves less sediment available for transport downstream, which explains a large part of the reduction in SSC in the Sea Scheldt.
Figure 58 – Time-averaged depth-averaged SSC along the Scheldt estuary (A0CN)
Final version
WL2021R13_131_18
53
Integraal Plan Bovenzeeschelde - Sub report 18 – Effect of the C-alternatives on mud transport
Figure 59 – The time-averaged depth-averaged ΔSSC of C alternatives (A0CN)
The sediment transport is decomposed according to the method outlined in §4.5 for a better understanding of the effect of C alternatives. Figure 60 shows the comparison of the averaged total sediment transport (a positive value means downstream transport and a negative value upstream transport) between the reference case and the C alternatives. The peak at about Km 85 is caused by the sediment source placed in that region that approximates the disposal of maintenance dredging (mud) in the Sea Scheldt. It can be seen that C1 indeed has the smallest impact to the system since the total sediment transport does not differ significantly from the reference case (see Figure 60). With the C2 alternative, the downstream total transport decreases from Km 18 and the trend continues until Km 60. In some regions, e.g. Km 61-66 and Km 72-82, the total transport becomes negative, meaning that the sediment is transported upstream due to the new measures. This will locally increase SSC by transporting sediment from the ETM/disposal location upstream. In the C3 alternative, a similar behaviour of total transport can be observed. The total downstream transport is reduced from upstream until Km 50. Further downstream, the total transport reverses its direction and more sediment is transported upstream. Due to more measures implemented in C3, especially the extra depoldered area at Weert, the transition from downstream transport to upstream transport occurs more upstream. This will locally increase SSC by transporting sediment from the ETM/disposal location upstream.
54
WL2021R13_131_18
Final version
Integraal Plan Bovenzeeschelde - Sub report 18 – Effect of the C-alternatives on mud transport
Figure 60 – Averaged total sediment transport (A0CN) (positive means downstream transport and negative means upstream transport)
Figure 61 – Averaged sediment transport due to advection (A0CN) (positive means downstream transport and negative means upstream transport)
Figure 61 shows the comparison of the sediment transport due to advection (see section 4.5 for the decomposition method). It can be seen that the effect of C1 is still the smallest among the three. The downstream advective transport in the C2 and C3 alternatives becomes smaller in most of the Upper Sea Scheldt. The C3 alternative has the largest reduction of the downstream advective transport compared to the C1 and C2 alternatives. This is due to more sediment trapping in the FCA-CRT’s and the depoldered areas. and lower sediment concentration in water column.
Final version
WL2021R13_131_18
55
Integraal Plan Bovenzeeschelde - Sub report 18 – Effect of the C-alternatives on mud transport
Figure 62 – Averaged sediment transport due to tidal pumping (A0CN) (positive means downstream transport and negative means upstream transport)
Figure 62 shows the effect on the tidal pumping between the reference case and the C alternatives (see section 4.5 for the decomposition method). As expected, the C1 alternative has the lowest impact to the system while the C3 has the largest effect. The differences in the tidal pumping transport are mainly located in the region from Km 50 to Km 80, where the C3 has the largest upstream transport. This explains the transition in total transport from downstream to upstream observed in C2 and C3. The shift in tidal pumping is caused by a combination of the shift in tidal asymmetry in the hydrodynamics, and the effect on SSC.
6.2 Conclusions Based on the above results and discussions, the following conclusions can be drawn from this study: • •
• •
56
The C1 alternative has the lowest impact to the mud transport, while the C2 and C3 alternatives have much larger effects. The main trend found in the results is the reduction of SSC in the Upper Sea Scheldt. This trend is relatively consistent under the A0CN, AminCL and AplusCH scenarios. A transport decomposition reveals that the sediment is transported towards downstream from km 0 until a certain location between km 50 and km 80, depending on the C alternatives. Therefore, in the region km 0-50 where the transport is downstream in all alternatives, the sediment sinks that are added to the system have a cumulative effect on reducing the SSC, and they are expected to capture an important part of the upstream sediment input. The transport decomposition also reveals that there is also an increasing effect on SSC between km 50 and the disposal location at km 90, because of an expected increase in sediment transport due to tidal pumping. This effect on tidal pumping is stronger in C3 and C2. The effects of the measures in the Upper Sea Scheldt could also influence further downstream although the influences are not strong.
WL2021R13_131_18
Final version
Integraal Plan Bovenzeeschelde - Sub report 18 – Effect of the C-alternatives on mud transport
7 References Bi, Qilong; Vanlede, Joris; Smolders, Sven (2021). Estimation of siltation on the intertidal and flood control areas. Versie 4.0. WL Memo’s, 13_131_61. Waterbouwkundig Laboratorium: Antwerpen. Bi, Q.; Smolders, S.; Plancke, Y.; De Maerschalck, B.; Vanlede, J. (2018). Integraal Plan Bovenzeeschelde: Sub report 9 – Effect of B-alternatives on Mud Transport. Version 4.0. FHR Reports, 13_131_9. Flanders Hydraulics Research: Antwerp. Bi, Q.; Smolders, S.; Vanlede, J.; Mostaert, F. (2020a). Integraal Plan Bovenzeeschelde: Sub report 13 – Implementation of C alternatives. Version 1.0. FHR Reports, 13_131_13. Flanders Hydraulics Research: Antwerp. Bi, Q.; Smolders, S.; Vanlede, J.; Mostaert, F. (2020b). Integraal Plan Bovenzeeschelde: Sub report 15 – Tracer Calculations for Determining the Dispersion Coefficients for the Ecological Model in the C alternatives. Version 0.1. FHR Reports, 13_131_15. Flanders Hydraulics Research: Antwerp. Burchard, H.; Schuttelaars, H.M.; Ralston, D.K. (2018). Sediment Trapping in Estuaries. Ann. Rev. Mar. Sci. 10(1): annurev-marine-010816-060535. doi:10.1146/annurev-marine-010816-060535 Emery, W. J. & Thomson, R. E. (2001). Data Analysis Methods in Physical Oceanography (Second and Revised Edition). Elsevier, Amsterdam, Netherland, pp.638. Fettweis, M.; Du Four, I.; Zeelmaekers, E.; Baeteman, C.; Francken, F.; Houziaux, J.-S.; Mathys, M.; Nechad, B.; Pison, V.; Vandenberghe, N.; Van den Eynde, D.; Van Lancker, V.R.M.; Wartel, S. (2007). Mud Origin, Characterisation and Human Activities (MOCHA): Final report. Belgian Science Policy: Brussel. 59 pp. Godin, G. (1966) Daily mean sea level and short-period seiches. International Hydrographic Review, 43, 7589. IMDC (2015). Bepalen van randvoorwaarden voor de referentiesituatie (2050) m.b.t. debiet en waterstand. IMDC Report, I/NO/11448/15.128/TFR/. IMDC: Antwerp. IMDC (2018). Evaluation method for the Integrated Plan Upper Seascheldt. IMDC Report, IMDC Antwerp. IMDC (2021). Definition of the C alternatives. I/RA/11448/21009/JVS. Definition of the C alternatives. IMDC Report, IMDC Antwerp. Scully, M.E.; Friedrichs, C.T. (2007). Sediment pumping by tidal asymmetry in a partially mixed estuary. J. Geophys. Res. Ocean. ISBN 01480227 (ISSN) 112(7): 1–12. doi:10.1029/2006JC003784 Smolders, S.; Maximova, T.; Vanlede, J.; Plancke, Y.; Verwaest, T.; Mostaert, F. (2016). Integraal Plan Bovenzeeschelde: Subreport 1 – SCALDIS: a 3D Hydrodynamic Model for the Scheldt Estuary. Version 5.0. WL Rapporten, 13_131. Flanders Hydraulics Research: Antwerp, Belgium. Smolders, S.; Bi, Q.; Vanlede, J.; De Maerschalck, B.; Plancke, Y.; Schramkowski, G.; Mostaert, F. (2018). Integraal plan Boven-Zeeschelde: Sub report 6 – Scaldis Mud: a Mud Transport model for the Scheldt Estuary. Version 4.0. FHR Reports, 13_131_6. Flanders Hydraulics Research: Antwerp.
Final version
WL2021R13_131_18
57
Integraal Plan Bovenzeeschelde - Sub report 18 – Effect of the C-alternatives on mud transport
Vandenbruwaene, W.; Vanlede, J.; Plancke, Y.; Verwaest, T.; Mostaert, F. (2015). Inrichtingsplan HedwigeProsperpolder: deelrapport 3. Empirisch ophogingsmodel. versie 6.0. WL Rapporten, 13_166. Waterbouwkundig Laboratorium: Antwerpen. III, 20 pp. Van Hoestenberghe, T.; Ferket, B.; De Boeck, K.; Vanlierde, E.; Vanlede, J.; Verwaest, T.; Mostaert, F. (2014). Slibbalans Zeeschelde: Deelrapport 2 – Sediment load for the river Scheldt and its main tributaries (1972 – 2009). Versie 5.0. WL Rapporten, 00_029. Waterbouwkundig Laboratorium & Antea Group. Antwerpen, België. Vansteenkiste, J; Adams, R. (2020). Definition of the C alternatives (v1.4). IMDC Report, I/NO/11448/19.226/JVS/RAD. IMDC: Antwerp.
58
WL2021R13_131_18
Final version
Integraal Plan Bovenzeeschelde - Sub report 18 – Effect of the C-alternatives on mud transport
Appendix 1
Polygons for ΔSSC calculation
Polygons for 2050C1
Figure 63 – Polygons for 2050_C1 (polygons 1-13, 87-88)
Figure 64 – Polygons for 2050_C1 (polygons 13-31, 85-86)
Final version
WL2021R13_131_18
A1
Integraal Plan Bovenzeeschelde - Sub report 18 – Effect of the C-alternatives on mud transport
Figure 65 – Polygons for 2050_C1 (polygons 32-58, 79-84)
Figure 66 – Polygons for 2050_C1 (polygons 59-78)
A2
WL2021R13_131_18
Final version
Integraal Plan Bovenzeeschelde - Sub report 18 – Effect of the C-alternatives on mud transport
Polygons for 2050C2
Figure 67 – Polygons for 2050_C2 (polygons 1-13, 91-92)
Figure 68 – Polygons for 2050_C2 (polygons 13-31, 89-90)
Final version
WL2021R13_131_18
A3
Integraal Plan Bovenzeeschelde - Sub report 18 – Effect of the C-alternatives on mud transport
Figure 69 – Polygons for 2050_C2 (polygons 32-58, 79-88)
Figure 70 – Polygons for 2050_C2 (polygons 59-78)
A4
WL2021R13_131_18
Final version
Integraal Plan Bovenzeeschelde - Sub report 18 – Effect of the C-alternatives on mud transport
Polygons for 2050C3
Figure 71 – Polygons for 2050_C3 (polygons 1-13, 90-91)
Figure 72 – Polygons for 2050_C3 (polygons 13-31, 88-89)
Final version
WL2021R13_131_18
A5
Integraal Plan Bovenzeeschelde - Sub report 18 – Effect of the C-alternatives on mud transport
Figure 73 – Polygons for 2050_C3 (polygons 32-58, 79-87)
Figure 74 – Polygons for 2050_C3 (polygons 59-78)
A6
WL2021R13_131_18
Final version
Integraal Plan Bovenzeeschelde - Sub report 18 – Effect of the C-alternatives on mud transport
Appendix 2 Bottom evolution in FCA-CRTs and depoldering areas over 50 years 2050REF_C AminCL
AplusCH
2,5
A0CN
ΔZ (m) after 50 years
ΔZ (m) after 50 years
A0CN
2050C1
2 1,5 1 0,5 0
2 1,5 1 0,5 0
2 1,5 1 0,5 0
2050C3 AplusCH
A0CN
ΔZ (m) after 50 years
ΔZ (m) after 50 years
2,5
AminCL
AplusCH
2,5
2050C2 A0CN
AminCL
AminCL
AplusCH
2,5 2 1,5 1 0,5 0
Figure 75 – Sedimentation rate in FCA-CRTs over 50 years (upper left: 2050REF_C, upper right: 2050C1, lower left:2050C2, lower right:2050C3)
Final version
WL2021R13_131_18
A7
Integraal Plan Bovenzeeschelde - Sub report 18 – Effect of the C-alternatives on mud transport
2050REF_C 3,50
ΔZ (m) after 50 years
3,00 2,50 2,00
A0CN
1,50
AminCL AplusCH
1,00 0,50 0,00
GROOT SCHOOR
UITERDIJK
WIJMEERS DEEL2
Figure 76 – Sedimentation rate in depoldered areas with sea level rise (2050REF_C)
2050C1 ΔZ (m) after 50 years
3,50 3,00 2,50 2,00 1,50
A0CN
1,00
AminCL
0,50
AplusCH
0,00
Figure 77 – Sedimentation rate in depoldered areas with sea level rise (2050C1)
A8
WL2021R13_131_18
Final version
Integraal Plan Bovenzeeschelde - Sub report 18 – Effect of the C-alternatives on mud transport
2050C2 ΔZ (m) after 50 years
3,50 3,00 2,50 2,00 1,50
A0CN
1,00
AminCL
0,50
AplusCH
0,00
Figure 78 – Sedimentation rate in depoldered areas with sea level rise (2050C2)
ΔZ (m) after 50 years
2050C3 3,00 2,50 2,00 1,50 1,00
A0CN
0,50
AminCL
0,00
AplusCH
Figure 79 – Sedimentation rate in depoldered areas with sea level rise (2050C3)
Final version
WL2021R13_131_18
A9
DEPARTMENT MOBILITY & PUBLIC WORKS Flanders hydraulics Research Berchemlei 115, 2140 Antwerp T +32 (0)3 224 60 35 F +32 (0)3 224 60 36 waterbouwkundiglabo@vlaanderen.be www.flandershydraulicsresearch.be