6 PART-TIME ARTS EDUCATION
School population
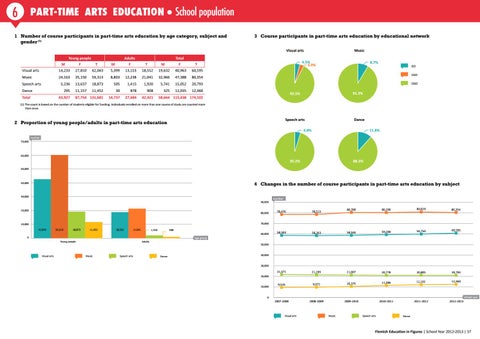
1 Number of course participants in part-time arts education by age category, subject and gender (1)
3 Course participants in part-time arts education by educational network Visual arts
Young people
Adults
M
F
T
Visual arts
14,233
27,810
42,043
Music
24,163
35,150
5,236 295
Speech arts Dance Total
43,927
M
Total
F
T
M
F
T
5,399
13,153
18,552
19,632
40,963
60,595
59,313
8,803
12,238
21,041
32,966
47,388
80,354
13,637
18,873
505
1,415
1,920
5,741
15,052
20,793
11,157
11,452
30
878
908
325
12,035
12,360
87,754 131,681
14,737
27,684
42,421
Music
4.5% 3.0%
8.7%
GO VGO OGO
91.3%
92.5%
58,664 115,438 174,102
(1) The count is based on the number of students eligible for funding. Individuals enrolled on more than one course of study are counted more than once.
Speech arts
2 Proportion of young people/adults in part-time arts education
Dance 11.8%
4.8% 70,000
number
60,000
88.2%
95.2% 50,000
40,000
4 Changes in the number of course participants in part-time arts education by subject
30,000 90,000 20,000
80,000
number 80,390
80,299
80,829
80,354
58,263
58,565
59,200
59,750
60,595
21,571
21,199
21,007
20,778
20,805
20,793
9,516
9,672
10,375
11,386
12,102
12,360
2007-2008
2008-2009
2009-2010
2010-2011
2011-2012
2012-2013
78,476
78,513
58,503
70,000
10,000 42,043
59,313
18,873
11,452
18,552
21,041
908
1,920
60,000
0 Young people
Visual arts
age group
Adults
Music
Speech arts
50,000
Dance
40,000
30,000 20,000 10,000
0
school year
Visual arts
Music
Speech arts
Dance
Flemish Education in Figures | School Year 2012-2013 | 37