Elementaryeducation Leerlingen EDUCATION SCHOOL POPULATION 3 SECONDARY 1 School population in secondary education GO M
F
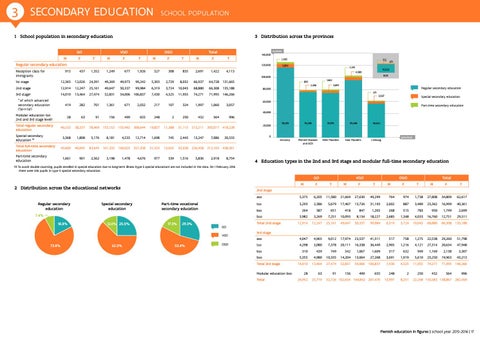
3 Distribution across the provinces VGO
T
M
F
OGO T
M
Total
F
T
M
F
140,000
T
2,965
Regular secondary education
120,000
915
Reception class for immigrants
number
437
1,352
1,249
677
1,926
527
308
835
2,691
1,422
512
5,859
2,261
4,113
12,365
12,026
24,391
49,269
49,973
99,242
5,303
2,729
8,032
66,937
64,728 131,665
2nd stage
12,914
12,247
25,161
49,647
50,337
99,984
6,319
3,724
10,043
68,880
66,308 135,188
14,010
3rd stage
*
13,464
27,474
52,831
54,006 106,837
7,430
4,525
11,955
74,271
BCR 895
1,662 3,891
2,436
Regular secondary education
80,000 971
71,995 146,266
of which advanced secondary education (‘Se-n-Se’)
419
282
701
1,361
671
2,032
217
107
324
1,997
1,060
3,057
Modular education (on 2nd and 3rd stage level)
28
63
91
156
499
655
248
2
250
432
564
996
Total regular secondary education
40,232
38,237
78,469 153,152 155,492 308,644
19,827
11,288
3,368
1,808
12,714
1,698
745
43,600
40,045
83,645 161,333 160,025 321,358
21,525
12,033
1,661
901
977
539
14,323
4,580 100,000
1st stage
671
*
3,567
Special secondary education
60,000
Part-time secondary education 40,000
Special secondary education (1) Total full-time secondary education Part-time secondary education
5,176
2,562
8,181
3,198
4,533
1,478
4,676
2,443
13,247
7,086
116,515
75,258
74,375
95,458
56,622
Antwerp
Flemish Brabant and BCR
West Flanders
East Flanders
Limburg
20,000
31,115 213,211 205,017 418,228
0
20,333
province
33,558 226,458 212,103 438,561 1,516
5,836
2,918
8,754
4 Education types in the 2nd and 3rd stage and modular full-time secondary education
(1) To avoid double counting, pupils enrolled in special education due to long-term illness (type 5 special education) are not included in the data. On 1 February 2016 there were 436 pupils in type 5 special secondary education.
GO M
2 Distribution across the educational networks Regular secondary education
Special secondary education
12.0% 25.5%
Part-time vocational secondary education
17.3%
29.3%
GO VGO
73.8%
62.5%
OGO
T
M
F
T
M
F
Total T
M
F
T
2nd stage
7.4% 18.8%
F
VGO
53.4%
OGO
aso
5,375
6,205
11,580
21,669
27,630
49,299
764
974
1,738
27,808
34,809
62,617
tso
3,293
2,386
5,679
17,467
13,726
31,193
2,602
887
3,489
23,362
16,999
40,361
kso
264
387
651
418
847
1,265
268
515
783
950
1,749
2,699
bso
3,982
3,269
7,251
10,093
8,134
18,227
2,685
1,348
4,033
16,760
12,751
29,511
12,914
12,247
25,161
49,647
50,337
99,984
6,319
3,724
10,043
68,880
66,308 135,188
aso
4,047
4,965
9,012
17,974
23,537
41,511
517
758
1,275
22,538
29,260
51,798
tso
4,298
3,080
7,378
20,111
16,338
36,449
2,905
1,216
4,121
27,314
20,634
47,948
kso
310
439
749
542
1,067
1,609
317
632
949
1,169
2,138
3,307
bso
5,355
4,980
10,335
14,204
13,064
27,268
3,691
1,919
5,610
23,250
19,963
43,213
14,010
13,464
27,474
52,831
54,006 106,837
7,430
4,525
11,955
74,271
71,995 146,266
28
63
91
156
655
248
2
250
432
26,952
25,774
52,726 102,634 104,842 207,476
13,997
8,251
Total 2nd stage 3rd stage
Total 3rd stage Modular education bso Total
499
564
996
22,248 143,583 138,867 282,450
Flemish education in figures | school year 2015-2016 | 17