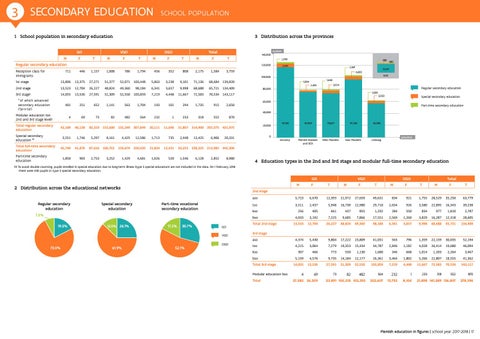
Elementaryeducation Leerlingen EDUCATION SCHOOL POPULATION 3 SECONDARY 1 School population in secondary education GO M
F
3 Distribution across the provinces VGO
T
M
F
OGO T
M
Total
F
T
M
F
140,000
T
2,990
Regular secondary education
120,000
711
Reception class for immigrants
number
446
1,157
1,008
786
1,794
456
352
808
2,175
1,584
589
5,799
2,337
3,759
13,896
13,375
27,271
51,377
52,071 103,448
5,863
3,238
9,101
71,136
68,684 139,820
2nd stage
13,523
12,704
26,227
48,824
49,360
6,341
3,657
9,998
68,688
65,721 134,409
14,055
3rd stage
*
of which advanced secondary education (‘Se-n-Se’)
13,536
27,591
51,309
98,184
52,550 103,859
7,219
4,448
11,667
72,583
BCR 1,004
1,640 3,924
2,455
Regular secondary education
80,000 1,009
70,534 143,117
*
401
251
652
1,141
563
1,704
193
101
294
1,735
915
2,650
Modular education (on 2nd and 3rd stage level)
4
69
73
82
482
564
232
1
233
318
552
870
Total regular secondary education
42,189
40,130
82,319 152,600 155,249 307,849
20,111
11,696
3,551
1,746
12,586
1,713
735
45,740
41,876
87,616 160,761 159,674 320,435
21,824
12,431
1,850
903
1,026
520
14,491
4,603 100,000
1st stage
680
3,550
Special secondary education
60,000
Part-time secondary education 40,000
Special secondary education (1) Total full-time secondary education Part-time secondary education
5,297
2,753
8,161
3,252
4,425
1,429
4,681
20,000
31,807 214,900 207,075 421,975 2,448
13,425
6,906
117,551
76,909
73,627
97,290
56,598
Antwerp
Flemish Brabant and BCR
West Flanders
East Flanders
Limburg
0
20,331
province
34,255 228,325 213,981 442,306 1,546
6,128
2,852
8,980
4 Education types in the 2nd and 3rd stage and modular full-time secondary education
(1) To avoid double counting, pupils enrolled in special education due to long-term illness (type 5 special education) are not included in the data. On 1 February 2018 there were 440 pupils in type 5 special secondary education.
GO M
2 Distribution across the educational networks Regular secondary education
Special secondary education
12.0% 26.1%
Part-time vocational secondary education
17.2%
30.7%
GO VGO
73.0%
61.9%
T
M
F
OGO T
M
Total
F
T
M
F
T
2nd stage
7.5% 19.5%
F
VGO
52.1%
OGO
aso
5,723
6,670
12,393
21,972
27,659
49,631
834
921
1,755
28,529
35,250
63,779
tso
3,511
2,437
5,948
16,730
12,980
29,710
2,654
926
3,580
22,895
16,343
39,238
kso
256
405
661
437
855
1,292
284
550
834
977
1,810
2,787
bso
4,033
3,192
7,225
9,685
7,866
17,551
2,569
1,260
3,829
16,287
12,318
28,605
13,523
12,704
26,227
48,824
49,360
98,184
6,341
3,657
9,998
68,688
65,721
134,409
aso
4,374
5,430
9,804
17,222
23,809
41,031
563
796
1,359
22,159
30,035
52,194
tso
4,215
3,064
7,279
19,353
15,434
34,787
2,846
1,182
4,028
26,414
19,680
46,094
kso
307
466
773
550
1,130
1,680
346
668
1,014
1,203
2,264
3,467
bso
5,159
4,576
9,735
14,184
12,177
26,361
3,464
1,802
5,266
22,807
18,555
41,362
14,055
13,536
27,591
51,309
52,550
103,859
7,219
4,448
11,667
72,583
70,534
143,117
4
69
73
82
482
564
232
1
233
318
552
870
53,891 100,215 102,392
202,607
13,792
8,106
21,898 141,589 136,807
278,396
Total 2nd stage 3rd stage
Total 3rd stage Modular education bso Total
27,582 26,309
Flemish education in figures | school year 2017-2018 | 17