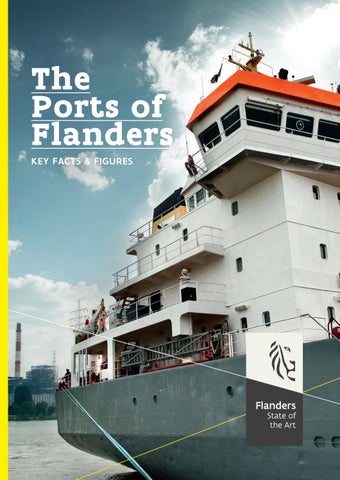
The Ports of Flanders KeY FaCts & FIgures
berlIn
The Ports of Flanders
262
rOtterdaM
milliOn tOns GOOds turnOVer nOrdrheIn westFalen
Antwerp
lOndOn
191
pOrt OF zeebrugge
mil.
Ghent pOrt OF antwerp
pOrt OF OOstende pOrt OF ghent
ruhr area
26
Zeebrugge
43
mil.
Oostende mil.
1.8
mil.
Key figures 2013 all 4 FleMIsh pOrts
ten-t Core network seagOIng Vessels
29,200 COnsuMers wIthIn a 500 KM range
More than 100 million COntaIner thrOughput
10.7 million teu
destInatIOns wOrldwIde
More than 500 COVered warehOuses
600 hectares MOtIVated eMplOYees
227,350 pOrt surFaCes
20,000 hectares InVestMents
€ 3.14 billion € 8.6 million / a day
brussels
parIs
2
The Ports of Flanders
The Ports of Flanders
3
Facts
4 Flemish ports. Different in size, location and specialization.
Port of Zeebrugge deep draught coastal port: 43 million tons goods turnover
Port of Antwerp largest mainport of Flanders, second port in europe: 191 million tons maritime goods turnover • deepsea container hub, market leader on 5 out of 6 sailing areas • Covering all major traffic flows (e.g. fruit and perishables, forest products, project cargo, bulk liquids, containers, steel, roll-on roll-off, cars, coal, iron ore, bulk agricultural produce, fertilizers, energy gasses, conventional general cargo) • world’s most important coffee port • europe’s leading integrated maritime and logistics platform • europe’s largest oil and chemical cluster • excellent inland location: 80 km from the sea • accessible for the latest generation of container ships: even +18,000 teu container vessels • widely connected to the fore- and hinterland • appropriate storage solutions for each product (i.e. 560 hectares covered storage space) • extensive shortsea and feeder network
4
The Ports of Flanders
• deepsea container port, with frequent connections to all continents
Port of Oostende
• shortsea: Important roll-on roll-off destinations in europe (great britain, Iberian peninsula, scandinavia) • prominent car handling port in the world • Important hub for liquefied natural gas (lng)
small coastal port: 1.8 million tons goods turnover
• Cruise port • accessible at any time for the largest container ships • specialized in handling foodstuffs
Port of Ghent Multimodal port with good connections: 26 million tons goods turnover
• specialized in roll-on roll-off goods and sand/gravel for the building industry • growing importance of offshore industry (hub for construction and maintenance of off-shore windfarms in the north sea) • good connections to the motorways and rail network
• specialized in dry & liquid bulk: grain, vegetable oils, building materials, coal & iron ore, petroleum products, woodpellets, biofuels, ... • Centre for production & logistics close to consumer markets: automotive, paper industry, bio-energy, roro and containers • Multimodal port with good connection to France, the netherlands and germany by inland navigation • space to invest: one of the biggest maritime sites in europe (660 hectares) around the new Kluizendok • excellent inland location & nautical access: 64 km from the sea, accessible via the ghent-terneuzen canal, a new lock in 2021
The Ports of Flanders
5
Figures
Goods total turnover x1000 tons (2013) 300.000
250.000
200.000
Containers: number of Twenty foot Equivalent Units (TEU)
150.000
100.000
50.000
0 2013
2012
2011
2010
2009
2008
2007
2006
2005
2004
2003
2002
2001
2000
1999
1998
1997
1996
1995
1994
1993
1992
1991
1990
1989
1988
1987
1986
1985
1984
1983
1982
1981
1980
2,026,270
70,228
0
Antwerp
Zeebrugge
Ghent
Oostende
Legend
antwerp
zeebrugge
ghent
Oostende
Total
1980
81,935
14,189
18,424
3,760
118,308
1990
102,009
30,349
24,439
4,552
161,349
2000
130,994
35,475
24,039
4,307
194,815
Ghent
2010
178,170
49,600
27,258
4,935
259,963
Zeebrugge
2010
8,468,310
2011
187,203
46,958
27,192
3,844
265,197
2011
8,662,034
2012
184,129
43,544
26,303
3,197
257,173
2013
190,957
42,832
25,955
1,819
261,563
Goods: Categories x1000 tons (2013)
6
8,578,269
8+31+5434 3+16+48294 63+15+2812 69+3+244 13+27+4785 Antwerp
Zeebrugge
Ghent
Oostende
Total
antwerp
zeebrugge
ghent
Oostende
Total
Dry Bulk
14,446
1,285
16,367
1,247
33,345
Liquid Bulk
59,533
6,916
3,871
56
70,376
Containers
102,326
20,413
587
0
123,326
Roll-on roll-off
4,562
12,544
1,972
442
19,520
Conventional cargo
10,090
1,674
3,158
74
14,996
Total
190,957
42,832
25,955
1,819
261,563
The Ports of Flanders
antwerp
zeebrugge
ghent
Oostende
Total
724,247
181,010
9,950
0
915,207
1990
1,549,113
334,382
9,620
0
1,893,115
2000
4,097,247
965,345
9,900
0
5,072,492
2,499,756
83,065
0
11,051,131
2,206,681
80,093
0
10,948,808
1980
Antwerp
Oostende
Number of passengers
2012
8,635,129
1,953,170
88,159
0
10,676,458
2013
8,578,269
2,026,270
70,228
0
10,674,779
1,217
Antwerp
816,755
Zeebrugge
1,045
27,709
Ghent
Oostende
14,220
7,651
2,949
4,358
(2013)
Number of seagoing vessels
Antwerp
Zeebrugge
Ghent
Oostende
(2013)
The Ports of Flanders
7
Origin
Goods unloaded in the ports of Flanders
�+� �+� �+� �+� �+� Antwerp
ZeebruGGe
67.6
million tons eurOpe
22.3
Ghent
29.2
million tons
nOrth AmeriCA
million tons AsiA
OOstende
9.7
million tons
sOuth AmeriCA
7.8
million tons AFriCA
1.7
million tons OCeAniA
8
The Ports of Flanders
tOtAl
gOOds unlOaded
(x1000 tons)
41,314
europe
22,894
Asia
18,727
north America south America
6,913
Africa
7,422 605
Oceania
97,875
total
gOOds unlOaded
(x1000 tons)
13,249
europe
5,726
Asia north America
190
south America
601
Africa
131 105
Oceania
20,002
total
gOOds unlOaded
(x1000 tons)
11,572
europe
616
Asia north America
3,403
south America
2,234 254
Africa
1,008
Oceania
19,087
total
gOOds unlOaded
(x1000 tons)
1,499
europe Asia
0
north America
0
south America
0
Africa
15
Oceania
0 1,514
total
gOOds unlOaded
(x1000 tons) europe
67,634
Asia
29,236
north America
22,320
south America
9,748
Africa
7,822
Oceania total
1,718 138,478
The Ports of Flanders
9
gOOds lOaded
(x1000 tons) europe
28,095
Asia
29,975
north America
14,143
south America
6,530
Africa
14,123
Oceania total
108 92,974
gOOds lOaded
(x1000 tons) europe
17,697
Asia
3,326
north America
506
south America
904
Africa
239
Oceania total
158 22,830
gOOds lOaded
(x1000 tons) europe
5,473
Asia
192
north America
248
south America
243
Africa
713
Oceania total
0 6,869
gOOds lOaded
(x1000 tons) europe
305
Asia
0
north America
0
south America
0
Africa
0
Oceania
0
total
305
gOOds lOaded
(x1000 tons) europe
51,570
Asia
33,493
north America
14,897
south America
7,677
Africa Oceania total
10
The Ports of Flanders
15,075 266 122,978
�+� �+� �+� � �+�12
Destination
Goods loaded in the ports of Flanders
Antwerp
ZeebruGGe
51.6
million tons eurOpe
Ghent
14.9
33.5
million tons
million tons
nOrth AmeriCA
AsiA
OOstende
tOtAl
7.7
million tons
sOuth AmeriCA
15.1
million tons AFriCA
0.3
million tons OCeAniA
The Ports of Flanders
11
Hinterland connections
More info
In the center of europe: thanks to excellent hinterland connections a lot of important consumption centers are just a few hours away from the ports of Flanders (500 km range)
COrpOrAte And sOCiAl respOnsibility Each Flemish Port Authority (PA) fulfills all the criteria concerning corporate and social responsibility (criteria from ESPO Port Performance Dashboard): • The Port Authority (PA) holds an Annual Meeting • The Annual Report of the PA is publicly available • The PA holds regular meetings with the port community and stakeholders • The PA publishes reports on socially responsible initiatives • The PA publishes financial reports • The PA's specific mission statement is publicly available • The PA maintains financial accounts audited by external auditor(s) • The PA has internal analytical accounting processes • The PA uses public selection procedures to contract land
AutOnOmOus mAnAGement Each Flemish Port Authority (PA) is managed autonomously. They fulfill the following criteria from the ESPO Port Performance Dashboard:
unIted KIngdOM
• The PA has its own legal status
netherlands
• The PA is directed by a daily management body (e.g. management board or management committee) Flanders
60% of the European purchasing power is located within 500 km of Flanders.
gerManY
luXeMbOurg
• The PA develops a port masterplan • The PA is able to contract port land to third parties (e.g. terminal operators) in order to permit these parties to provide port services • The PA is responsible to set the rules of agreements with third parties • The PA issues safety regulations in addition to (obligatory) national/international regulations • The PA issues security regulations in addition to (obligatory) national/international regulations
FranCe swItzerland
• The PA issues environmental regulations in addition to (obligatory) national/ international regulations • The PA is financially autonomous
12
The Ports of Flanders
FlAnders pOrt AreA investing in Flanders Flanders is generally considered as the absolute European number one location for logistics operations. Thanks to its geographical location and its know-how it is a central link in world trade. It is ideally located to serve a large part of European and world consumers. Add to this an excellent port infrastructure and gigantic storage capacities as well as a highly skilled workforce and you will understand why Flanders is the perfect location for international companies. Flanders Investment and Trade can support you all the way, from setting up to expanding your professional activities in Flanders. They provide confidential information, advice and guidance. Their experienced staff is happy to help you with all your questions regarding investment subsidies and recruitment, and can introduce you to the right decision-makers and to community life in Flanders. Interested? Contact Flanders Investment & Trade (FlT) at www.investinflanders.be
region of ports Flanders is a region of ports. Our four seaports, Antwerp, Zeebrugge, Ghent and Oostende, are gateways to the European hinterland. Geographically speaking, sixty percent of the European purchasing power is located within 500 kilometers of Flanders. Antwerp, Ghent, Oostende and Zeebrugge are situated a mere 100 kilometers apart. But what’s more: Paris is at barely 300 kilometers, the Ruhr Area at 150 kilometers at most. Brussels, the centre of international networks and home to the headquarters of the European Commission, the European Council and the European Parliament is at the same time the capital of the Flemish Region and of Belgium itself. In 2013 the ports of Antwerp, Zeebrugge, Ghent and Oostende together with the Flemish Port Community and the Flemish government agreed to strengthen their international competitiveness in a bottom-up collaboration strategy called Flanders Port Area. The ports in Flanders are competitors but join forces whenever possible to guarantee their customers maximum added value. Flanders’ ports are working together in economic and commercial domains, logistics, the development of operational tools and on policy themes. The Flemish government plays a supporting and stimulating role. Its assets and joint strategies turn Flanders Port Area into a valuable hub of the European transport network and make it the most efficient way to reach 500,000,000 European Consumers.
The Ports of Flanders
13
Statistical Information Colophon Composition of: • The Flemish Port Commission • The Ports of Antwerp, Ghent, Zeebrugge and Oostende • The Department Mobility and Public Works (Government of Flanders) • Flanders Investment and Trade (Government of Flanders)
Publisher Responsible Filip Boelaert, Civil Engineer, Secretary-General for Department Mobility and Public Works Koning Albert II-laan 20, Post Box 2, 1000 Brussels
Photos Tom D’Haenens, Marco Mertens, Michel Dauchy, Dirk Neyts, Port of Antwerp, Port of Ghent, Port of Oostende, Port of Zeebrugge
Layout Absoluut, www.absoluut.be
Registration number D/2014/3241/075
Edition May, 2014
More statistical information concerning the Flemish ports can be found on: www.flemishportcommission.be The Flemish Port Commission contributes to the preparation of port policy. It has an advisory and recommendatory mission as well as a research and informative mission.
A reliable and competitive infrastructure, excellent logistics and fast mobility are assets for any modern society. The experts of Mobility and Public Works in the Flanders region ensure this. They are part of the government of Flanders: a workforce comprising over 4,000 skilled and dynamic employees define the policies, manage large investment projects, and provide groundbreaking technical support in a variety of areas. www.flanders.be/roadstotomorrow Flanders in Action is a future project for Flanders. Flanders wishes to stand out as an economically innovative, sustainable and caring society by 2020. The government of Flanders and all major social partners have therefore laid down concrete objectives in the Pact 2020. www.flandersinaction.be Flanders in Action Pact 2020
Antwerp PORT Authority Port House Entrepotkaai 1 B-2000 Antwerp, Belgium T +32 3 205 20 11 F +32 3 205 20 28 E info@portofantwerp.com www.portofantwerp.com
PORT OF ZEEBRUGGE P. Vandammehuis Isabellalaan 1 B-8380 Zeebrugge, Belgium T +32 50 54 32 11 F +32 50 54 32 24 E mbz@zeebruggeport.be www.portofzeebrugge.be
Ghent Port Company Limited liability company under public law John Kennedylaan 32 B-9042 Ghent, Belgium T +32 9 251 05 50 F +32 9 251 54 06 E info@portofghent.be www.portofghent.be
AG Port Oostende Slijkensesteenweg 2 B-8400 Oostende, Belgium T +32 59 34 07 11 F +32 59 34 07 10 E info@portofoostende.be www.portofoostende.be