BASISONDERWIJS LeerlingenSchool population EDUCATION 2 ELEMENTARY 1 School population in elementary education (1) NURSERY EDUCATION
m
GO
F T m
VGO
F T m
OGO
F T m
Total
F T
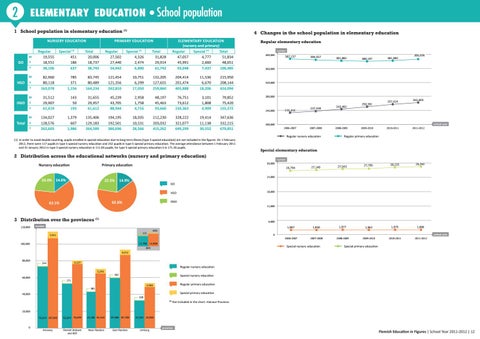
4 Changes in the school population in elementary education
pRImARY EDUCATION
ElEmENTARY EDUCATION (nursery and primary) Regular Special (1) Total 47,057 4,777 51,834 45,991 2,660 48,651 93,048 7,437 100,485
Regular 19,555 18,551 38,106
Special (1) 451 186 637
Total 20,006 18,737 38,743
Regular 27,502 27,440 54,942
Special (1) 4,326 2,474 6,800
Total 31,828 29,914 61,742
82,960 80,118 163,078
785 371 1,156
83,745 80,489 164,234
121,454 121,356 242,810
10,751 6,299 17,050
132,205 127,655 259,860
204,414 201,474 405,888
11,536 6,670 18,206
215,950 208,144 424,094
31,512 29,907 61,419
143 50 193
31,655 29,957 61,612
45,239 43,705 88,944
2,958 1,758 4,716
48,197 45,463 93,660
76,751 73,612 150,363
3,101 1,808 4,909
79,852 75,420 155,272
134,027 128,576 262,603
1,379 607 1,986
135,406 129,183 264,589
194,195 192,501 386,696
18,035 10,531 28,566
212,230 203,032 415,262
328,222 321,077 649,299
19,414 11,138 30,552
347,636 332,215 679,851
(1) In order to avoid double counting, pupils enrolled in special education due to long-term illness (type 5 special education) are not included in the figures. On 1 February 2012, there were 117 pupils in type 5 special nursery education and 242 pupils in type 5 special primary education. The average attendance between 1 February 2011 and 31 January 2012 in type 5 special nursery education is 111.03 pupils; for type 5 special primary education it is 171.35 pupils.
Regular elementary education number 400,000
22.5%
381,983
386,696
280,000
240,000
233,344
237,530
243,482
250,391
257,424
262,603
school year
200,000 2006-2007
2007-2008
Regular nursery education
2008-2009
2009-2010
2010-2011
2011-2012
Regular primary education
Special elementary education number
26,794
27,140
27,543
27,705
28,225
28,566
1,907
1,950
1,977
1,962
1,975
1,986
2006-2007
2007-2008
2008-2009
2009-2010
2010-2011
2011-2012
GO 18,000
OGO
62.6%
12,000
3 Distribution over the provinces (1) 120,000
380,197
24,000
14.9%
VGO
62.1%
381,882
320,000
30,000
Primary education
23.3% 14.6%
384,557
360,000
2 Distribution across the educational networks (nursery and primary education) Nursery education
387,157
6,000
number 121
7,921
633 0
11.768 14,848 11,706
100,000
school year
Special nursery education
BCR
Special primary education
6,312 80,000
4,227
544
Regular nursery education 5,543
60,000
462
Special nursery education
271
Regular primary education
4,563
381
Special primary education
40,000
328 (1)
Not included in the chart: Hainaut Province.
20,000
0
73,624 107,845
53,074 76,699
43,285 65,344
59.988 87.738
32,593 49,030
Antwerp
Flemish Brabant and BCR
West Flanders
East Flanders
Limburg
province
Flemish Education in Figures | School Year 2011-2012 | 12