education Leerlingen ELEMENTARY EDUCATION SCHOOL POPULATION 2 Elementary 1 School population in elementary education (1) NURSERY EDUCATION
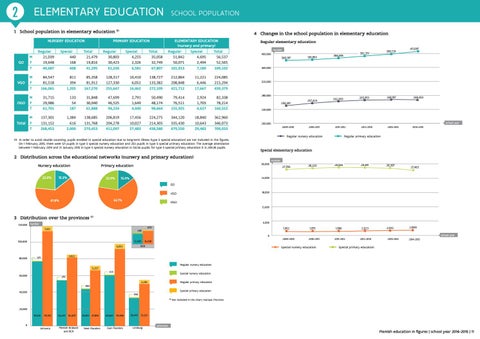
4 Changes in the school population in elementary education
PRIMARY EDUCATION
ELEMENTARY EDUCATION (nursery and primary) Regular Special Total 51,842 4,695 56,537 50,071 2,494 52,565 101,913 7,189 109,102
M F T
Regular 21,039 19,648 40,687
Special 440 168 608
Total 21,479 19,816 41,295
Regular 30,803 30,423 61,226
Special 4,255 2,326 6,581
Total 35,058 32,749 67,807
VGO
M F T
84,547 81,518 166,065
811 394 1,205
85,358 81,912 167,270
128,317 127,330 255,647
10,410 6,052 16,462
138,727 133,382 272,109
212,864 208,848 421,712
11,221 6,446 17,667
224,085 215,294 439,379
OGO
M F T
31,715 29,986 61,701
133 54 187
31,848 30,040 61,888
47,699 46,525 94,224
2,791 1,649 4,440
50,490 48,174 98,664
79,414 76,511 155,925
2,924 1,703 4,627
82,338 78,214 160,552
M Total F T
137,301 131,152 268,453
1,384 616 2,000
138,685 131,768 270,453
206,819 204,278 411,097
17,456 10,027 27,483
224,275 214,305 438,580
344,120 335,430 679,550
18,840 10,643 29,483
362,960 346,073 709,033
GO
(1) In order to avoid double counting, pupils enrolled in special education due to long-term illness (type 5 special education) are not included in the figures. On 1 February 2015, there were 121 pupils in type 5 special nursery education and 253 pupils in type 5 special primary education. The average attendance between 1 February 2014 and 31 January 2015 in type 5 special nursery education is 126.56 pupils; for type 5 special primary education it is 209,38 pupils.
Regular elementary education number 400,000
380,197
320,000
280,000
250,391
22.9%
15.3%
22.9%
15.0%
257,424
269,197
265,953
262,603
268,453
240,000
school year
200,000 2009-2010
2010-2011
2011-2012
Regular nursery education
2012-2013
2013-2014
2014-2015
Regular primary education
Special elementary education number 30,000
Primary education
386,696
411,097
360,000
2 Distribution across the educational networks (nursery and primary education) Nursery education
381,983
399,729
392,351
27,705
28,225
28,566
28,481
28,307
1,962
1,975
1,986
2,023
2,042
2009-2010
2010-2011
27,483
24,000
GO 18,000
VGO
62.1%
61.8%
OGO 12,000
3 Distribution over the provinces (1) 6,000
120,000 number 7,692
625
138
0 11.768 12,499
100,000
80,000
16,448
BCR
6,031
2,000 school year
Special nursery education
2011-2012
2012-2013
2013-2014
2014-2015
Special primary education
4,022
571
Regular nursery education
5,257 415 60,000
Special nursery education
275 4,481
Regular primary education
383 40,000
Special primary education
356 (1)
Not included in the chart: Hainaut Province
20,000 76,646 0
115,315
Antwerp
54,267
82,607
Flemish Brabant and BCR
43,392 67,856
West Flanders
60,664
93,968
East Flanders
33,443
51,292
Limburg
province
Flemish education in figures | school year 2014-2015 | 11