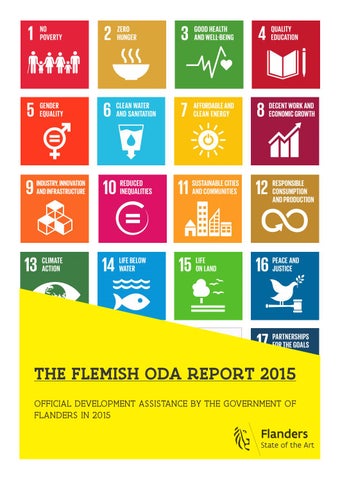
THE FLEMISH ODA REPORT 2015 OFFICIAL DEVELOPMENT ASSISTANCE BY THE GOVERNMENT OF FLANDERS IN 2015
1
2
THE FLEMISH ODA REPORT 2015
OFFICIAL DEVELOPMENT ASSISTANCE BY THE GOVERNMENT OF FLANDERS IN 2015
3
Table of contents 1. Introduction 5 1.1 1.2
5 6
2. The 2030 Agenda for Sustainable Development of the United Nations
7
2.1 2.2
Flemish ODA ≠budget expenditures for development cooperation Consulting project information via the online database
The 17 sustainable development goals (SDGs) The involvement of Flanders in the SDGs
8 9
3. Allocation pattern of Flemish ODA 12 3.1 3.2 3.3
Overview of the ODA for projects in the North and in the South Policy indicators about the Flemish ODA The Flemish ODA in an international context.
4. Overview of the budget expenditures for development cooperation 4.1 4.2 4.3
The budget for development assistance and the official development assistance (ODA). Introduction: a focused development assistance policy Policy indicators about the Flemish development assistance
5. International climate finance 5.1 5.2 5.3 5.4
What is international climate finance? International climate finance: not to be confused with emissions trading How does Flanders measure its contribution to international climate finance? Breakdown of the Flemish international climate finance
12 16 23
26
26 28 30
36
36 37 37 38
4
1. INTRODUCTION The Flemish ODA Report 2015 provides an overview of all payments made by the Government of Flanders for development cooperation. Official development assistance is defined as those flows to countries and territories on the DAC List of ODA Recipients (available at www.oecd.org/dac/stats/daclist) and to multilateral development institutions which are: i. provided by official agencies, including state and local governments, or by their executive agencies; and ii. each transaction of which: a) is administered with the promotion of the economic development and welfare of developing countries as its main objective; and b) is concessional in character and conveys a grant element of at least 25 per cent Under the terms of the Flemish Framework Decree on Development Cooperation, the annual ODA report is required to be delivered to the Flemish Parliament. The report lists the measures taken by the Government of Flanders to contribute to the international target of spending 0.7% of the Gross National Income on ODA (Flemish Framework Decree on Development Cooperation Act, Art. 23 and 24). The Government of Flanders delivers this report to the federal authorities, more specifically the DirectorateGeneral for Development Cooperation and Humanitarian Aid (DGD). This Directorate then bundles together all ODA originating from the Belgian territory and submits a complete report to the Organisation for Economic Cooperation and Development (OECD).
1.1 FLEMISH ODA ≠BUDGET EXPENDITURES FOR DEVELOPMENT COOPERATION
The total ODA is the total of the budget expenditure for development assistance and other ODAeligible expenditures of the Government of Flanders. The expenditures from the budget for development assistance represent more than 50% of the total ODA. The Flemish development policy is managed by the Flanders Department of Foreign Affairs. The Flemish Framework Decree on Development Cooperation sets out a separate budget programme for development cooperation, the amount of which is determined by the Flemish Parliament each year. All expenditures from this budget programme must meet the international ODA criteria. By means of this publication the Government of Flanders reports on the expenditures from this budget programme (Flemish Framework Decree on development cooperation, Article 22).1 Alongside expenditures from the Flemish development policy, other Flemish public entities also provide support to organisations, projects and programmes that are aimed at promoting development in the south. Where such expenditures comply with the ODA criteria, they too are included in this report. To avoid confusion between the set of ODA and the subset of the budget expenditures for development assistance, the ODA report breaks down both sets by chapter. The diagonal colour strip in the heading and footer indicates whether the chapter deals with: - - -
An overview of total ODA (blue) An overview of the budget expenditures for development cooperation (red) An overview of the Flemish contribution for climate finance (green).
1  Further information is available from http://www.vlaanderen.be/int/en/development-cooperation
5
1.2 CONSULTING PROJECT INFORMATION VIA THE ONLINE DATABASE To consult specific data on the Flemish ODA, users may consult the online database specified below. Several parameters can be used to run searches. Apart from the financial information, the search results also specify the logical framework and (if available) the actual project planning documents. As such, this digital module enhances transparency of the Flemish development policy. The search module is also available at the website of the Flanders Department of Foreign Affairs (link: http://www.vlaanderen.be/int/en/flemish-oda). This website contains hyperlinks to the database.
SELECT YOUR SEARCH INDICATOR
Recipients:
breakdown according to recipient status (government, NGO, UN body, etc.)
Sector:
breakdown according to sectors to which the flow of aid is directed
Region:
breakdown according to recipient region
Country:
breakdown according to the recipient country
Expenditure type:
breakdown according to policy purpose (bilateral, indirect, multilateral aid, etc.)
Year: (ODA year)
breakdown according to year of disbursement
Policy area:
breakdown according to Flemish policy area (and underlying entities) which put up the ODA
WEB ADDRESS http://www.vlaanderen.be/int/oda/recipients
http://www.vlaanderen.be/int/oda/sectors
http://www.vlaanderen.be/int/oda/region http://www.vlaanderen.be/int/oda/countries http://www.vlaanderen.be/int/oda/cooperationform
http://www.vlaanderen.be/int/oda/year http://www.vlaanderen.be/int/oda/policydomain
6
2. THE 2030 AGENDA FOR SUSTAINABLE DEVELOPMENT OF THE UNITED NATIONS On 25 September 2015, the General Assembly of the United Nations formally approved the 2030 Agenda for Sustainable Development of the United Nations. The 2030 Agenda provides a universal framework for all countries to eradicate poverty and achieve sustainable development by 2030. The agenda lists 17 sustainable development goals. The 2030 Agenda builds on the success factors of the Millennium development goals. Recent years have taught the international community that working towards tangible, measurable international goals can achieve impressive results. Today there is significantly less poverty, starvation, illiteracy, child and maternal mortality in the world than in 1990. Considerably more people have access to potable water, malaria nets and AIDS inhibitors. In addition, the 2030 Agenda for Sustainable Development also draws lessons from the shortcomings of the previous framework of objectives. For instance, the Millennium development goals were highly geared towards social indicators, and insufficiently addressed the ecological and economic dimensions of development. In addition, the Millennium development goals only related to target figures for developing countries and obligations on the donor nations. Finally, they left too much room for combating just the symptoms, which left them insufficiently inducive to tackle the structural causes of poverty and inequality. The new 2030 Agenda acknowledges an inextricable link between the social, economic and ecological dimensions of sustainable development. After all, poverty reduction is not merely a question of social measures. Economic growth is essential to create prosperity, but this growth is sustainable only if it respects the carrying capacity of planet Earth. The successful amalgamation of these dimensions offers prospects for all countries to improve and maintain the long-term prosperity and welfare of their citizens.
with the prevention of malnourishment and obesity. All countries in the world are committed to implement the sustainable development goals in line with the country-specific context. This new, extremely broad agenda, also presupposes an evolution from a strictly sectoral towards a multi-sectoral approach. In doing so, all building blocks for solutions to highly complex problems can be provided at the same time. When implementing the Agenda, one must also aim at the crosscutting linkages between the various goals. For example, health is not just a matter of quality medical services. Many factors determine good health results: access to fresh water, better hygienic practices, healthy eating habits, a healthy urban environment without harmful emissions or noise pollution, etc. This example indicates that the sectoral approach is no longer sufficient to address complex global challenges. Finally it recognises that success at the roll out of this agenda depends on the efforts of all relevant actors. From all governments (European, federal and subnational), across the private sector and civil society, to the knowledge institutions and the individual citizens, all must bundle their strengths and their material resources in order to initiate the envisioned social transition to a sustainable planet.
The breakdown according to developing country and industrial country blurs in this new framework. Many problems are universal, such as the pursuit of sustainable food consumption for instance, which is simultaneously linked
7
2.1 THE 17 SUSTAINABLE DEVELOPMENT GOALS (SDGS) Below you will find an overview of the 17 SDGs. Each SDG also contains underlying goals that more specifically address important elements for achieving the SDG. The 2030 Agenda as a whole sets out 17 sustainable development goals and 169 targets.2 SDG 1: End poverty in all its forms everywhere
SDG 2: End hunger, achieve food security, improve nutrition and promote sustainable agriculture
SDG 3: Ensure a healthy lives and promote welfare for all at all ages
SDG 4: Ensure inclusive and equitable quality education and promote lifelong learning opportunities for all
SDG 5: Achieve gender equality and empower all women and girls
SDG 6: Ensure availability and sustainable management of water and sanitation for all
SDG 7: Ensure access to affordable, reliable, sustainable and modern energy for all
SDG 8: Promote sustained, inclusive and sustainable economic growth, full and productive employment and decent work for all
SDG 9: Build resilient infrastructure, promote inclusive and sustainable industrialisation and foster innovation
SDG 10: Reduce inequality within and between countries
SDG 11: Make cities and human settlements inclusive, safe, resilient and sustainable
SDG 12: Ensure sustainable consumption and production patterns
SDG 13: Take urgent action to combat climate change and its impacts
SDG 14: Conserve and sustainably use the oceans, seas and marine resources for sustainable development
SDG 15: Protect, restore and promote sustainable use of terrestrial ecosystems, sustainably manage forests, combat desertification, and halt and reverse land degradation and halt biodiversity loss
SDG 16: Promote peaceful and inclusive societies for sustainable development, provide access to justice for all and build effective, accountable and inclusive institutions at all levels. SDG 17: Strengthen the means of implementation and revitalise the global partnership for sustainable development
2  More information about the composition of the goals and sub-goals is available online at: https://sustainabledevelopment.un.org/content/documents/21252030%20Agenda%20for%20Sustainable%20Development%20web.pdf
8
2.2 THE INVOLVEMENT OF FLANDERS IN THE SDGS From the outset, the Government of Flanders was involved in negotiations about the SDGs. Early involvement helps to see the goals find their way into foreign and domestic policy. The Government of Flanders was involved through various channels and with various instruments: • Flanders exerted influence on the Belgian position in multilateral institutions and the EU within the internal Belgian coordination meetings. • Flemish experts were involved in the internalBelgian technical forum (at civil service level) around the SDGs, namely the international working group of the Interdepartmental Committee of Sustainable Development (abbreviated to: ICDO) and in the various preparatory meetings at UN level. • A representative of the Flanders Department of Foreign Affairs was part of the Belgian delegation to the 70th General Assembly of the United Nations, which was partly dedicated to this process. • The Government of Flanders was also involved in charting possible indicators as part of the indicator framework for the Sustainable Development Goals (SDGs). Early involvement ensures that the Government of Flanders can make the necessary preparations for an initial report about the SDGs. The Research Centre of the Government of Flanders plays an important role in this within Flanders.
After the official ratification of this new framework for sustainable development by the General Assembly, the Government of Flanders will move forward to transform the goals into policy. • In the policy memorandum from the Minister for Development assistance (2014-2019), the explicit commitment is expressed to focus the development policy on the 2030 Agenda. Within the Global Challenges Division of the Flanders Department of Foreign Affairs, a broad policy process was initiated in the autumn of 2015 to translate the goals into the Flemish policy. On 18 April 2016, the external stakeholders will be consulted about this during the States-General for the Flemish development assistance. • A transformation towards a more sustainable society is also necessary concerning the domestic powers in Flanders. The “Vision 2050: A long-term strategy for Flanders” - which is at the same time the new Flemish Strategy for Sustainable Development (VSDO) - has firmly anchored the SDGs in the long-term strategy. In this way, the SDGs become a touchstone for the general policy over the years ahead. On 8 June 2016, the Sustainability Centre of expertise is organising an event that specifically deals with the actual implementation of and commitment to the SDGs in Flanders.
9
10
OVERVIEW OF THE FLEMISH ODA
11
3. ALLOCATION PATTERN OF FLEMISH ODA 3.1 OVERVIEW OF THE ODA FOR PROJECTS IN THE NORTH AND IN THE SOUTH This chapter offers an overview of the ODA, broken down according to projects in the South (3.1.1), Northern cooperation (3.1.2) and administrative costs.
In 2015, the Flemish ODA amounted to EUR 55,399,743. Of this, EUR 30,062,996 or 54% is for projects in the South. Flanders invests these resources in projects, programmes and funds in developing countries. Within the Southern cooperation, the appropriations were as follows: - 70.1% to the priority region of Southern Africa1 - 16.1% to unearmarked aid (multilateral cooperation) - 13.8% to other regions in the world The Northern cooperation amounts to EUR 24,110,005 or 44% of the total ODA. These contributions benefit domestic actors who play an important role in the field of development cooperation. In the first instance, these funds do not leave the country. They may have an indirect effect, however, on the socio-economic development in the south. Finally, the Flanders Department of Foreign Affairs charged administrative costs that are necessary to develop and implement development cooperation. In 2015 these costs accounted for 2.2% of total ODA.
1 In 2015, the allocations to the region ‘Southern Africa’, excluding administrative costs, were EUR 21,069,759. These expenditures are available to be consulted on http://www.vlaanderen.be/int/oda/region
12
3.1.1
Southern cooperation
The table below shows a summary of all allocations that directly benefit developing countries. These contributions fall within the category “southern cooperation”.
Southern Cooperation (Euro)
Total: 30,062,996
Types of expenditures for Southern cooperation
South Africa Mozambique Malawi Southern Africa (region) Other
Total
Bilateral (direct)
Bilateral (indirect)
Bi-Multi
6,536,569
5,366,406
11,415,592
23,318,568
87,500 2,314,069 4,135,000
1,042,795 2,414,409 1,081,946 705,255 122,000
3,575,576 693,449 3,302,649 1,700,250 2,143,668
4,705,871 5,421,927 8,519,595 2,405,505 2,265,668
Multilateral cooperation (unearmarked contributions) Green Climate Fund (GCF) Central Emergency Response Fund (Ocha) Unicef International Joint United Nations Programme on HIV/AIDS (UNAIDS) Funding for environmental conventions (UNFCCC, UNEP, UNECE) International Seed Testing Organisation (ISTA)
4,853084 3,500,000 600,000 250,000 250,000 247,444 5,640
Indirect cooperation Applied scientific research in developing countries Flemish Partnership Water for Development Scholarships and training (implemented in developing countries) Flemish Fund for Tropical Forests
1,446,515 378,880 738,989 154,060 174,586
Humanitarian aid (excluding Bi-Multi or multilateral contributions to WFP, CERF, UNRWA)
444,828
Bilateral cooperation relates to types of cooperation that are based on an agreement between the government of Flanders and a Flemish development cooperation partner country. Flanders is seen to focus its policy on South Africa, Mozambique and Malawi. This cooperation is described in the five-year strategy papers which lay down the priorities for cooperation. As far as the regionally-oriented and cross-border programmes are concerned, the focus goes out to Southern Africa. Direct bilateral cooperation – i.e. government-to-government support – amounts to EUR 6.5 million. Under indirect bilateral cooperation (EUR 4 million) local, international or Flemish organisations are called upon to implement the strategy paper with a partner country. The Bi-Multi category (EUR 11.4 million) includes all contributions to multilateral institutions which are earmarked either geographically or thematically. Bi-Multi encompasses UN programmes as part of the bilateral cooperation, as well as flanking initiatives aimed at several countries.
13
Within Bi-Multi, a total of EUR 9.3 million was disbursed in the partner countries or in the Southern African region. The remaining 2.1 million for Bi-Multi relates to programmes that are thematically earmarked (not geographically), such as the Trust Funds with the International Labour Organisation and UNESCO. The table below shows the breakdown of the Bi-Multi according to organisation. Bi-Multi: in 2015 earmarked resources per UN organisations (Euro)
International Labour Organisation (ILO)
11,415,592
3,400,000
United Nations Educational, Scientific and Cultural Organisation (UNESCO)
2,277,995
Food and Agricultural Organisation of the United Nations (FAO)
1,300,000
World Agroforestry Centre (ICRAF)
1,183,949
World Health Organisation
750,000
One UN Fund Malawi
694,500
Joint United Nations Programme on HIV/AIDS (UNAIDS)
500,000
Unicef
500,000
United Nations World Food Programme (WFP)
628,149
One UN Fund Mozambique
164,500
Council of Europe
16,500
Multilateral cooperation - whereby contributions are fully subsumed in the budget of a multilateral organisation - totals EUR 4.9 million. Unearmarked aid allows for flexibility for organisations to disburse the Flemish contributions according to ever-changing needs. Indirect cooperation in the south in 2015 amounts to EUR 1.4 million. With indirect cooperation, the expertise of an indirect actor (i.e. NGO, scientific institute, non-profitmaking organisation) contributes to the development and implementation of an actual project, but outside the framework of the bilateral strategy papers with the partner countries. Within the context of projects in the south, we can discern a number of cooperation initiatives that are geared toward the pursuit of a specific target. The Flemish Water for Development Partnership works to achieve water-
related goals. The Flemish Fund for Tropical Forests concentrates on the benefits of forestry and forest management to serve economic development, adapting to climate change, the loss of biodiversity and the fight against desertification in developing countries. In the context of the international cooperation, Flanders also provides assistance to areas affected by natural or man-made disasters. In 2015, a total of EUR 1.8 million was spent on humanitarian aid. Of this, EUR 1.4 million was disbursed through UN organisations (CERF, the One UN Funds, World Food Programme and UNESCO). Humanitarian aid disbursements – excluding Bi-Multi and multilateral cooperation – stood at EUR 0.4 million.
In 2015, multilateral institutes received 31% of the Flemish ODA in the form of multilateral support (EUR 4.85 million) or as Bi-Multi aid (EUR 11.42 million)
UNESCO headquarters, Paris 14
3.1.2
Northern cooperation
The table below shows a summary of all expenditures benefiting domestic actors, which have an indirect positive impact on development issues.
Northern cooperation (Euro)
total: 26,073,748
Types of expenditures for projects under the Northern cooperation (Euro) Scientific research and education
16,843,000
Institute of Tropical Medicine Antwerp (ITG)
13,186,000
Institute of Development Policy and Management (IOB)
2,697,000
United Nations University (UNU)
960,000
Development education and awareness-raising
1,439,020
Assistance to NGOs and/or non-profitmaking organisations
2,222,833
Municipal development cooperation Municipal development cooperation
2,857,727 2,661,606
Association of Flemish Cities and Municipalities VZW
196,121
Scholarships and training (implemented in developing countries) Roughly 70% of the resources for the Northern cooperation goes to development-relevant scientific research and education. The Antwerp Institute of Tropical Medicine specialises in research, education and service provision in the field of tropical medicine, as well as the organisation of health care services in developing countries. The institute of Development Policy and Management provides continuing academic education, conducts scientific research and offers social services relating to the economic, political and social aspects of development policy and management. The United Nations University (UNU) conducts research into global challenges that fall within the UN’s sphere of interest: peace and good governance, development, environment, science and technology. The expenditures within the framework of development education and awareness-raising amounts to EUR 1.4 million. This policy aims at involving citizens in NorthSouth relationships and to contribute to an increased awareness of the development issues. By increasing support for poverty reduction, the individual Flemish citizen gains a stronger sense of responsibility. Cities
3.1.3
747,425
and municipalities maintain direct access to their citizens and are therefore in a unique position to raise awareness among difficult-to-reach target groups. EUR 2.9 million was spent on the incentives policy for municipal development cooperation. As part of its Northern cooperation too, the Government of Flanders provides support for NGOs (EUR 2.2 million) in the form of wage and operating subsidies. As civil society actors in the field of development cooperation, they have a key role to play in raising public support, as a watchdog with regard to government action and as innovative developers of projects in the south. Enabling students in the south to enrol for specific training programmes in Flanders indirectly reinforces the capacity in their own countries of origin. Scholarships implemented in the donor country account for EUR 0.7 million in 2015.
Find out more?
If you would like more details on the composition of the ODA based on the types of expenditures listed above, please consult the ‘type of expenditure’ list at: http://www.vlaanderen.be/int/oda/cooperationform
15
3.2 POLICY INDICATORS ABOUT THE FLEMISH ODA The breakdown outlined above – Northern cooperation, Southern cooperation and administrative costs – does not yet offer any insight into the sectoral breakdown, the choice of partners, the provenance of the resources, or other policy information. This chapter takes a closer look at a number of additional indicators. Where possible, the evolution over the past 5 years is shown.
3.2.1
Breakdown of ODA according to recipient region and country
The recipients of Flemish ODA operate in a number of regions around the world. In order to gain an understanding of the geographical spread of the ODA, the table below clusters together the recipient regions.1 The underlying projects and programmes, arranged according to region and country, are available to be consulted online at: http://www.vlaanderen.be/int/oda/region disbursement (€)
Regions receiving Flemish ODA in 2015
relative share
Unearmaked (Southern cooperation)
4,853,084
15.9%
Africa
22,351,296
73.1%
North Africa
147,000
0.5%
Sahel
164,104
0.5%
256,829
0.8%
Central Africa
81,160
0.3%
East Africa
91,078
0.3%
21,366,127
69.8%
Malawi
8,532,967
27.9%
South Africa
5,421,928
17.7%
Mozambique
4,770,180
15.6%
Sub-regional / other countries in the region
2,641,053
8.6%
1,447,570
4.7%
Asia
792,342
2.6%
Various regions at programme level
693,566
2.3%
Middle East/Middle East and North Africa (MENA)
381,000
1.2%
72,500
0.2%
Of which:
West Africa
Southern Africa Of which:
Latin America / Caribbean
Central and Eastern Europe
1 These total expenditures per country in Southern Africa comprise all ODA: for (in)direct bilateral cooperation, Bi-Multi, indirect cooperation, administrative costs, scholarships to enrol for study programmes in Flanders and relief aid. For this reason, the totals per region and country may derogate from the figures shown in the table in chapter 3.1.1. Southern cooperation (p. 13), which only breaks down the expenditures for (in)direct bilateral cooperation and Bi-Multi geographically.
16
3.2.2 Breakdown of ODA according to recipient The chart below groups the recipients of the Flemish ODA. The underlying projects and programmes, arranged according to recipient group, are available to be consulted online at: http://www.vlaanderen.be/int/oda/recipients
Flanders traditionally channels a substantial portion - on average around 30 percent - of its ODA via scientific institutes. In 2015, they accounted for 32.9% of the Flemish ODA 2015, i.e. a disbursement of EUR 18.2 million. In 2015, the Institute of Tropical medicine received a total of EUR 13.3 million in structural support because it implemented structural cooperation with a Mozambican scientific health institute.
NGOs and non-profitmaking organisations together received 16.6%, or EUR 9.2 million, of the ODA in 2015. This percentage is the sum of the portion of Flemish NGOs and non-profit organisations (11.6%), local NGOs (1.4%) and international NGOs (3.6%). These actors operate as the implementing partners of development programmes, but also receive assistance for their general wage and operating expenses.
The portion allocated to multilateral institutions remained unchanged at 27 to 28% of total spending during the 2011-2015 period. In 2014, the portion allocated to multilateral institutions amounted to 31.1%. This includes both core support which is directly subsumed in the institution’s general budget (categorised as multilateral aid) and geographically or thematically earmarked contributions (categorised as ‘Bi-Multi’). In order to maximise synergies with the bilateral development policies in the partner countries, Flanders concentrates its contributions on the countries in Southern Africa. UN agencies also serve as implementing partners of bilateral cooperation with the partner countries.
A total of 8.6% of the Flemish ODA was paid out directly to the governments of South Africa, Mozambique and Malawi. Cooperation with governments in partner countries is funded almost entirely with resources from the budget for development cooperation. Lastly, 4.6% of the ODA goes to domestic cities and municipalities in order to increase public support for development cooperation. These subsidies are also wholly derived from the budget for development cooperation. The ‘Other’ category bundles together all expenditures which does not belong in any of the other recipient categories. It mainly encompasses management costs for the implementation of development policy.
17
3.2.3 Breakdown of ODA according to sector Flemish ODA spending per sector is detailed below. The OECD Development Assistance Committee has fine-tuned this system for coding by sector. It is important to know that the objective of a project determines the sectoral coding and not the way in which a project aims to meet its goals. For example, construction of housing for experts working on an agricultural development project is coded as “agricultural development” and not “housing policy and administrative management”. The breakdown per sector and the underlying projects and programmes are available to be consulted at: http://www.vlaanderen.be/int/oda/sectors
The number of supported sectors within the total ODA is relatively high (compared to the ODA derived from the budget for development assistance, see chapter 4.1.1). The Flemish ODA 2015 is concentrated on the sectors health, including sexual and reproductive health (31%), environmental protection, water provision, energy and forestry(14%), agriculture, fisheries and food aid (11%), and education (8%). These four largest sectors together represent 64% of the ODA. Since 2010, we have identified a growing importance of the sectors environmental protection, water supply, energy and forestry. In 2015 the share of this rose to 14% of the total ODA (while in 2009 this share was just 3%). Possibly the goals on international climate financing have led to this increase.
The refocusing in South Africa on job creation by means of social entrepreneurship and KMMO development can also be seen in the increase (since 2013) of the expenditures for trade, industry and companies (8% in 2015). In 2015, 2.2% of the total ODA was spent on administrative costs. These resources are intended for assessments, audits and staff costs of officers for development assistance. On 13 January 2016, the Flemish Parliament adopted a resolution on the importance of education in the Flemish development assistance – available on:
https://docs.vlaamsparlement.be/docs/stukken/2014-2015/ g439-3.pdf
18
The focus on education is not only reflected in the share of the ODA (8%) with the purpose code for education. Sector codes measures the general objective of an intervention and not the operational strategy, goods or services to achieve this goal. Projects with a different sectoral goal than education also focus on training, scientific study and education. In 2015, 46.6% of the ODA was directed at education in the broadest sense (life-long learning, education, higher education, research, etc.)1
1  The various OESA DAC sub sectors relevant for research, personal education and training (green bar in the graph) are the following: 12261 health education; 12281 health personnel development; 13081 personnel development for population and reproductive health; 31166 Agricultural extension; 31181 agricultural education/training; 31182 Agricultural research; 31281 forestry education and training; 31282 forestry research; 41082 Environmental research
3.2.4 Source of the Flemish ODA broken down according to policy area In 2015, 98% of the ODA derived from four policy areas: Flanders Foreign Affairs (IV); Education and Training (OV); Economy, Science and Innovation (EWI); Environment, Nature and Energy (LNE). The relative portion of IV decreased between 2013 and 2015 from 62% to 54.7% because of two trends.
On the one hand, IV spent EUR 4.7 million less in 2015 compared to 2013 and on the other hand the contribution from all other policy areas increased by EUR 4 million between 2013 and 2015. A large portion of the increase is to be attributed to a one-off EUR 3.5 million contribution from the LNE policy area to the Green Climate Fund.
This breakdown of the ODA according to policy area is available to be consulted at: http://www.vlaanderen.be/int/oda/policydomain 19
Belize Barrier Reef The policy areas Flanders Foreign Affairs and Economy, Science and Innovation work together with UNESCO on the protection of underwater heritage and coastal management.
Š Catlin Seaview Survey 20
3.2.5 General composition of the Flemish ODA Flanders Foreign Affairs (IV) is the policy area that manages the ODA expenditure from the budget for development assistance. Based on the expenditures for, on the one hand, the policy areas EWI, OV and IV and on the other the remaining policy areas, we can roughly divide the ODA into four blocks (see the graph below).
The blue bar chart in the graph above shows the expenditures from the budget for development assistance. These expenditures was almost EUR 3.5 million less in 2015 than in 2013. In 2015, a saving of more than 10% was implemented on the budget for development assistance (see chapter 4 about the budget expenditures for development assistance The financing of scientific institutes and universities (red bar chart) has remained fairly constant for the past five years. This assistance is largely recorded in agreements that provide for an annual indexing, which leads to a more stable progression of expenditures. The subsidies are derived primarily from the policy areas of Education and Training (OV) and Economy, Science and Innovation (EWI). Scientific research is largely undertaken in the healthcare and environmental protection areas. The green bar chart refers to the additional expenditure by the Environment, Nature and Energy Policy Area (LNE) in the context of international climate finance: in 2014, LNE supported the Adaptation Fund. In 2015 the assistance was allocated to the Green Climate Fund. Since both are recognised by the OECD as a 100% relevant development institute, each OECD-DAC donor must report the expenditure on these organisations within its ODA. In Chapter 5 we shall delve deeper into the theme of international climate finance.
The purple bar chart is a residual category. This shows all the other efforts by the Government of Flanders (not from the budget of development assistance). This share, paid by various policy areas, has shown, due to the austerity measures with the Government of Flanders, a continuously declining trend. In 2009, EUR 11.9 million fell within this category. The modest increase of this expenditure in 2014 appears to have been completely negated in 2015. The orange line shows the evolution of the ‘Country Programmable Aid’ (CPA) share. These are resources that partner countries can programme, and which are derived from the budget for development assistance. This indicator focuses on the essence of development assistance. Expenditures that is derived from the 5-year strategy papers with the partner countries belong under CPA, contrary to the country non-programmable expenditures for humanitarian aid, food aid, operating expenses for Flemish NGOs, development awareness and administrative costs. After a decline of the CPA in 2014, the share of CPA rose again in 2015 to 40%.
21
3.2.6 Types of aid
Since the Paris Declaration on Aid Effectiveness (2005), the international donor community attaches greater importance to coordinating donor aid with the existing policy aims of recipient countries. The harmonisation of procedures for implementing aid among donor nations is also high on the agenda. In order to measure donor progress on this front, OECD developed a breakdown according to types of aid which contains information on the way in which the projects, programmes and funds are established.
In amongst other things, this enables us to ascertain whether a donor primarily resorts to project aid that has been sent separately, or whether the donor is deploying its aid via pre-existing programmes or funds of the recipient government, UN institutions and/or a group of donor nations. Project aid that is set up separately is often associated with relatively high costs related to its identification, follow-up and other administrative tasks. On the other hand, project aid offers more opportunities to concentrate the aid on bilateral priorities. The table below shows the breakdown for 2013, 2014 and 2015.
TYPES OF AID A02 Sector budget support
ODA 2013 4 700 000 €
ODA 2014 2 996 300 €
ODA 2015 2 971 086 €
16 796 564 €
18 915 405 €
18 105 833 €
2 742 141 €
3 582 725 €
5 813 084 €
3 140 000 €
6 144 936 €
2 609 000 €
500 000 €
0€
0€
19 135 187 €
16 406 644 €
18 887 023 €
Experts and other technical assistance
1 215 483 €
928 417 €
742 803 €
E01 Scholarships/training in donor country
1 098 568 €
1 023 300 €
747 425 €
G01 Administrative costs
3 030 565 €
1 471 411 €
1 226 742 €
3 731 678 €
5 078 043 €
4 296 746 €
B01
Core support to NGOs, other private bodies, PPPs and research institutes
B02 Core contributions to multilateral institutions
Contributions to specific-purpose programmes and
B03 funds managed by international organisations (multilat-
eral, INGO)
B04 Basket funds/pooled funding C01 Project-type interventions D0
H01 Development awareness
Together with other international donors, Flanders supports sectoral funds in Malawi and Mozambique (type A02). Through this mechanism the donor nations align their contributions with the policy plans of the recipient country and ensure an effective financial management of the ministry.
B03) the donor does not exercise any influence over the way in which the subsidies are ultimately allocated to projects. Flanders supported existing programmes of the UN Development Programme (UNDP), the United Nations Children’s Fund (UNICEF), UNAIDs, and the World Health Organisation.
In 2015, the portion of unearmarked contributions to multilateral institutions (B02) increased. Apart from the contributions for multilateral cooperation (projects in the South), the United Nations University (UNU) also received an unearmarked contribution (Northern cooperation).
Project-type interventions (CO1) form the largest aid category within Flemish ODA. According to the OECD, a ‘project’ is: “A project is a set of inputs, activities and outputs, agreed with the partner country, to reach specific objectives/outcomes within a defined time frame, with a defined budget and a defined geographical area.” The scope of the projects varies considerably. A lot of partnerships between the government of Flanders and the partner countries are implemented pursuant of project agreements.
The unearmarked contributions to the scientific institutes – Institute of Tropical Medicine and Institute of Development Policy and Management (EUR 15.8 million) and the wage subsidies for Flemish NGOs (EUR 1.5 million) explain the high portion of core support to NGOs and research institutes (B01). For subsidies to specific-purpose programmes and funds managed by international organisations (type
Finally, Flanders provides technical assistance, scholarships and development awareness in the North. The management of the development policy also involves administrative costs. 22
3.3 THE FLEMISH ODA IN AN INTERNATIONAL CONTEXT. The contribution by Flanders is part of a larger whole. A considerable number of international bilateral donors are active in the partner countries. The table below offers insight into the order of magnitude of the Flemish contribution in proportion to the total bilateral ODA (excluding contributions from multilateral UN institutions, development banks and the EU). Based on a ranking of donor nations in descending order of size, the table below indicates which position Flanders occupies in the bilateral ranking. Because figures for the 2015 ODA of other donors were not yet available when this report was being written, this comparison is made until 2014. FLEMISH ODA IN THE PARTNER COUNTRIES 2011 2012
2013
2014
South Africa Flemish ODA (€)
3,540,573
5,455,376
4,668,102
2,218,664
Position in donor ranking
16
12
14
15
% of the bilateral ODA
0.51%
0.81%
0.53%
0.30%
Flemish ODA (€)
7,930,012
2,952,536
8,713,647
4,547,828
Position in donor ranking
18
21
19
20
% of the bilateral ODA
0.64%
0.25%
0.67%
0.41%
Flemish ODA (€)
4,924,518
9,308,656
7,394,682
6,166,842
Position in donor ranking
9
8
9
8
% of the bilateral ODA
1.51%
1.85%
1.50%
1.46%
Mozambique
Malawi
The skyline of Tete, Mozambique at night © Veronique Schotte
23
24
OVERVIEW OF THE BUDGET EXPENDITURES FOR DEVELOPMENT COOPERATION
25
4. OVERVIEW OF THE BUDGET EXPENDITURES FOR DEVELOPMENT COOPERATION The expenditures from the budget for development assistance are part of the total ODA. This portion has grown significantly since 2008 to more than half of the ODA. Over the past 5 years, this portion has stabilised at around 55%.
In this chapter, we delve deeper into the pattern of spending from the budget for development cooperation. The Flanders Department of Foreign Affairs (DiV) manages the budget for development cooperation. In 2015, DiV spent a total of EUR 29,026,835 ODA from this budget.
4.1 THE BUDGET FOR DEVELOPMENT ASSISTANCE AND THE OFFICIAL DEVELOPMENT ASSISTANCE (ODA). The budget for development assistance consists of commitment appropriations and payment appropriations. Commitment appropriations are the resources used to take on new commitments for projects, programmes and funds. Once the sum total of the projects, programmes and funds has been laid down in the budget, this commitment is transformed into payment appropriations. A project for which a sum of EUR 900,000 has been committed, may have this sum total paid out in three tranches spread across three years, for instance. The budget therefore specifies a payment appropriation to the amount of EUR 300,000 per annum during each of these three years. Since the ODA measures the actual payments, the annual payment appropriations seem a good indication of the ODA to be expected that year. In practice, this does not always appear to be the case: - A delay in the implementation of a project or programme may mean that the tranche scheduled to be transacted during that particular year is not paid out. - Furthermore, payment appropriations and ODA employ a different time framework. The ODA focuses on the payments made during the time frame from 1 January to 31 December in a specific year. On the other hand, payment appropriations can also still be accessed during the first month of the following year.
The graph below shows the evolution of the payment appropriations, commitment appropriations and the ODA from the budget for development assistance. Since apparatus appropriations (resources for staff and operations) fall outside these budget figures, the ODA shown in this graph is reduced by the administrative costs. This allows the comparison to be made on an equal footing. In 2015, more than 10% of the budget for development assistance was cut compared to 2014 (or EUR 3 million). Yet the ODA from the budget for development assistance in 2015 did not fall by EUR 3 million. This is because at the start of 2015, a number of ODA appropriations were transacted using credits from the 2014 budget.
26
In due course, the decline of the commitment appropriations in 2015 and 2016 will also result in a decline in the payment appropriations (and consequently also in a fall in ODA). As the policy latitude for multi-year commitments shrinks, the payment appropriations in subsequent years are also seen to decline. As such, the cuts to the budget for development assistance in 2015 and 2016 will largely become apparent over the years ahead.
Mozambique has a coastline of no less than 2,500 km. Fisheries represent 4 percent of the Gross Domestic Product and 28% of the inflow of foreign currency. 27
4.2 INTRODUCTION: A FOCUSED DEVELOPMENT ASSISTANCE POLICY The implementation of the budget for development assistance is subject to: 1. The legal framework, namely the Framework Decree for development assistance, which sets out the conditions and principles for this policy. 2. The Minister’s policy memorandum as adopted by the Flemish Parliament (2014-2019), which establishes the priorities during this term of office 3. The cooperation partnerships (Memoranda of Understanding and strategy papers) agreed with the partner countries One of the most important principles of the Flemish development assistance is geographic and thematic concentration. This principle prevents the fragmentation of the scarce resources, which would undermine the sustainability of the Flemish commitment to the South. By focusing on a limited number of countries and themes, Flanders is able to reach agreements with
the authorities in the developing countries and with other donor nations about an international division of labouw in the area of development assistance. This is also a central focal point within the Paris Declaration on Aid Effectiveness and the European Consensus on Development Assistance.
The Flemish development assistance is geographically focused on Southern Africa (70% of the allocations in 2015). Around 4 percent of the budget expenditures in 2015 is not geographically earmarked: this is core support for international organisations. Almost a quarter of the appropriations in 2015 reflected the Northern cooperation in Flanders. This includes support for NGOs in Flanders, the impulse policy on municipal development cooperation, education and raising awareness of development issues, etc. Just 1.5% of expenditures go to other regions in the world. These are humanitarian funds, which are allocated in response to acute emergency situations and which are consequently not subject to the principle of geographic concentration.
In Southern Africa, the Flemish development assistance is committed to structural, bilateral cooperation with South Africa, Mozambique and Malawi. In all cases, cooperation with a partner country is formalised by way of a Memorandum of Understanding (MOU), which sets out the framework within which Flanders focuses on the development priorities of the partner country. The strategy papers set out the cooperation priorities for a five-year period. These papers contribute to making the aid more predictable. The following framework text offers insight into the thematic priorities of the cooperation with the partner countries in 2015.
28
The bilateral cooperation with Flemish partner countries
Flemish development assistance started in 1994 with South Africa as the first partner country. On 15 July 2011, the Government of Flanders adopted the second strategy paper 2012-2016 on development assistance. The focus rests with two priority sectors of the South African government: agriculture & food security, and job creation and entrepreneurship. The development assistance between Flanders and Mozambique formally got under way in 2002. The second strategy paper (2011-2015) wholly focuses on promoting the right to health of the Mozambican population. Within the healthcare sector, the cooperation focuses on: (1) the further development of a critical mass of well-trained and motivated healthcare workers; (2) supplying sound health research into and monitoring of diseases and epidemics; (3) promoting sexual and reproductive health and rights; (4) promoting good nutrition (and nutrition practices). On 28 April 2006, the Government of Flanders chose Malawi as the third partner country for the Flemish development assistance. The second strategy paper (2014-2018) concentrates entirely on agriculture and food security. Within the sector-wide approach (ASWAp) for agriculture & food security, Flanders acts as the ‘lead donor’ in the area of agricultural extension services. The ASWAp mainly focuses on: (1) food security and risk management; (2) commercial agriculture, the processing of agricultural products and market development; (3) sustainable management of agricultural land and water.
Š Guy Stubbs
Flanders stimulates the formal employment in South Africa, in amongst other things by way of support for the development of a fund for social enterprises, the so-called Social Enterprises Fund (SEF). This fund supports social and environmentally-friendly enterprises that have a major social impact on the local communities. African Honey Bee is one of the social enterprises that receives support from 29 this fund.
4.3 POLICY INDICATORS ABOUT THE FLEMISH DEVELOPMENT ASSISTANCE 4.3.1
Sectoral composition of the budget expenditures for development assistance
In the 2014-2019 policy memorandum, the Minister for Development Cooperation has chosen to increase the concentration of the aid. In order to create synergies in the region of Southern Africa, Flanders also plans flanking projects and programmes at regional level, which link up with one of the bilateral focus sectors. Doing so allows for the know-how and experience gleaned to spark
cross-fertilisation in other countries around the region. For humanitarian aid on the other hand, there is no geographic delimitation to allow a flexible response to be brought to urgent needs.
Health and reproductive health is the most important sector within the Flemish development cooperation, and represents 27.5% of all expenditures. It is the concentration sector in Mozambique. At regional level too, Flanders provides aid (through the World Health Organisation and UNAIDS). The contribution for healthcare in Malawi stems from a phased out commitment from the first strategy paper.
The cooperation in South Africa focuses on employment (sector: social infrastructure). The International Labour Organisation runs an employment project revolving around public procurement contracts in South Africa. In pursuing decent work, Flanders is seen to strategically focus on the development of enterprises (14.6% of the expenditures). At regional level too, that approach is being scaled up, with the expansion of the SEED initiative in Mozambique, Malawi and Namibia. In Flanders, general aid goes to the 2014-2016 Business Plan of Ex-change, an organisation that focuses on capacity development for the development of enterprises in developing countries.
The agriculture and food security sector represents 19.6% of the expenditures. Aid in which sector is concentrated to a maximum in Malawi.
The graph below shows that these sectoral and geographic policy choices are also reflected in the actual appropriations.
30
Democratic participation and human rights (government and civil society sector: 2.9%) are supported in Mozambique (more specifically directed at a civil organisation that promotes sexual and reproductive rights) and in South Africa (democratic participation in the area of climate policy, employment policy, agriculture). Through UNICEF, Flanders focuses on children’s rights in South Africa and Malawi. UNICEF also receives unearmarked aid. 4.5% of the expenditures is allocated to the environmental protection and forestry sectors. World Agroforestry Centre is responsible for programmes around agroforestry in Malawi and the Southern Africa region. In Malawi, Flanders focuses on the implementation of the National Climate plan.
Support for humanitarian aid (5.5%) goes to Malawi, Mozambique and regions other than Southern Africa. In 2015, CERF received EUR 600,000 in unearmarked aid, which allows the organisation to intervene swiftly in urgent needs. Expenditures that is spent in Flanders focuses on development education and raising awareness (14.8%), administrative costs (4.2%), general aid to NGOs (sector unspecified: 3.0%), general aid to Ex-change (KMMO development) and the Flemish Association for Development Cooperation and Technical Assistance (education).
Underlying projects and programmes linked to the sectors described above are available to be consulted at http://www.vlaanderen.be/int/oda/sectors
Š Mieke Govaerts In collaboration with the World Agroforestry Centre and the Malawian Ministry of Agriculture, Flanders supports innovative agroforestry schemes. Agroforestry leads to greater production, less use of fertilisers based on fossil fuels and a reduction in the exhaustion of the land. 31
4.3.2 Breakdown according to recipient of the budget expenditures for development cooperation Within the bilateral or regional development cooperation, it is appropriate to involve a wide variety of actors: - This helps spread the risk, taking into account the implementation capacity of various actors; - The support of the government in the partner country is essential to reinforce the long-term capacity of the partner country; - Support of the NGOs may contribute to a stronger involvement of the civil society in the policy of the partner country and increase the participation of citizens towards the policy; - Cooperation with multilateral organisations may lead to learning effects in other countries where the organisation is active. The graph below offers an overview of the actors who are supported from the budget for development cooperation.
Multilateral institutes are responsible for 34% of the appropriations for development assistance in 2015. These actors operate as implementers in all partner countries and Southern Africa as the concentration region. The institutions of the United Nations also receive unearmarked support. Governmental authorities in Mozambique and Malawi lay claim to 22.2% of all expenditures from the budget for development assistance in 2015. In both countries, the bulk of these resources go to the sectoral funds for healthcare (both countries) and agriculture and food security (in Malawi). NGOs both at home and abroad together take around 26.3% of the total expenditure. In addition to receiving aid as implementer in the partner countries and the concentration region, the NGOs also receive general aid and a contribution for implementing awareness raising projects in Flanders.
With regard to relief aid in regions other than Southern Africa, the NGOs were the unique implementer (Red Cross Flanders, UNICEF Belgium, Caritas and Doctors Without Borders). The limited share for scientific institutions (4.2%) stands in contrast with the large share within the total ODA (33%), which primarily derives from the specialist departments EWI and OV. In Mozambique, the Institute of Tropical Medicine (ITG) supports the capacity of the Instituto Nacional de SaĂşde (INS). In South Africa, Flanders works with the University of Cape Town and the Business School of the University of Pretoria. Flemish cities and municipalities receive 9.2% of the expenditures. Administrative costs (4.3%) miscellaneous category.
are
shown
in
the
The underlying projects and programmes, arranged according to recipient group, are available to be consulted online at: http://www.vlaanderen.be/int/oda/recipients 32
ersema rten Bo taal.nl. a a M Š ld mabee boerse Using rat technology, Apopo NPA focuses on raising the detection level for tuberculosis in Mozambique. The Clinica Nocturna (Mozambique) is a healthcare centre with a limited scope, chiefly offering HIV tests, diagnosis and treatment of sexually transferable diseases and family planning services. The night clinic has varied opening hours so that sex workers have easier access to the services provided.
Š International Centre for Reproductive Health (ICRH)
33
34
OVERVIEW OF THE FLEMISH INTERNATIONAL CLIMATE FINANCE
35
5. INTERNATIONAL CLIMATE FINANCE The annual ODA provides an overview of the Flemish contribution for international climate finance. In the following we sketch the specific context of international climate finance, and then briefly discuss a number of indicators that give an impression of the breakdown of that expenditure. In order to increase the transparency of the breakdown of the Flemish international climate finance, an online data portal has been created. This information is available to be consulted at: http://www.vlaanderen.be/int/en/climate-finance
5.1 WHAT IS INTERNATIONAL CLIMATE FINANCE? Climate financing aims to support developing countries in the climate challenges created by mankind. The funding can provide support for adaptation, mitigation or a combination of both of these goals. Below we offer an interpretation of these general categories of climate finance.
5.1.1
Adaptation (adjustment to climate change)
Financing of adaptation is aimed at minimising the negative impact of climate change on the living conditions in developing countries. A very specific example of adaptation is dyke construction along the coast. Adaptation measures help developing countries to build resilience against the impact of climate change. For example, many African countries are still very dependent upon smallholder agriculture, an economic activity which is particularly vulnerable to climate change, soil erosion and natural disasters. Investment in drought resistant crops, improved irrigation techniques, modified cultivation techniques, integrated water management, etc. help farmers to adapt to a changing climate. Adaptation is not restricted to the agricultural sector, or the economic sector. It can involve a whole range of sectors.
5.1.2
Mitigation (prevention of climate change)
Mitigation measures are aimed at limiting greenhouse gas emissions. Climate finance for mitigation may focus on green energy, energy efficiency, carbon capture and storage, among other things. It is an undeniable fact that, as their economies continue to grow strongly, the developing countries’ share in global emissions is increasing. If these countries were to go through a similar industrialisation process as that of Western countries during the 19th century, our climate would be facing huge global warming. Because the developing countries have less technical and financial resources to reorient their expanding economies to low-carbon growth, they are calling for climate finance.
5.1.3
Mitigation and adaptation (cross-cutting)
Climate finance may also respond to both objectives simultaneously (prevention of and adaptation to climate change). For example, multilateral contributions are made to the Green Climate Fund, the United Nations fund which invests in both adaptation and mitigation. Another example is agroforestry investment, which enables developing countries to set up climate proof activities, prevent further desertification and contributes to a decrease of greenhouse gas emissions.
36
5.2 INTERNATIONAL CLIMATE FINANCE: NOT TO BE CONFUSED WITH EMISSIONS TRADING Climate finance is not the same thing as emissions trading. The international climate policy sets out that when industrialised countries reduce emissions in developing countries they are allowed to net these reductions in emission levels in the way they achieve their emissions standards. Governments can purchase verified emission rights to achieve their own internal climate standards. In doing so, emission allowances are one of the many instruments of domestic climate policy. Climate finance, on the other hand, implies an additional commitment to provide financial support to developing countries, without the donor receiving emission allowances in return. This commitment is part of industrialised countries’ environment and development policies. It is aimed at the following objectives: 1/ reduced global emissions; 2/ greater involvement of developing countries in the global climate regime 3/ increased development opportunities in the south, in the context of climate change.
5.3 METHODOLOGY: HOW DOES FLANDERS MEASURE ITS CONTRIBUTION TO INTERNATIONAL CLIMATE FINANCE? Within Belgium, the basis for commitment in the area of climate finance is the domestic Belgian climate agreement of December 2015 (dealing with the implementation period 2013-2020). In this, Flanders commits to investing EUR 14.5 million annually from 2016 onwards in climate finance. Pursuant to the international commitments from the UN climate summits, the member states are making more resources available for climate finance. At this moment, however, there are no uniform international methodological regulations for surveying climate finance. It is the responsibility of each individual member state to ensure the relevance of each contribution for climate change in developing countries. Flanders acts in keeping with the approach adopted by many other European donor nations. Under this method, the donor carefully screens each project in terms of relevance to climate adaptation and mitigation. Based on this estimation, Flanders assigns quota to its support according to three scores for climate finance. Each score also determines the aid volume that is relevant for climate finance reporting.
ESTIMATION 0 1 2
Not relevant for climate finance Climate mitigation and adaptation are not the project's principal objectives, but are to a significant extent integrated into the planning and implementation of (and reporting on) the project. Climate mitigation and adaptation are the project's principal objectives
Chargeable share 0% 40% 100%
37
5.4 BREAKDOWN OF THE FLEMISH INTERNATIONAL CLIMATE FINANCE This chapter goes into greater detail about the breakdown of the international climate finance. A detailed list of the underlying projects and programmes since 2013 can be found at the website of the Flanders Department of Foreign Affairs:www.vlaanderen.be/int/klimaatfinanciering
5.4.1
Breakdown of climate finance 2015 according to policy area
The Flemish climate finance in 2015 was EUR 7,151,927. This contribution is largely derived from the policy areas Flanders Foreign Affairs (IV), Environment, Nature and Energy (LNE), and Economy, Science and Innovation (EWI).
Around half of the resources are from the policy area LNE. At the climate summit in Paris (COP 21) in December 2015, the Minister for the Environment Joke Schauvliege made a commitment to contribute EUR 3.5 million towards the Green Climate Fund. This fund has the ambition to grow into the most important global financing channel for international climate finance. In addition, the Flemish Fund for Tropical Forests and the Flemish Partnership Water for Development also contribute to tackling climate change in developing countries. Finally, voluntary contributions (UNFCCC Trust Fund for Supplementary Activities) are also relevant for climate finance. Mandatory appropriations for environmental conventions and institutions are not considered to be climate finance, considering the additionality-criterium.
Policy area IV spent around one third of the climate finance in 2015. The budget for development cooperation bears the lion’s share of the appropriations from the IV policy area. For the conclusion of climate projects, these appropriations are aimed at the focal points with the bilateral policy. Consequently, in Malawi the focus is on agroforestry and food security, and in South Africa on the development of environmentally-friendly enterprises. Finally, the EWI policy area contributed to climate finance in 2015. In cooperation with UNESCO, EWI reinforces climate-relevant research in developing countries. Here, the focus is on water (preparation for disasters, adapted coastal management, tackling water shortages, the fight against desertification, etc.).
38
5.4.2 Breakdown of climate finance 2015 per type Two thirds of the climate finance in 2015 is aimed at both mitigation and adaptation. The Green Climate Fund for example works simultaneously on both goals.
One fifth of the climate finance in 2015 focuses on the adaptation to climate change (adaptation). Adapting the food production to increasing climate-related stress factors is a good example of an adaptation project.
Decreasing emissions (mitigation) is responsible for 12% of the climate finance. From the cooperation between the EWI department and UNIDO, for example, study is undertaken into a more environmentally-friendly second generation bio-ethanol.
5.4.3 Breakdown of climate finance 2015 per region Half of the resources for climate finance in 2015 are not earmarked for a specific region (global). This is primarily for the funds for the Green Climate Fund.
Climate projects in Southern Africa (35%) are primarily derived from the budget for development cooperation and are in line with the development cooperation priorities in the partner countries.
The cooperation between the EWI policy area and UNESCO in the area of water supply is primarily aimed at Latin America and the Caribbean (10%).
39
5.4.4 Breakdown of climate finance 2015 per channel Half of the Flemish climate finance in 2015 was allocated via multilateral funding (in particular Green Climate Fund and the UNFCCC Trust Fund for Supplementary Activities).
Finance via the Bi-Multi channel (41%) means earmarked aid (projects and programmes) via multilateral institutions. The organisations with which Flanders cooperated in 2015 are World Agroforestry Centre, UNESCO, UNDP (One UN Fund). The SEED-initiative is a partnership programme between UNEP, UNDP and IUCN.
The bilateral climate finance consists mainly of projects by the Flemish Partnership Water for Development and the Flemish Fund for Tropical Forests.
5.4.5 Breakdown of climate finance 2015 per theme Almost 60 percent of the resources are directed in general at climate policy. This includes the contributions to the Green Climate Fund, the national climate plan in Malawi, the expansion of the knowledge network for climate change in South Africa, etc.
In addition, specific attention is paid to climate challenges within certain themes. For example, agriculture and food security in Southern Africa are very vulnerable to climate change. Flanders also focuses on strengthening the resilience of agriculture (7%) and improving agroforestry (6%), with a view to securing food security.
Via the International Labour Organisation and the SEED initiative, the focus is on sustainable employment (green jobs) (9%). UNESCO is an important partner for adaptation projects on coastal management (4%), land management and water (7%). Access to potable water and sanitation is also a priority of the Flemish Partnership Water for Development.
40
Š CIF Action In Southern Africa, climate change exerts a negative impact on agricultural production. Since the majority of the population in Southern Africa is strongly dependent on agriculture (to provide food security and as source of income), the climate exerts a strong impact on the development in this region.
41
Published by Koen Verlaeckt, Secretary-General, Flanders Department of Foreign Affairs Boudewijnlaan 30, 1000 Brussels Content and layout Simon Calcoen, Flanders Department of Foreign Affairs Printing Agency Facility Management, digital printing Depot number D/2016/3241/093 Edition April 2016 42
43
www.vlaanderen.be/int/en/flemish-oda
44