BASISONDERWIJS OVERVIEWLeerlingen School population 1 GENERAL 1 School population in Flemish education 2006-2007 Full-time education
Part-time secondary education
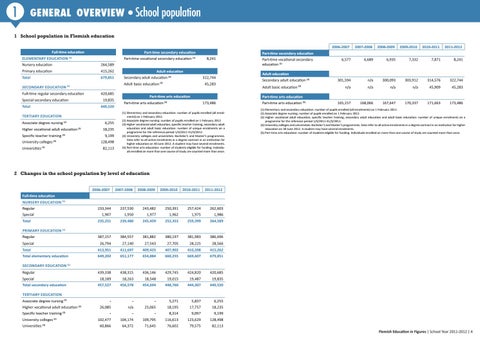
ELEMENTARY EDUCATION (1)
Part-time vocational secondary education (1)
Nursery education
264,589
Primary education
415,262
Total
679,851
Full-time regular secondary education Special secondary education
420,685 19,835
Total
440,520
TERTIARY EDUCATION Associate degree nursing (2) Higher vocational adult education Specific teacher training
322,744
Adult basic education (3)
SECONDARY EDUCATION (1)
6,255 (3)
18,235 9,199
(3)
University colleges (4)
128,498
Universities (4)
82,113
8,241
Adult education Secondary adult education (3)
45,283
Part-time arts education Part-time arts education
2007-2008
2008-2009
2009-2010
2010-2011
2011-2012
6,577
6,689
6,935
7,332
7,871
8,241
301,594
n/a
300,093
303,912
314,576
322,744
n/a
n/a
n/a
n/a
45,909
45,283
165,157
168,066
167,647
170,337
171,663
173,486
Part-time secondary education Part-time vocational secondary education (1) Adult education Secondary adult education (3) Adult basic education (3) Part-time arts education 173,486
(5)
(1) Elementary and secondary education: number of pupils enrolled (all enrolments) on 1 February 2012. (2) Associate degree nursing: number of pupils enrolled on 1 February 2012 (3) Higher vocational adult education, specific teacher training, secondary adult education and adult basic education: number of unique enrolments on a programme for the reference period 1/4/2011-31/3/2012. (4) University colleges and universities: Bachelor’s and Master’s programmes. Data refer to all active enrolments in a degree contract in an institution for higher education on 30 June 2012. A student may have several enrolments. (5) Part-time arts education: number of students eligible for funding. Individuals enrolled on more than one course of study are counted more than once.
Part-time arts education (5)
(1) Elementary and secondary education: number of pupils enrolled (all enrolments) on 1 February 2012. (2) Associate degree nursing: number of pupils enrolled on 1 February 2012. (3) Higher vocational adult education, specific teacher training, secondary adult education and adult basic education: number of unique enrolments on a programme for the reference period 1/4/2011-31/3/2012. (4) University colleges and universities: Bachelor’s and Master’s programmes. Data refer to all active enrolments in a degree contract in an institution for higher education on 30 June 2012. A student may have several enrolments. (5) Part-time arts education: number of students eligible for funding. Individuals enrolled on more than one course of study are counted more than once.
2 Changes in the school population by level of education 2006-2007
2007-2008
2008-2009
2009-2010
2010-2011
2011-2012
Full-time education NURSERY EDUCATION (1) Regular
233,344
237,530
243,482
250,391
257,424
262,603
Special
1,907
1,950
1,977
1,962
1,975
1,986
235,251
239,480
245,459
252,353
259,399
264,589
Regular
387,157
384,557
381,882
380,197
381,983
386,696
Special
26,794
27,140
27,543
27,705
28,225
28,566
Total
413,951
411,697
409,425
407,902
410,208
415,262
Total elementary education
649,202
651,177
654,884
660,255
669,607
679,851
439,338
438,315
436,146
429,745
424,820
420,685
Total pRIMARY EDUCATION (1)
SECONDARY EDUCATION (1) Regular Special Total secondary education
18,189
18,263
18,548
19,015
19,487
19,835
457,527
456,578
454,694
448,760
444,307
440,520
-
-
-
5,271
5,837
6,255
26,085
n/a
25,065
18,195
17,757
18,235
-
-
-
8,314
9,097
9,199
102,477
104,174
109,795
116,613
123,629
128,498
60,866
64,372
71,645
76,602
79,575
82,113
TERTIARY EDUCATION Associate degree nursing (2) Higher vocational adult education Specific teacher training University colleges Universities
(4)
(4)
(3)
(3)
Flemish Education in Figures | School Year 2011-2012 | 4