BASISONDERWIJS Leerlingen EDUCATION School population 3 SECONDARY 1 School population in secondary education GO M
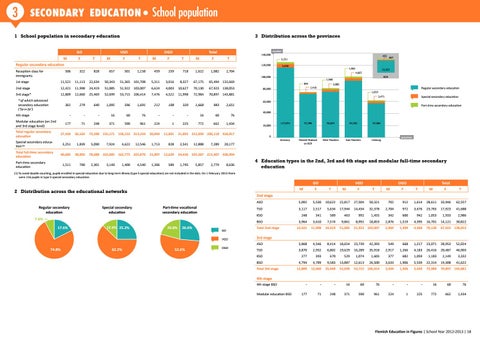
3 Distribution across the provinces VGO
F
T
M
F
OGO T
M
Total
F
T
M
F
140,000
T
120,000
506
322
828
657
1st stage
11,521
11,113
22,634
2nd stage
12,421
11,998
3rd stage*
12,809
12,660
501
1,082
455
3,251
Regular secondary education Reception class for immigrants
number
1,158
459
259
718
1,622
50,343
51,365 101,708
5,311
3,016
8,327
67,175
65,494 132,669
24,419
51,085
51,922 103,007
6,624
4,003
10,627
70,130
67,923 138,053
25,469
52,699
53,715 106,414
7,476
4,522
11,998
72,984
70,897 143,881
5,638
1,962
2,704
* of which advanced secondary education (‘Se-n-Se’)
361
279
640
1,095
596
1,691
212
108
320
1,668
983
2,651
-
-
-
16
60
76
-
-
-
16
60
76
177
71
248
371
590
961
224
1
225
772
662
1,434
Total regular secondary education
37,434
36,164
73,598 155,171 158,153 313,324
20,094
11,801
Special secondary education (1)
3,251
1,839
Total full-time secondary education
40,685
38,003
1,511
790
4th stage Modular education (on 2nd and 3rd stage level)
Part-time secondary education
5,090
12,546
1,713
828
78,688 163,095 162,775 325,870
21,807
12,629
1,206
589
2,301
7,924
3,140
4,622
1,400
4,540
12,888
7,289
BCR
1,560 844
3,985
2,416
80,000
Regular secondary education 1,019
Special secondary education
3,471 60,000
Part-time secondary education 40,000
20,000
31,895 212,699 206,118 418,817 2,541
13,262
4,667 100,000
667
117,074
72,786
76,672
94,701
57,584
Antwerp
Flemish Brabant en BCR
West Flanders
East Flanders
Limburg
0
20,177
province
34,436 225,587 213,407 438,994 1,795
5,857
2,779
8,636
4 Education types in the 2nd, 3rd and 4th stage and modular full-time secondary education
(1) To avoid double counting, pupils enrolled in special education due to long-term illness (type 5 special education) are not included in the data. On 1 February 2013 there were 216 pupils in type 5 special secondary education.
GO M
2 Distribution across the educational networks Regular secondary education
Special secondary education
12.6% 25.2%
Part-time vocational secondary education
20.8%
26.6%
GO VGO
74.8%
62.2%
F
OGO
T
M
F
T
M
Total
F
T
M
F
T
2nd stage
7.6% 17.6%
VGO
52.6%
OGO
ASO
5,092
5,530
10,622
22,817
27,504
50,321
702
912
1,614
28,611
33,946
62,557
TSO
3,117
2,517
5,634
17,944
14,434
32,378
2,704
972
3,676
23,765
17,923
41,688
KSO
248
341
589
463
992
1,455
342
600
942
1,053
1,933
2,986
BSO
3,964
3,610
7,574
9,861
8,992
18,853
2,876
1,519
4,395
16,701
14,121
30,822
12,421
11,998
24,419
51,085
51,922 103,007
2,969
1,499
4,468
70,130
67,923 138,053
ASO
3,868
4,546
8,414
18,654
23,739
42,393
549
668
1,217
23,071
28,953
52,024
TSO
3,870
2,932
6,802
19,629
16,289
35,918
2,917
1,266
4,183
26,416
20,487
46,903
KSO
277
393
670
529
1,074
1,603
377
682
1,059
1,183
2,149
3,332
BSO
4,794
4,789
9,583
13,887
12,613
26,500
3,633
1,906
5,539
22,314
19,308
41,622
12,809
12,660
25,469
52,699
53,715 106,414
3,504
1,926
5,430
72,984
70,897 143,881
-
-
-
16
60
76
-
-
-
16
60
76
177
71
248
371
590
961
224
1
225
772
662
1,434
Total 2nd stage
3rd stage
Total 3rd stage
4th stage 4th stage BSO Modular education BSO
Flemish Education in Figures | School Year 2012-2013 | 18