schooljaar
BASISONDERWIJS LeerlingenSchool population EDUCATION 2 ELEMENTARY 1 School population in elementary education (1) NURSERY EDUCATION
M
GO
F T M
VGO
F T M
OGO
F T M
Total
F T
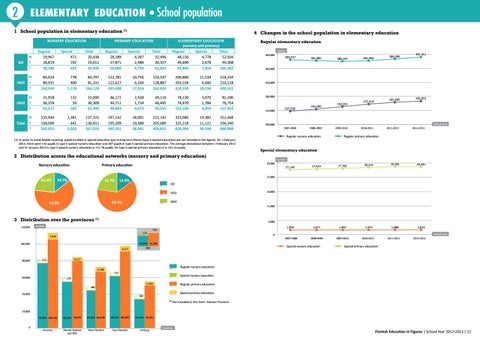
4 Changes in the school population in elementary education
primary education
elementary education (nursery and primary) Regular Special Total 48,156 4,778 52,934 46,690 2,678 49,368 94,846 7,456 102,302
Regular 19,967 18,819 38,786
Special 471 192 663
Total 20,438 19,011 39,449
Regular 28,189 27,871 56,060
Special 4,307 2,486 6,793
Total 32,496 30,357 62,853
84,019 80,931 164,950
778 400 1,178
84,797 81,331 166,128
122,781 122,627 245,408
10,756 6,260 17,016
133,537 128,887 262,424
206,800 203,558 410,358
11,534 6,660 18,194
218,334 210,218 428,552
31,958 30,259 62,217
132 50 182
32,090 30,309 62,399
46,172 44,711 90,883
2,938 1,734 4,672
49,110 46,445 95,555
78,130 74,970 153,100
3,070 1,784 4,854
81,200 76,754 157,954
135,944 130,009 265,953
1,381 642 2,023
137,325 130,651 267,976
197,142 195,209 392,351
18,001 10,480 28,481
215,143 205,689 420,832
333,086 325,218 658,304
19,382 11,122 30,504
352,468 336,340 688,808
(1) In order to avoid double counting, pupils enrolled in special education due to long-term illness (type 5 special education) are not included in the figures. On 1 February 2013, there were 142 pupils in type 5 special nursery education and 207 pupils in type 5 special primary education. The average attendance between 1 February 2012 and 31 January 2013 in type 5 special nursery education is 111.78 pupils; for type 5 special primary education it is 215.15 pupils.
Regular elementary education number 400,000
23.3%
14.7%
22.7%
280,000
240,000
243,482
250,391
265,953
school year
200,000 2007-2008
2008-2009
Regular nursery education
2009-2010
2010-2011
2011-2012
2012-2013
Regular primary education
Special elementary education number
27,140
27,543
27,705
28,225
28,566
28,481
1,950
1,977
1,962
1,975
1,986
2,023
2007-2008
2008-2009
2009-2010
2010-2011
18,000
12,000
6,000
number 124
631 0
11.768 15,369 12,056
100,000
school year
Special nursery education
BCR
6,317
2011-2012
2012-2013
Special primary education
4,217
573
5,448 60,000
237,530
262,603
257,424
OGO
62.4%
7,945
80,000
392,351
GO
3 Distribution over the provinces (1) 120,000
386,696
381,983
24,000
14.9%
VGO
62.0%
380,197
320,000
30,000
Primary education
381,882
360,000
2 Distribution across the educational networks (nursery and primary education) Nursery education
384,557
Regular nursery education 431
Special nursery education
279 4,554
Regular primary education
380 40,000
Special primary education
360 (1)
Not included in the chart: Hainaut Province.
20,000
0
75,094 109,465
53,659 78,337
43,613 65,630
60,359 89,399
33,184 49,461
Antwerp
Flemish Brabant and BCR
West Flanders
East Flanders
Limburg
province
Flemish Education in Figures | School Year 2012-2013 | 12