6 PART-TIME ARTS EDUCATION
SCHOOL POPULATION
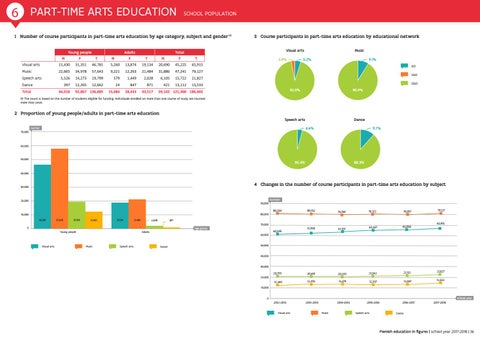
1 Number of course participants in part-time arts education by age category, subject and gender (1) Young people
Adults
M
F
T
Visual arts
15,430
31,351
46,781
Music
22,665
34,978
5,526 397
Speech arts Dance Total
44,018
M
3 Course participants in part-time arts education by educational network Visual arts
Total
F
T
M
F
T
5,260
13,874
19,134
20,690
45,225
65,915
57,643
9,221
12,263
21,484
31,886
47,241
79,127
14,273
19,799
579
1,449
2,028
6,105
15,722
21,827
12,265
12,662
24
847
871
421
13,112
13,533
92,867 136,885
15,084
28,433
43,517
Music
5.2%
2.8%
9.1% GO VGO OGO
92.0%
59,102 121,300 180,402
90.9%
(1) The count is based on the number of students eligible for funding. Individuals enrolled on more than one course of study are counted more than once.
2 Proportion of young people/adults in part-time arts education Speech arts 70,000
Dance 4.6%
number
11.7%
60,000
7,1%
50,000
95.4%
11,9% 88.3%
40,000
4 Changes in the number of course participants in part-time arts education by subject
30,000
20,000
90,000
80,000
10,000 46,781
57,643
19,799
12,662
19,134
21,484
number 80,354
78,789
79,372
78,957
61,948
63,101
64,447
65,058
20,793
20,681
20,435
21,042
21,512
21,827
12,360
12,470
13,479
12,937
13,097
13,533
2013-2014
2014-2015
2015-2016
2016-2017
2017-2018
871
2,028
70,000
0 Young people
Visual arts
age group
Adults
Music
Speech arts
79,127
80,152
60,595
65,915
60,000
Dance
50,000
40,000
30,000 20,000 10,000
school year
0
2012-2013 Visual arts
Music
Speech arts
Dance
Flemish education in figures | school year 2017-2018 | 36