Elementaryeducation Leerlingen EDUCATION SCHOOL POPULATION 2 ELEMENTARY 1 School population in elementary education (1) NURSERY EDUCATION
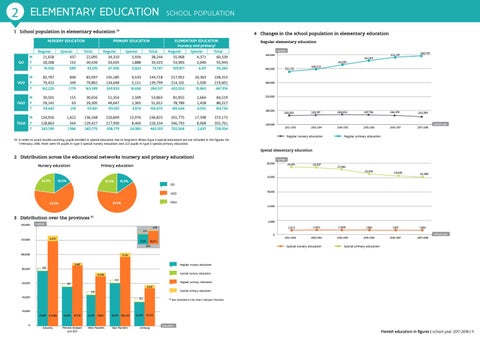
4 Changes in the school population in elementary education
PRIMARY EDUCATION
ELEMENTARY EDUCATION (nursery and primary) Regular Special Total 55,968 4,371 60,339 53,903 2,040 55,943 109,871 6,411 116,282
M F T
Regular 21,658 20,268 41,926
Special 437 152 589
Total 22,095 20,420 42,515
Regular 34,310 33,635 67,945
Special 3,934 1,888 5,822
Total 38,244 35,523 73,767
VGO
M F T
82,767 79,453 162,220
830 349 1,179
83,597 79,802 163,399
135,185 134,648 269,833
9,533 5,151 14,684
144,718 139,799 284,517
217,952 214,101 432,053
10,363 5,500 15,863
228,315 219,601 447,916
OGO
M F T
30,501 29,142 59,643
155 63 218
30,656 29,205 59,861
51,354 49,647 101,001
2,509 1,365 3,874
53,863 51,012 104,875
81,855 78,789 160,644
2,664 1,428 4,092
84,519 80,217 164,736
M Total F T
134,926 128,863 263,789
1,422 564 1,986
136,348 129,427 265,775
220,849 217,930 438,779
15,976 8,404 24,380
236,825 226,334 463,159
355,775 346,793 702,568
17,398 8,968 2,637
373,173 355,761 728,934
GO
Regular elementary education number 440,000
422,911
432,291
438,779
411,097 400,000
392,351
399,729
360,000
320,000
280,000
240,000
265,953
269,197
268,453
267,756
266,379
263,789
2012-2013
2013-2014
2014-2015
2015-2016
2016-2017
2017-2018
Regular nursery education
(1) In order to avoid double counting, pupils enrolled in special education due to long-term illness (type 5 special education) are not included in the figures. On 1 February 2018, there were 131 pupils in type 5 special nursery education and 223 pupils in type 5 special primary education.
school year
Regular primary education
Special elementary education
2 Distribution across the educational networks (nursery and primary education) Nursery education
number 30,000
Primary education
28,481
28,307
27,483 25,578
22.5%
16,0%
22.6%
15.9%
18,000
OGO
61.4%
61.5%
12,000
3 Distribution over the provinces (1)
6,000
number
2,023
628 144 0 6,924
120,000
11,768 13,174
18,047
BCR 100,000
80,000
24,380
GO VGO
140,000
24,645
24,000
2,042
2,000
1,984
1,967
1,986
2013-2014
2014-2015
2015-2016
2016-2017
2017-2018
school year 2012-2013
Special nursery education
Special primary education
5,214 3,487
569
Regular nursery education Special nursery education
4,648 424
60,000
Regular primary education
301
4,107 Special primary education
340 40,000
352
(1)
Not included in the chart: Hainaut Province
20,000 75,818 0
124,384
Antwerp
54,982
87,710
Flemish Brabant and BCR
42,136 71,862
58,701 100,253
West Flanders
East Flanders
32,099
54,513
Limburg
province
Flemish education in figures | school year 2017-2018 | 11