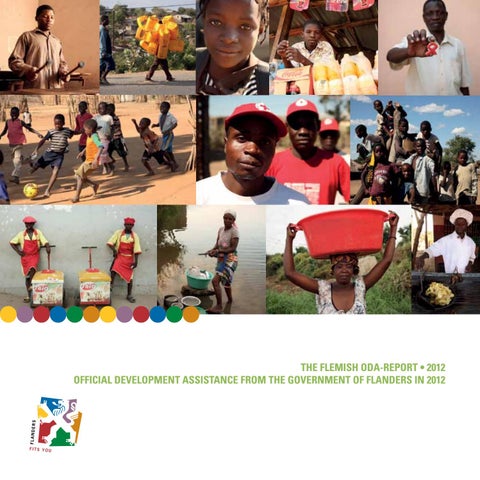
The Flemish ODA-Report • 2012 OFFICIAL DEVELOPMENT ASSISTANCE FROM THE GOVERNMENT OF FLANDERS IN 2012
The Flemish ODA-Report • 2012 OFFICIAL DEVELOPMENT ASSISTANCE FROM THE GOVERNMENT OF FLANDERS IN 2012
Table of contents
1. INTRODUCTION...................................................................................................................................................... 6 1.1. New ODA reporting standard................................................................................................................................. 8 1.2. International Aid Transparency Initiative (IATI)........................................................................................................ 8 1.3. Worldwide decrease in ODA.................................................................................................................................. 9 2. FLEMISH ODA SPENDING PATTERN ................................................................................................................. 10 2.1 Spending breakdown between projects in the North/South................................................................................ 10 2.2 Flemish ODA policy indicators.............................................................................................................................. 14 2.3 Flemish ODA in an international context.............................................................................................................. 23 3. SPENDING PATTERN OF THE FLEMISH DEVELOPMENT COOPERATION....................................................... 24 3.1 Introduction: a policy focused on development cooperation................................................................................ 24 3.2 Policy indicators with respect to the Flemish Development Cooperation ........................................................... 25 4. FAST START (CLIMATE) FINANCE....................................................................................................................... 29 4.1 Introduction ......................................................................................................................................................... 29 4.2 Overview of the supported climate-related assistance........................................................................................ 29 4.3 ODA eligibility and additionality of climate finance.............................................................................................. 32 5. ONLINE ACCESS USER GUIDE............................................................................................................................ 33 5.1 Lists available online............................................................................................................................................. 33 5.2 Navigating within the SharePoint environment.................................................................................................... 34
5
1. Introduction
The Flemish ODA provides an overview of the Government of Flanders’ expenditure on development assistance. This expenditures complies with the official criteria for development cooperation (or ODA). A financial transaction is eligible for ODA-registration if it meets each of the following conditions: Grants or loans to countries and territories on the DAC List of ODA Recipients1 (developing countries) and to multilateral agencies which are: (a) undertaken by the official sector; (b) with promotion of economic development and welfare as the main objective; (c) at concessional financial terms (if a loan, having a grant element of at least 25 per cent). In addition to financial flows, technical co-operation is included in aid. Grants, loans and credits for military purposes are excluded. Flanders is seeking to conduct this exercise as transparently and consistently as possible. As a sub-state donor, it is unable to pass on any of the costs for military operations or the repatriation costs of refugees. Under the Development Cooperation Framework Act (Art. 5, §2), Flanders is moreover obligated to provide strictly untied assistance. A total of EUR 4,391,702 in mostly trade-related assistance has not been included in this ODA report. It involves subsidies for feasibility studies (EUR 1,171,407) and equipment (EUR 3,220,295) that the Flanders Investment & Trade agency awards to companies that maintain a place of business in the Flemish Region2 Lastly, no concessional loans or debt cancellations were employed as an instrument for development in 2012. Under the terms of the Development Cooperation Framework Act, the annual ODA report is regarded as a mandatory report to be delivered to the Flemish Parliament, and as such has a dual role to play: (1) it enumerates the measures taken by the Government of Flanders to contribute to the international target of spending 0.7% of the GNI on ODA (Development Cooperation Framework Act, Art. 23, 24). (2) the report serves as a policy instrument for putting the objective of coherent development policy to the test (Development Cooperation Framework Act, Art. 3 §1). The 4th section of this ODA report also documents all subsidies awarded by the Government of Flanders within the scope of Fast Start Finance (climate-related development assistance). The information contained in this report is provided annually to the Belgian Directorate General for Development Cooperation and Humanitarian Aid (DGD), which reports the annual ODA originating in Belgian territory to the Organisation for Economic Cooperation and Development (OECD).
1 A list of countries and organisations is available at www.oecd.org/dac/stats/daclist 2 More information: http://www.flanderstrade.be
6
© Veronique Schotte
7
1.1.
New ODA reporting standard
The Flemish ODA report consists of reports on projects, programmes and budgetary assistance. Past editions of the ODA report included brief dossiers that offered readers insight into the measures, project objectives and sectors targeted for each subsidy. Beginning this year, the Flemish Development Cooperation is committed to further expanding the transparency it provides on its development spending to the highest possible standard (see 1.2). The reporting will now include the expected outcomes, and interested parties may view the actual project documents as well. These changes will greatly increase the amount of information that is available for each project dossier. The cost of publishing project information online is nothing compared to the cost (in environmental terms) of printing and distributing a voluminous 200-page guide. The online publication has three additional benefits in the area of transparency: 1. Interested parties can find the information they are looking for more quickly than in a hardcopy guide. With a few clicks of the mouse, information can be filtered by country, recipient, sector, payment year, etc. The programme automatically calculates the interim totals for each parameter entered. This tool also includes a search function. 2. URL links provide online access to the accompanying project documents. 3. As opposed to a printed guide, changes that need to be made (based on new aspects of a project’s implementation, for example) can be applied at any time. Section 5 includes a listing of the links to the online database along with instructions on how to use it.
1.2. International Aid Transparency Initiative (IATI) In early 2013, the Government of Flanders signed the International Aid Transparency Initiative (IATI). The IATI is a campaign aimed at increasing transparency on the global resources that are devoted to development cooperation. Through its successful launch at global forums on aid effectiveness, IATI has managed to win a place on the transparency agenda of donors and developing countries. The IATI is based on the principle that governments in developing countries are in a better position to plan and direct their efforts when information on developmental resources are accurate and made available in a timely fashion. A long-term overview of scheduled funding along with the use of effective information management systems allows developing countries to better estimate planned revenues, which increases the predictability of the aid. Increased transparency can also facilitate a dialogue between the citizens of both donor and developing countries and their governments regarding the spending of the development assistance. As such, transparency plays an important role in increasing aid effectiveness. At the Fourth High Level Forum on Aid Effectiveness, held in Busan, donors made commitments to further increase the availability of information on development activities. And lastly, by the end of 2015, a common, open standard for electronic publication of timely, comprehensive and forward-looking information concerning funding for development activities will be implemented. This standard must comply with the information requirements of governments and non-state actors in developing countries. 8
In implementing the Busan Declaration, the international community defined the broad outlines of the common standard for electronic publication, and agreed that the standard would be developed via the combination and convergence of two existing standards: CRS (the OECD’s ODA standard) and IATI (the standard for the publication of future funding flows). The purpose was to create one single standard for donors to use when reporting on their ongoing and future development cooperation, beginning in 2015.   The IATI has been a major factor in the development of the joint standard. Compared to the ODA reporting that is provided to the OECD-DAC, global transparency on development assistance is being further enhanced as follows: 1. The OECD-DAC is primarily concerned with the reporting requirements of donors, while the IATI seeks to arrive at a standard that responds to the needs of developing countries as well. 2. The IATI provides more detailed information concerning future aid flows, whereas the OECD focuses more on historical aid flows. 3. The ODA statistics are limited to the expenditures of governments and multilateral institutions, while the IATI registry also provides access to the data of other development actors. 4. The data that are accessible via the IATI registry are available in an open-source file format. Citizens and elements of civil society can process these data as they see fit using free computer software. 5. The IATI also approaches development assistance in terms of the actual results achieved, whereas the OECD reporting is focused mainly on documenting the actual funding flows. The Government of Flanders will upload its data to the IATI registry by 2015. In the interim, these data can also be accessed online via the web addresses provided in section 5.
1.3. Worldwide decrease in ODA In 2011, official expenditures on development cooperation by the international community totalled USD 134 billion - a decrease of 2.3% relative to 2010. This would seem to signal a formal end to what has been a period of consistent growth in ODA; between 2000 and 2010, worldwide ODA increased by 63%. The reason for this decrease is the increased pressure on public spending in donor countries. Spending on the part of European countries combined decreased by 3.1%. The effects of the economic crisis on the development spending of governments have been inordinately felt in Spain (-34.1%) and Greece (-22.1%). Slow-to-recover Italy defied the trend with a remarkable increase (+35.7%). The ODA originating in Belgian territory reached EUR 2.018 billion in 2011, or 0.53% of the Gross Domestic Product. When ranked according to its share of GDP that was spent on ODA, Belgium placed 7th, behind the Scandinavian countries, Luxembourg, the Netherlands and the United Kingdom. These countries - with the exception of the United Kingdom - also attained the international target of setting aside 0.7% of GDP for development cooperation3. A survey into 2013 expenditures points to a further decline in the country programmable aid4 (CPA) provided by the international community. This indicates that it takes a few years for the impact of the economic and financial crisis (dating back to 2008) to be felt on development assistance budgets. 3 More information: http://www.oecd.org/development/aidstatistics/statisticsonresourceflowstodevelopingcountries.htm 4 More information: http://www.oecd.org/development/aideffectiveness/cpa.htm
9
2. Flemish ODA spending pattern
2.1 Spending breakdown between projects in the North/South The Flemish ODA amounted to EUR 51,470,913 in 2012. Of this amount, EUR 26,728,688 - or 52% - falls under Southern cooperation. Flanders uses these funds to invest in projects, programmes and sectoral funds in the South. Roughly 82% of the loans for projects in the South were committed to the high-priority region of Southern Africa5. Spending on Northern cooperation totalled EUR 21,866,377 - or 43% of the total ODA. These contributions benefit Belgian actors who play a major role in the field of development cooperation. These funds do not leave the country, though they can have an indirect effect on socio-economic development in the South6. Lastly, administrative costs were incurred by both the Flemish Department of Foreign Affairs as well as the Flanders International Cooperation Agency (FICA). These expenditures were essential in developing the policy for the development cooperation, as well as for its implementation. In 2012, these costs accounted for 5.6% of total ODA. This is in line with the average administrative costs incurred by all OECD-DAC donors in 2011 (5.3%). The composition of the spending on Southern cooperation (2.1.1) and projects in the Northern cooperation (2.1.2) is examined below.
5 The expenditures flowing to the region of ‘Southern Africa’ in 2012 (a total of almost EUR 22 million) can be found at http://www.vlaanderen.be/ int/oda/region 6 One example of this is the structural funding from the Antwerp Institute for Tropical Medicine that contributes to the development of medication and applied treatment methods for combating tropical diseases
10
2.1.1
Southern cooperation
Southern cooperation Types of expenditures for Southern cooperation
South Africa Mozambique Malawi Southern Africa (sub-regional) Other Multilateral cooperation (unallocated contributions) UNAIDS UN Relief and Works Agency for Palestine Refugees (UNRWA) Unicef nternational Funding for environmental conventions (UNFCCC, UNEP, UNECE7) International Seed Testing Organisation (ISTA) Indirect cooperation Applied scientific research in developing countries Trade and development Flemish Partnership Water for Development Scholarships and training (administered in developing countries) Flemish Fund for Tropical Forests Miscellaneous (mainly the transport and storage sector) Humanitarian aid (excluding contributions to One UN Fund, WFP, UNRWA)
Total: 26.728.688 € Bilateral 9.053.506 1.571.907 2.117.008 5.229.903 / 134.688
Bi-Multi 12.896.930 2.560.465 598.394 3.740.347 3.067.884 2.929.840
Total € 21.950.435 4.132.372 2.715.402 8.970.250 3.067.884 3.064.528 889.042 € 250.000 200.000 250.000 183.706 5.336 3.164.294 € 1.331.192 439.528 613.478 323.600 199.246 257.250 724.916 €
7
ODA within the context of bilateral cooperation amounts to EUR 9 million. This includes modes of cooperation that are based on an agreement between the Government of Flanders and a partner country of the Flemish Development Cooperation. Both government institutions in the partner countries as well as local, international or Flemish organisations are responsible for implementing bilateral cooperation. Multilateral institutions may also be responsible for implementing specific aspects of the bilateral development policy in the partner countries. Multilateral institutions can additionally be deployed for cross-border, regionally-oriented programmes. Expenditures on multilateral institutions that are earmarked by sector and/or geographic location fall under the Bi-multi category. Approximately EUR 12.9 million - or roughly one fourth of Flemish ODA - was deployed this way in 2012. 7 UNFCCC: United Nations Framework Convention on Climate Change; UNEP: United Nations Environment Programme; UNECE: United Nations Economic Commission for Europe.
11
Bi-Multi: funds allocated for UN organisations in 2012 Food and Agricultural Organization of the United Nations (FAO) International Trade Centre (ITC) International Labour Organisation (ILO) Joint United Nations Programme on HIV/AIDS (UNAIDS) Office of the United Nations High Commissioner for Human Rights (OHCHR) One UN Fund Malawi Organisation for Economic Cooperation and Development (OECD) United Nations Development Programme (UNDP) UNICEF United Nations Development Fund for Women (UNIFEM) United Nations Educational, Scientific and Cultural Organisation (UNESCO)
12.896.930 € 1.207.509 200.000 2.348.394 500.000 57.838 450.000 10.000 455.000 2.600.000 13.604 2.718.830
United Nations World Food Programme (WFP)
200.000
World Agroforestry Centre (ICRAF)
802.884
World Conservation Monitoring Centre
289.598
World Health Organisation
1.043.273
Multilateral cooperation – unearmarked contributions are fully absorbed into the general budget of a multilateral organisation - totals EUR 889,042 million. Unearmarked aid affords these organisations flexibility when utilising Flemish contributions to meet ever-changing needs. Indirect cooperation deployed in the South in 2011 amounts to EUR 3.2 million. With indirect cooperation, the expertise of an organisation (NGOs, non-profit organisations, scientific institutions, and private actors) is consigned to the implementation of specific projects. Within the context of projects in the South, we can discern a number of cooperation initiatives that are geared toward the pursuit of a specific attainment target. Expenditures on ‘trade and development’ are aimed at improving the living conditions of inhabitants by improving productivity as well as access to the means of production and the market. The Flemish Partnership Water for Development works to achieve waterrelated attainment targets as outlined in Millennium Goal 7. The Flemish Fund for Tropical Forests emphasises the benefits of forestry and forest management in the course of combating climate change, the loss of biodiversity and desertification in developing countries. In the context of international cooperation, Flanders also provides aid for areas affected by natural or man-made disasters. The remaining category of emergency aid represents EUR 724,916. To avoid double counting, the multilateral contributions relevant to emergency aid - which can be found in the ‘bi-multi’ and ‘multilateral aid’ categories - are not included in this category.
12
2.1.2 Northern cooperation Northern cooperation Types of expenditures for Northern cooperation Scientific research Antwerp Institute for Tropical Medicine (ITG)
Total: 21.866.377 € subtotal: 15.671.000 € 12.408.000
Institute of Development Policy and Management (IOB)
2.198.000
United Nations University (UNU)
1.065.000
Development education and raising awareness
2.324.065 €
Support for NGOs and/or non-profit organisations
1.609.407 €
Municipal development cooperation
1.518.215 €
Municipal covenants on development cooperation npo Association of Flemish Cities and Municipalities Scholarships and training (administered in donor country)
1.300.289 217.926 743.690 €
Roughly 72% of the funding allocated to projects in the North goes to development-relevant scientific research. The Antwerp Institute for Tropical Medicine specialises in research, education and services in the field of tropical medicine, as well as the organisation of health care services in developing countries. The Institute of Development Policy and Management provides secondary academic education, conducts scientific research and offers social services relating to the economic, political and social aspects of development policy and management. The United Nations University (UNU) conducts research into global problems that fall within the UN’s sphere of interest: peace and government, development, environment, science and technology. Roughly EUR 2.3 million is spent on development education and raising awareness. A positive attitude toward development cooperation forms a critical foundation for peace and solidarity in society. By increasing support for poverty reduction among the population, the Flemish citizen gains a stronger sense of responsibility. Cities and municipalities maintain direct access to their citizens and are therefore in a unique position to raise awareness among difficult-to-reach target groups. EUR 1.5 million was committed to the support programme for municipal development cooperation. The Government of Flanders also provided support for NGOs within the context of its projects in the North, primarily in the form of wage subsidies. As civil society actors in the realm of development cooperation, they have a key role to play in strengthening acceptance, in maintaining a watchful eye over government activities and in developing innovative projects in the South. By providing students in the South with the opportunity to pursue specific training programmes in Flanders, an indirect contribution is made to capacity building in their own countries. Scholarships administered in the donor country account for EUR 743,690 of 2012 expenditures. 13
2.1.3
Looking for more information?
If you would like more details on the composition of the ODA based on the types of expenditures listed above, please consult the list of cooperation forms at http://www.vlaanderen.be/int/oda/cooperationform
2.2
Flemish ODA policy indicators
The above breakdown – Northern / Southern cooperation and administrative costs - does not provide any insight into the sectoral distribution, the selection of partners, the origin of the funds, etc. This section takes a closer look at a number of policy-related indicators. Where possible, the evolution since 2009 is indicated. 2.2.1 Recipients and recipient countries The diagram below ranks the recipients of Flemish ODA according to percentage. You can access information on the specific projects and programmes at http://www.vlaanderen.be/int/oda/recipients
14
Scientific institutions account for 32% of the 2012 Flemish ODA. The Institute for Tropical Medicine received EUR 12.4 million in the form of structural support from the specialist departments of Education and Training (E&T) and of Economy, Science and Innovation (ESI). On average, the share of funding received by scientific institutions between 2009-2012 remained above 30%. The ODA provided to multilateral institutions increased to 28% of total spending during 2011-2012. This involves both unallocated, multilateral support as well as contributions that are linked to a geographic and/or topic-based allocation (bi-multi). In order to maximise synergies between the bilateral development policies in the partner countries, the choice is often made to concentrate contributions on the countries in Southern Africa. UN agencies can also serve as the implementing partner of the bilateral cooperation with the partner countries. NGOs and non-profit organisations together received 20.5% of the ODA. This percentage is the sum of the share of Flemish NGOs and non-profits (14.5%), local NGOs (4.5%) and international NGOs (1.4%). These actors can also be deployed to implement bilateral development programmes. A total of 10.7% of Flemish ODA is paid out directly to the governments of South Africa, Mozambique and Malawi. The 2011-2012 period saw a decreasing trend compared to 2009-2010. Cooperation with governments in partner countries is funded almost entirely with resources from the development cooperation budget. Lastly, 2.5% of ODA goes directly to domestic cities and municipalities in order to strengthen support for development cooperation. These subsidies are also fully derived from the development cooperation budget. The ‘other’ category of recipient corresponds closely to administrative costs and has remained steady at 5%. The recipients listed above operate in a number of regions of the world. The table below provides an overview of the geographic distribution of the ODA by ranking the recipient regions by percentage. The specific countries and projects in these regions can be viewed at: http://www.vlaanderen.be/int/oda/region
15
Top regions receiving Flemish ODA 2012
% ODA
% Southern cooperation
24.217.608 €
47,0%
90,6%
1.285.406 €
2,5%
4,8%
North Africa
289.497 €
0,6%
1,1%
Sahel
282.458 €
0,5%
1,1%
West-Africa
279.007 €
0,5%
1,0%
Central-Africa
108.849 €
0,2%
0,4%
21.906.836 €
42,6%
82,0%
Malawi
9.308.656 €
18,1%
34,8%
Zuid-Afrika
5.455.376 €
10,6%
20,4%
Mozambique
2.952.536 €
5,7%
11,0%
Subregional/other countries in region
4.190.268 €
8,1%
15,7%
1.153.388 €
2,2%
4,3%
Asia
979.847 €
1,9%
3,7%
Middle-East
409.373 €
0,8%
1,5%
Africa Of which:
Africa (no region specified)
South Africa Of which:
Latin America/Caribbean
The priority partner countries and regions are the largest recipients of 2012 Flemish ODA, receiving 43% of total ODA. Aside from the North cooperation and administrative costs, these countries and regions account for 82% of total ODA for the South cooperation. The ODA flowing to the priority countries and region (Southern Africa) can be further examined according to recipient.
16
© Veronique Schotte
17
In Malawi and Mozambique, the disbursement channels are more or less evenly distributed between government entities, multilateral institutions and NGOs. Comparatively speaking, more payments were made to NGOs in Mozambique (Apope, Doctors Without Borders, Pathfinder International and Viva Africa) because the annual contribution to the health sector (EUR 2 million to the Mozambican government) could not be paid. For each country/region, the percentage in orange corresponds to the cost of bringing in consultants, conducting audits, assessments, identifications, formulations, etc. In South Africa, almost half of the Flemish ODA was disbursed via the channel of multilateral institutions in 2012. The large share of ODA going to scientific institutions in South Africa can be explained by two relatively large payments for applied research in the water and agriculture sector (from the Department of Economy, Science and Innovation). ODA flowing to the region of Southern Africa (both the region itself as well as individual countries in the region, excluding the three bar graphs above) is implemented mainly by multilateral institutions and (international) NGOs. This often involves cross-border programmes for which these players are able to offer specific expertise. The ‘other’ category (3%) comprises the sum of all costs associated with the field offices located in the three partner countries. 2.2.2 Sectors
18
Flemish ODA per sector is detailed on page 18. The sector coding system was developed by the OECD Development Assistance Committee and allows for comparisons to be made between the sectoral information of all donors. This distribution per sector (and the projects associated with each sector) can be viewed here: http://www.vlaanderen. be/int/oda/sectors Flemish ODA in 2012 is centred on the sectors of health (29%), education (12%) and agriculture and livestock farming (11%). Social infrastructure (6%) and development education and awareness raising (7%) also prove to be relatively important sectors. The five largest sectors combine to account for 65% of the total ODA. The sectors at the bottom of the chart (energy, environmental protection, forestry, water supply) - which are associated with the 7th Millennium Development Goal - combined to double from 5% in 2011 to 10% in 2012. This resulted from the additional funding for climate assistance that was provided to developing countries as agreed to at the climate summit in Copenhagen (see section 4). 2.2.3
Source and composition of Flemish ODA contributions
Together, three policy areas accounted for 94.5% of the ODA: Flemish Foreign Affairs, Education and Training (OV), and Economy, Science and Innovation (EWI). This share has remained steady over the past four years. The relative increase of the Economy, Science and Innovation Policy Area in 2012 is due to the coinciding of the end of phase II and the beginning of phase III within the Flanders UNESCO Science Trust Fund (FUST). This breakdown per policy area can also be viewed at: http://www.vlaanderen.be/int/oda/policydomain The Flemish Department of Foreign Affairs (IV) is the policy area to which the Flanders International Cooperation Agency (FICA) belongs. This agency administers the funds from the development cooperation budget. FICA also manages two projects that address decent work and social dialogue. The policy aims of both of these projects have been driven by the Work and Social Economy Policy Area (WSE). However, because Flemish Foreign Affairs is the policy area from which these funds are derived, they are recorded among this policy area expenditures. 19
Based on the ODA expenditures of the policy areas of Economy, Science and Innovation (EWI), Education and Training (OV), and Flemish Foreign Affairs (IV) on the one hand, and the remaining policy areas on the other, we can divide the ODA into three general groups.
The funds originating from the budget for development cooperation (FICA) are represented in blue in the bar graph above. We note a rising progression up to 2011. In 2012, FICA spent EUR 3 million less than in the previous year. The Mozambican pooled health sector fund (SWAp) failed to comply with the conditions for qualifying for the annual payment of EUR 2 million in 2012, which is a major reason for this decline in spending. Steady growth was seen in funding for scientific institutions and universities (shown in red in the bar graph). This aid is largely laid down in agreements that provide for an annual indexation, resulting in a more stable level of expenditures. The subsidies come primarily from the policy areas of Education and Training (OV) and Economy, Science and Innovation (EWI). Scientific research is conducted mainly in the health and agriculture sectors8.
8 Scientific research in the health and agriculture sectors is included in the sectoral overview for health and agriculture (see 2.2.2). This is why total funding for scientific research (regardless of the sector), shown in red in the bar graph, does not contradict the diagram that displays sectoral distribution
20
All expenditures which are not administered within the budget for development cooperation and which are not destined for scientific research are represented in green in the bar graph. This portion, paid by several policy areas, has experienced a continuous downward trend since 2009 as the result of budget cuts within the Government of Flanders. The purple line indicates changes in the portion of ‘country programmable aid’ (CPA) 9. These are funds that can be programmed in developing countries and which are administered by the main agency (FICA). This indicator focuses on the essence of development cooperation and excludes non-programmable expenses such as humanitarian aid, emergency food aid, administrative costs and projects in the North. The share of CPA increased to 36% up to 2011 and then stabilised at 35% in 2012. 2.2.4 Aid typologies Since the Paris Declaration on Aid Effectiveness (2005), a greater priority has been placed at the international level on coordinating donor aid with the existing policy aims of recipient countries. The harmonisation of procedures for implementing aid among donors is also high on the international aid agenda. In order to measure donor progress on this front, measuring tools were developed that also contain information on the way in which the projects, programmes and funds are established. This allows us to ascertain whether a donor is primarily making use of project aid, or whether the donor is deploying its aid via pre-existing programmes or funds of the recipient government and/or a group of donors. Project aid that is furnished separately is often associated with relatively high costs related to its identification, follow-up and other administrative tasks. The distribution of the ODA for both 2011 and 2012 is shown in the table on the next page10.
9 More information can be found at http://www.oecd.org/development/aideffectiveness/cpa.htm 10 Figures for 2011 differ from the figures previously published in the ODA Report 2011. In early 2012, the OECD published an explanatory note on the technical application of these typologies. The data were adjusted in accordance with the OECD clarification.
21
Aid typologies
ODA 2011
% ODA 2011
ODA 2012
% ODA 2012
A02
Sector budget support
3.965.000 €
7,3%
3.000.000 €
5,8%
B01
Core support to NGOs, other private bodies, PPPs and research institutes
16.668.229 €
30,8%
16.515.407 €
32,1%
B02
Core contributions to multilateral institutions
2.319.023 €
4,3%
889.042 €
1,7%
B03
Contributions to specific-purpose programmes and funds managed by international organisations (multilateral, INGO)
3.836.480 €
7,1%
3.515.000 €
6,8%
B04
Basket funds/pooled funding
170.000 €
0,3%
0
0
C01
Project-type interventions
18.430.031 €
34,1%
19.031.795 €
37,0%
D0
Experts and technical assistance
1.843.977 €
3,4%
1.704.586 €
3,3%
Of which: DO1 Donor country personnel: Technical assistance, experts, consultants, academics, etc. from the donor country
1.173.103 €
2,2%
346.994 €
0,7%
And of which: D02 Other technical assistance: joint research by donor and recipient, local scholarships, development-relevant social and cultural programmes, etc.
670.874 €
1,2%
1.357.592 €
2,6%
E01
Scholarships/training in donor country
643.454 €
1,2%
743.690 €
1,4%
G01
Administrative costs
2.725.624 €
5,0%
2.875.849 €
5,6%
H01
Development awareness
3.435.550 €
6,4%
3.108.054 €
6,0%
The high percentage of ODA for B01 is due to the contributions to the scientific institutions of the Institute for Tropical Medicine and the Institute of Development Policy and Management11 (EUR 14.6 million) as well as the wage subsidies for Flemish NGOs (EUR 1.6 million). For subsidies within typology B03 (specific programmes and funds), the donor has not exercised any influence on the allocation of the funds towards specific projects. Flanders supports two of UNICEF’s thematic priorities (survival of children + HIV/AIDS and children) via these subsidies, and does so without making any prior agreements with UNICEF as to the individual projects that must be funded with these resources. This is not the case for projects funded by the Flanders UNESCO General Trust Fund, the Flanders UNESCO Science Trust Fund and the Flanders-ILO Trust Fund. Because the allocation of funds to actual projects is agreed upon between the Government of Flanders and the UN institution, the projects themselves are categorised under typology C01: project type interventions. Project assistance forms the largest aid category within Flemish ODA. Lastly, the sum of the ODA to technical assistance (international cooperation via experts), administrative costs, scholarships and development awareness in the donor country remained stable in 2011 and 2012. 11 ‘Instituut voor Tropisch Geneeskunde’ & ‘Instituut voor Ontwikkelingsbeleid en –beheer’ in Dutch
22
2.3
Flemish ODA in an international context
The contribution made by Flanders to the partner countries of the Flemish Development Cooperation can be compared to that of other donors. Because figures for the 2012 ODA of other donors were not yet available at the time of writing, this comparison runs to 2011. Flemisch ODA in the partner countries 2008
2009
2010
2011
4.508.559
3.921.056
3.853.365
3.540.573
15
12
15
16
0,74%
0,65%
0,64%
0,51%
6.996.654
5.325.919
4.972.225
7.930.012
19
19
20
18
0,75%
0,57%
0,52%
0,64%
710.510
5.572.745
7.819.937
4.924.518
16
9
8
9
0,23%
1,70%
1,98%
1,51%
South Africa Flemish ODA (€) Rank among donors % of total ODA Mozambique Flemish ODA (€) Rank among donors % of total ODA Malawi Flemish ODA (€) Rank among donors % of total ODA
The portion of the Flemish contribution to South Africa and Malawi relative to overall bilateral development cooperation (excluding the European Commission) declined between 2010 and 2011, and its ranking among bilateral donors also dropped. During this same period, Flemish ODA in Mozambique increased, both in terms of its proportion to overall ODA as well as its rank among other donors.
23
3. Spending pattern of the Flemish Development Cooperation
The ODA statistics and the budget expenditures for development cooperation should not be confused with one another. Flemish spending on development cooperation constitutes a portion of overall Flemish ODA. This portion saw a slight decline in 2012.
The budget for development cooperation is administered by the Flanders International Cooperation Agency (FICA), which operates within the Flemish Foreign Affairs Policy Area. In this section, we delve deeper into the spending pattern of the budget for development cooperation. In 2012, a total of EUR 26,741,498 in development-relevant contributions was spent by FICA. This ODA can be further broken down according to spending channel and sectoral focus.
3.1 Introduction: a policy focused on development cooperation The Flemish Development Cooperation is focused on cooperation with the countries of South Africa, Mozambique and Malawi. The cooperation with the partner countries is formalised in the Memoranda of Understanding (MOU), which provide the framework within which Flanders commits itself to the development priorities of the partner countries. The strategy papers specify what the cooperation priorities will be over a five-year period. These documents are an important means of optimising the predictability of the aid. 24
The Flemish Development Cooperation is affected by the international discourse on aid effectiveness. In the course of establishing this cooperation, Flanders strives to coordinate its efforts and cooperate with other donors. Some of these coordinated efforts include the deployment of sectoral aid for healthcare rights in Malawi and Mozambique, and the deployment of sectoral aid for agriculture in Malawi. South Africa became the first partner country of the Flemish Development Cooperation in 1994. On 15 July 2011, the Government of Flanders approved the second 2012-2016 strategy paper on development cooperation. Focus is being given to two sectors that have been designated as priorities by the South African government: (1) agriculture and food security and (2) job creation and entrepreneurship. Development cooperation between Flanders and Mozambique was formally initiated in 2002. The second strategy paper (2011-2015) focused entirely on advancing the right of the Mozambican population to health. Efforts within the health sector are primarily focused on making a contribution to: (1) the further development of a critical mass of well-trained and highly-motivated health care workers; (2) the provision of solid health research and a comprehensive health monitoring programme of diseases and epidemics; (3) the promotion of sexual and reproductive health and rights; and (4) the promotion of good nutrition and nutritional practices. On 28 April 2006, the Government of Flanders selected Malawi as the third partner country for the Flemish Development Cooperation. On 7 November 2008, an initial joint strategy paper for 2009-2013 was approved. In addition to agriculture & food security, healthcare also became a high-priority concentration sector for cooperation with Malawi beginning in 2009. During 2013, work will start - by mutual agreement - on the creation of a new strategy paper for 2014-2018.
3.2 Policy indicators with respect to the Flemish Development Cooperation 3.2.1
Spending categories of the Flanders International Cooperation Agency
FICA carries out the following duties in accordance with its instrument of ratification: • • • • •
bilateral cooperation with partners in the South; support of the actions and activities of indirect actors; cooperative measures via multilateral organisations; increasing support and raising awareness; emergency aid and humanitarian aid.
25
In the diagram below, these duties can also be inferred from FICA’s actual spending in 2012.
- Three fourths of the spending is devoted to projects and programmes in the South; one third falls under ‘bilateral cooperation’. - 37% of expenditures go to programmes and projects administered by multilateral institutions in the partner countries and in the priority region of Southern Africa. The general budgetary support provided to multilateral institutions accounts for 2% of expenditures. - NGOs are provided general support by way of wage subsidies (3% of expenditures). They are also used in the effort to increase support and for projects in the South. - FICA spends 8% on raising awareness in Flanders and 6% on raising awareness via local authorities through its support for municipal development cooperation. - Humanitarian aid accounts for 3% of FICA expenditures in 2012 (excluding general budgetary support for UN agencies that provide humanitarian aid). 3.2.2 Sectors The focal sectors of the bilateral cooperation can be linked to the actual payments: health (25%), agriculture & livestock farming (16%) and decent work (9%). In addition, there are a number of core tasks carried out by FICA, i.e. raising awareness (12%), the processing of humanitarian aid files (4.4%) and the general support of NGOs by way of wage subsidies to staff employed under the former DAC status (under sector code ‘sector undefined’: 3%). Total administrative costs represent 10% of expenditures.
26
The relative decline in the health sector (25% in 2012 compared to 33% in 2011) is due to the fact that the annual sectoral budget support in Mozambique did not meet the conditions for payment. The sectors of government and civil society (specifically, human rights) and the environmental sectors (environmental protection, energy and forestry) saw an increase in 2012. • In South Africa, the cooperation was underpinned by the human rights component and the participation of civil society in public policy. In 2012, the agreement with UNICEF International entered into force. UNICEF is committed to advocate for children’s rights. • The Copenhagen commitments on climate-related assistance, which are aimed at assisting developing countries in their fight against climate change, were also monitored within the context of the Flemish Development Cooperation. In addition to being screened for their defence of (and effects on) the climate, all development projects contribute to the agricultural practice of agroforestry, which is aimed at both adaptation and mitigation (see also section 4). 27
3.2.3 Recipients Multilateral institutions account for 37% of FICA spending in 2012. NGOs - both domestic and foreign - receive roughly 30% of total spending, while governments in South Africa, Mozambique and Malawi lay claim to 18.5% of spending. Cities and municipalities receive 5% of expenditures from the development cooperation budget. The small share provided to scientific institutions (0%) stands in contrast to the large share of these institutions within the overall ODA (32%). Institutions that carry out development-relevant research mainly receive their support from the specialist departments for education (OV) and science (EWI). Consultants were deployed to conduct evaluations of the cooperation - an administrative cost corresponding to 1% of spending. The remaining administrative costs (9%) fall primarily under the ‘other’ category.
28
4. Fast Start (climate) Finance
4.1 Introduction During the 2009 climate summit in Copenhagen, the European Union made the unilateral decision to provide a total of EUR 7.2 billion (or EUR 2.4 billion annually) in fast start financing during the 2010-2012 period. This was intended to speed the availability of climate funding in developing countries. Fast start financing is designed to provide specific aid for adaptation and mitigation (including forestry and capacity building), with a special focus on the vulnerable and least developed countries. This commitment is supporting the international commitment to allocate a total of USD 30 billion to climate-related assistance by 2012. The Belgian government, via ex-Prime Minister Yves Leterme, proclaimed Belgium’s commitment to provide EUR 150 million over the 2010-2012 period. The Government of Flanders voluntarily chose to contribute to this target.
4.2
Overview of the supported climate-related assistance
With Flemish support, assistance was provided to developing countries to effectively address the impact of global warming and to achieve emission reductions. A total of EUR 5 million was allocated. The list below is intended to provide transparency regarding the projects that were supported within the scope of Fast Start Finance. The overview lists the total subsidy for which budgetary funding was allocated. This amount does not always correspond to the spending for that same year because subsidies are usually paid out via multiple instalments (and over the course of more than one financial year). In order to provide an indication of the overall commitment, the total subsidy is listed. To access a detailed project information and the project documents, simply enter the title in the search box at the upper right of the online database (more info can be found in section 5. Online access user guide). The projects carried out by the Flemish Partnership Water for Development can be viewed via the ‘List of cooperation forms’ at http://www.vlaanderen.be/int/oda/cooperationform
29
Š Mark Van Vaek
30
Flemish contribution to climate-related development assistance (2010-2012) Policy area
Project title
Implementing agency
Amount of subsidy (â‚Ź) per year 2010
2011
Projects concerning water, sanitation and the sustainable (meerdere) management of resources (Flemish Partnership Water for Development)
305.499
IV
Strengthening the capacity of humanitarian actors to in- UNEP tegrate environmental considerations into humanitarian action and early recovery
149.000
IV
Community Agroforestry Tree Seeds Banks (CATS Banks): ICRAF Building Agroforestry Tree Seed Platform for Diversifying Livelihoods Opportunity in Malawi and Mozambique
319.708
IV
Zembezi River Basin: Improve the disaster preparedness Rode Kruis and emergency response capacity of the Mozambican Red Cross (CVM)
314.000
IV
National Programme for Managing Climate Change in UNDP Malawi (One UN Fund)
275.000
IV
Building a larger Evergreen Agriculture Network for ICRAF Southern Africa
EWI
Regional Potential Assessment of Novel Bio-energy Crops UNIDO
EWI
Andean Glacier Multidisciplinary Network for Adaptation UNESCO Strategies (AGiaNAS)
343.750
EWI
Managing Water Resources in Arid and Semi-Arid regions UNESCO of Latin America and Caribbean
597.975
LNE
Afromaison. Protection of drinking water services by Antea Group means of basin protection, sensitization and capacity building in the municipality Fort Portal, Uganda
101.730
LNE
Adapting water resource management in the Comoros to UNDP expected climate change 2010-2014
150.000
LNE
Developing a people-centered wildlife policy in Zambia: UNDP Sharing revenue with communities in Game Management Areas: 2012-2013
150.000
LNE
Kenya: Adapting to Climate Change in Arid and Semi-Arid UNDP Lands (KACCAL) 2009-2013
150.000
LNE
Total
401.480
2012 214.664
1.500.000 78.192
774.207
990.480
3.286.311
31
4.3
ODA eligibility and additionality of climate finance
The Government of Flanders is obliged by Flemish Parliament Act to report on all ODA-eligible expenditures (see 1. Introduction). All of the projects and programmes listed above (1) are financed by the government, (2) constitute a 100% gift, and (3) are intended to address the socio-economic development of the recipient country. As a result, these projects are reported to the OECD. International agreements on climate-related development assistance have not been fully harmonised with the OECD reporting requirement. In the approved texts, Member States dictated that climate assistance must be ‘new’ and ‘additional’12, although the international community has not provided any further interpretation of the terms ‘new’ and ‘additional’. As a result, the relationship between climate funding and ODA has not been clarified. The European Union likewise failed to devise a clear definition of this when formulating its Fast Start Finance commitment. This means that both the OECD reporting requirement as well as the Fast Start Finance report submitted to the United Nations are applicable. As such, donors must comply with both reporting requirements. In the absence of a clear definition, many Member States have chosen creative ways of interpreting ‘new and additional’. Some Member States registered their annual contribution to the Global Environment Facility, a contribution that is clearly not ‘additional’ or ‘new’. Many different interpretations of the conditions were applied13. To apply the registration of climate-related assistance of the Government of Flanders as unambiguously and consistently as possible, the summary focused on the only concept that could be quantified, i.e. ‘new’. The summary table includes all subsidies that are aimed at climate-related development assistance since 1 January 2010 that meet the criteria for Fast Start Finance, and which were either: 1. not previously supported [see the aforementioned subsidies from the Economy, Science and Innovation (EWI), Flemish Foreign Affairs (IV) and Environment, Nature and Energy (LNE) Policy Areas], or 2. were supported in the past, but were allocated additional funds under the auspices of the Fast Start Finance commitment (see additional subsidies within the scope of the Flemish Partnership Water for Development). Because no internationally agreed-upon reference point has been agreed for testing the ‘additionality’ (the ODA in 2009? The budget for development cooperation in 2009? The expenditures of the environmental departments in 2009?), there has been no unambiguous way to measure the expenditures of the Government of Flanders. In order to stay as close as possible to the spirit of the climate agreement, the choice was made to consistently apply the concept of ‘new’ as outlined above.
12 Decision 1/CP.16: The Cancun Agreements – paragraph 96 - http://unfccc.int/resource/docs/2010/cop16/eng/07a01.pdf 13 The European Commission has published statistics and interpretation on the fast start funding of other Member States at http://ec.europa.eu/ clima/policies/finance/international/faststart/
32
5. Online access user guide
This appendix offers a number of instructions to users of the online ODA database for conducting searches. The online publication allows information to be quickly sorted according to area of interest so that users can effectively access information when searching for a specific type of expenditure or a specific type of subsidy.
5.1 Lists available online In order to access data on Flemish ODA more quickly, it was chosen to make these data available based on several different search parameters. The table below describes the search parameters that are available and lists the corresponding web address. Search parameter
Web address
Recipients: sorted according to recipient status (government, NGO, multilateral institution, scientific institute, ECT)
http://www.vlaanderen.be/int/oda/recipients
Sector: sorted according to sectors to which the flow of aid was directed
http://www.vlaanderen.be/int/oda/sectors
Region: sorted according to recipient region
http://www.vlaanderen.be/int/oda/region
Country: sorted according to recipient country
http://www.vlaanderen.be/int/oda/countries
Expenditure type: sorted according to policy goal (bilateral, multilateral, scientific research, etc.)
http://www.vlaanderen.be/int/oda/cooperationform
Year: (ODA year) sorted according to payment year
http://www.vlaanderen.be/int/oda/year
Policy area: sorted according to Flemish policy area (and its underlying entities) from which the ODA originated
http://www.vlaanderen.be/int/oda/policydomain
33
5.2
Navigating within the SharePoint environment
Every SharePoint list contains a ribbon located at the top indicating its location within the SharePoint environment.
The user can easily navigate from one list to another by clicking the title of the list. A drop-down menu containing the available lists appears.
The database contains all years of disbursement since 2011. But if we only want to search for payments that were made in one specific year (in this example, 2012), we have to click ‘year of payment’. A drop-down menu containing the available ODA years appears. Click the desired year.
34
The data are subdivided within the lists. The list of main sectors includes the following main sectors at the top (in alphabetical order):
If the user wants to obtain more information about the subsectors that are grouped under, for instance, the conflict sign. SharePoint then displays the total of the payprevention and resolution sector, he or she need to click the ments in the main sector and all underlying subsectors:
If we also want to view the underlying subsidies for each subsector, we then have to click the the subsector). The underlying project titles are displayed:
sign (to the left of
Click on the project title to access data for that project. A sheet appears containing all of the information related to the project’s objectives, the expected outcomes, the total subsidy, the payment in the selected year, etc. The bottom row of the sheet includes - when available (mainly 2012 payments) - a link to the project documents.
35
Users who want to combine more than one search parameter must make use of the list entitled ‘combining multiple parameters’. In the example below, results were filtered for contributions to multilateral institutions in 2012 in Malawi that were directed at agriculture. After clicking the project title, detailed information on the project is displayed.
Lastly, titles (or other project information) can also be entered directly into the search box at the top:
After confirmation, SharePoint displays the results of the search query.
36
37
Colofon
Publisher Koen Verlaeckt, Secretary General, Boudewijnlaan 30 b 80, 1000 Brussel Author Simon Calcoen Graphic design Ingrid Van Rintel, Services for the General Flemish Government Policy, Communication division Printing Agency Facility Management, Digitale Printing Catalogue number D/2013/3241/090 Edition March 2013
www.flanders.be