Elementary educationSCHOOL Leerlingen OVERVIEW POPULATION 1 GENERAL 1 School population in Flemish education 2009-2010 Full-time education
Part-time secondary education
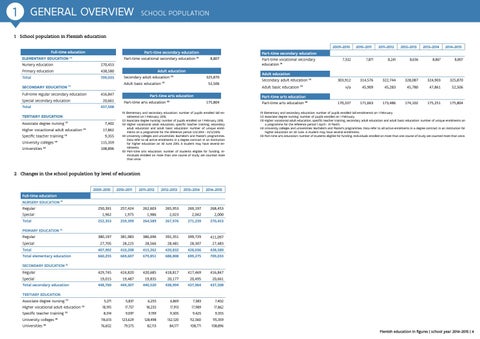
ELEMENTARY EDUCATION (1)
Part-time vocational secondary education (1)
Nursery education
270,453
Primary education
438,580
Total
709,033
Full-time regular secondary education
416,847 20,661
Special secondary education
437,508
Total TERTIARY EDUCATION Associate degree nursing (2)
7,402
Higher vocactional adult education Specific teacher training University colleges Universities
325,870 52,506
Adult basic education (3)
SECONDARY EDUCATION (1)
(3)
17,862 9,355
(3)
115,359
(4)
108,896
(4)
8,807
Adult education Secondary adult education (3)
Part-time arts education Part-time arts education
2011-2012
2012-2013
2013-2014
2014-2015
Part-time vocational secondary education (1)
7,332
7,871
8,241
8,636
8,867
8,807
303,912
314,576
322,744
328,087
324,903
325,870
n/a
45,909
45,283
45,780
47,861
52,506
170,337
171,663
173,486
174,102
175,251
175,804
Adult education Secondary adult education (3) Adult basic education (3) Part-time arts education
175,804
(5)
2010-2011
Part-time secondary education
(1) Elementary and secondary education: number of pupils enrolled (all enrolments) on 1 February 2015. (2) Associate degree nursing: number of pupils enrolled on 1 February 2015. (3) Higher vocational adult education, specific teacher training, secondary adult education and adult basic education: number of unique enrolments on a programme for the reference period 1/4/2014 - 31/3/2015. (4) University colleges and universities: Bachelor’s and Master’s programmes. Data refer to all active enrolments in a degree contract in an institution for higher education on 30 June 2015. A student may have several enrolments. (5) Part-time arts education: number of students eligible for funding. Individuals enrolled on more than one course of study are counted more than once.
Part-time arts education (5)
(1) Elementary and secondary education: number of pupils enrolled (all enrolments) on 1 February. (2) Associate degree nursing: number of pupils enrolled on 1 February. (3) Higher vocational adult education, specific teacher training, secondary adult education and adult basic education: number of unique enrolments on a programme for the reference period 1 April - 31 March. (4) University colleges and universities: Bachelor’s and Master’s programmes. Data refer to all active enrolments in a degree contract in an institution for higher education on 30 June. A student may have several enrolments. (5) Part-time arts education: number of students eligible for funding. Individuals enrolled on more than one course of study are counted more than once.
2 Changes in the school population by level of education 2009-2010
2010-2011
2011-2012
2012-2013
2013-2014
2014-2015
Full-time education NURSERY EDUCATION (1) 250,391
257,424
262,603
265,953
269,197
268,453
1,962
1,975
1,986
2,023
2,042
2,000
252,353
259,399
264,589
267,976
271,239
270,453
Regular
380,197
381,983
386,696
392,351
399,729
411,097
Special
27,705
28,225
28,566
28,481
28,307
27,483
Total
407,902
410,208
415,262
420,832
428,036
438,580
Total elementary education
660,255
669,607
679,851
688,808
699,275
709,033
429,745
424,820
420,685
418,817
417,469
416,847
Regular Special Total PRIMARY EDUCATION (1)
SECONDARY EDUCATION (1) Regular Special Total secondary education
19,015
19,487
19,835
20,177
20,495
20,661
448,760
444,307
440,520
438,994
437,964
437,508
5,271
5,837
6,255
6,869
7,383
7,402
18,195
17,757
18,235
17,913
17,989
17,862
8,314
9,097
9,199
9,305
9,425
9,355
116,613
123,629
128,498
132,120
112,360
115,359
76,602
79,575
82,113
84,177
108,771
108,896
TERTIARY EDUCATION Associate degree nursing (2) Higher vocational adult education Specific teacher training University colleges Universities
(4)
(4)
(3)
(3)
Flemish education in figures | school year 2014-2015 | 4