7 Effective Trading Strategies Every Trader Should Know Vince Stanzione Deriv.com
Stanzione
CFD warning disclaimer
The information and strategies presented in this ebook are intended for educational purposes only. They do not constitute financial advice, trading recommendations, or a comprehensive trading guide. The information within this book may become outdated.
The past is not a reliable guide to future performance, and strategies that have worked in the past may not work in the future. For practical application and further learning, we encourage you to explore Deriv Academy.
The information presented is intended for EU and non-EU retail and professional clients.
Products offered on deriv.com are considered complex derivatives and may not be suitable for retail clients. CFDs are complex instruments and come with a high risk of losing money rapidly due to leverage. 75% of retail investor accounts lose money when trading CFDs with Deriv Investments (Europe) Limited. You should consider whether you understand how CFDs work, and whether you can afford to take the risk of losing your money. The value of any trade, and the income derived from it, can go down as well as up, and your capital is at risk.
Trading conditions, products, and platforms may differ depending on your country of residence. For more information about our offerings, visit deriv.com, deriv.com/eu or deriv.ae.
Company information
Deriv Investments (Europe) Limited is a company incorporated in Malta with registration number C 70156, and its registered address is at W Business Centre, Level 3, Triq Dun Karm, Birkirkara, BKR 9033, Malta. Deriv Investments (Europe) Limited is licensed and regulated by the Malta Financial Services Authority under the Investment Services Act to provide investment services to EEA states under EU passporting rights. It is the manufacturer and distributor of its products.
Deriv Capital Contracts & Currencies L.L.C is a limited liability company registered in Dubai, UAE, under registration number 2279721. Its registered office (2402) and place of business (2201) are located at One by Omniyat, Business Bay, Dubai. The company is licensed and regulated by the Capital Market Authority (CMA) as a Category 1 Trading Broker for Overthe-Counter Derivatives Contracts & Currencies Spot Markets, a Financial Products Dealer (licence 20200000243), and a Category 5 Financial Consultant (licence 20200000199).
Deriv (FX) Ltd is licensed by the Labuan Financial Services Authority.
Deriv (BVI) Ltd is licensed by the British Virgin Islands Financial Services Commission.
Deriv (V) Ltd is licensed and regulated by the Vanuatu Financial Services Commission.
Deriv (Mauritius) Ltd is licensed by the Financial Services Commission, Mauritius.
Deriv Investments (Cayman) Limited is licensed and regulated by the Cayman Islands Monetary Authority under the Securities Investment Business Act.
Deriv.com Limited, a company registered in Guernsey, is the holding company for these entities.
Deriv (SVG) LLC has a registered office at First Floor, SVG Teachers Credit Union Uptown Building, Corner of James and Middle Street, Kingstown P.O., St. Vincent and the Grenadines.
For more information, visit https://deriv.com/regulatory.
Copyright 2026
Date of publication: 15.06.2026
About Deriv
Deriv is one of the world’s largest online brokers, offering CFDs and other derivatives on forex, stocks & indices, cryptocurrencies, commodities, and derived indices to over 3 million registered users globally. For 26 years, the company has been committed to making online trading accessible to anyone, anywhere, at any time. Deriv offers an expansive range of trade types across over 300 assets on award-winning, intuitive trading platforms. The company’s dedication to innovation and client satisfaction has earned it recognition including Most Transparent Broker, Most Innovative Online Trading Platform, and Best Trading Conditions.
About Vince Stanzione
Vince Stanzione has been trading markets for over 40 years and is a self-made multi-millionaire. He is the New York Times bestselling author of The Millionaire Dropout and is the author of the “Making Money from Financial Spread Trading” course. He has been quoted and featured favourably in over 200 newspapers, media outlets, and websites, including CNBC, Yahoo Finance, MarketWatch, Business Insider, Reuters.com, Forbes.com, Investopedia, Independent, Sunday Independent, Observer, Guardian, The Times, Sunday Times, Daily Express, What Investment, Growth Company Investor, New York Times, Bullbearings, City Magazine, Canary Wharf, Institutional Investor China, and Shares Magazine.
He mainly lives in Mallorca, Spain, and trades financial markets, including currencies, stocks, and commodities. Follow him for updates on X (formerly Twitter) at @vince_stanzione.
Introduction
In financial trading, there is no one-size-fits-all approach. Every strategy — from breakout trading to trend following — has its own advantages and disadvantages, and the secret is to choose the one that best suits your risk tolerance and trading style.
Just like we don’t all wear the same clothes or drive the same colour or model of car, we don’t all have to trade the same system or the same markets. Your time zone and lifestyle should also factor into the choice.
That said, many experienced traders run more than one strategy in parallel. I wouldn’t recommend trying to trade all seven, especially when you’re starting out. Pick one or two that suit you, learn them deeply, and build out from there.
Whichever strategy you choose, three things will determine your success: having a plan, controlling risk, and staying flexible enough to adapt. Keep learning, keep experimenting, and let experience refine your edge.
This ebook is best treated as an introduction and a starting point — a foundation you can build on as you develop. There are far more than seven strategies out there in the wider world of trading, but these are good places to start.
Try before trading with real funds
With Deriv, you have access to the full trading platform and tools, and a free demo practice account lets you test trading strategies without risk. When you’re ready to trade with real money, you can open an account with as little as $5.
What markets to trade
In this ebook I am focusing on the strategies themselves rather than on specific markets. The systems I cover can be applied to any financial market that trades freely.
For market-specific guidance, you will find dedicated coverage of Synthetic Indices, forex, commodities, stocks and stock indices, and cryptos in my other ebooks. Links are in the useful websites section at the end.
How to pick the best strategy for you
No single trading strategy works for everyone. Your goals, risk tolerance, time commitment, and comfort with volatility all shape what the right strategy looks like for you.
Recognise your risk tolerance and your trading personality style
Successful trading is not just about watching prices or charts; your psychology and personality have a huge influence on your results. Do you prefer something steady, or are you comfortable riding sudden ups and downs?
If you prefer a slower pace, position trading and trend trading are likely to suit you better.
If you enjoy making quick judgments and can handle the pressure of short-term trading, day trading or scalping may be a better fit.
Rapid advances in technology and AI are driving fast growth in automation, and used well, these tools can genuinely help. But they don’t replace the basics; you still need to learn the fundamentals and build a plan.
Continue learning and adapting
I am now into my 41st year of trading and investing, and even now, I read and learn every day. Politics, economic events, and shifts in technology all influence how well a given strategy works at any moment.
Smart traders stay curious, never stop learning, and adapt their strategies as conditions change. Artificial intelligence (AI) is already making big changes in the way markets trade, and I believe that trend will only accelerate.
Be wary of get rich quick systems
Avoid anything that promises a “secret trading system,” “quick easy gains,” or “guaranteed profits.” In today’s social media and AI world, flashy ads and fake success stories are everywhere, and new traders are the prime target. If something looks too good to be true, it almost always is.
Only rely on signals or advice from reliable, verified sources, and always do your own research. In all of my ebooks, including this one, I never make outrageous claims or guarantee overnight wealth. You also don’t need expensive software or a multi-screen trading desk. Despite what the ads suggest, none of it is required.
I have become very wealthy from trading financial markets, but it has not been an overnight success story. It rarely is.
7 trading strategies overview
Here is a brief overview of seven popular trading strategies, listed in alphabetical order. I will then explain each of them in detail.
Breakout trading
Enters positions when price breaks above resistance or below support. With many excellent trading sites now available, finding these opportunities is far easier than it used to be, when you had to scan charts one by one. You can run filters and patternrecognition systems instead, and most of them are free or lowcost. At the end of this ebook, I’ll share the sites and filters I use myself.
Day trading
Buying and selling assets within the same trading day, often
holding positions for only minutes at a time. The style has grown in popularity alongside advances in technology, real-time pricing, faster internet, and low or zero commissions.
Momentum trading “Momo”
Capitalises on strong price movement and trading volume to ride short bursts. The style has grown in popularity alongside platforms like Reddit and Twitter (X), where trading ideas are shared with millions of people around the globe in real time.
News trading
Reacts to events and economic news to capture sudden market movements. Markets can swing sharply on a single trigger — a tweet from President Donald Trump, a central bank announcement, or a geopolitical flare-up. Commodities like Gold and Oil are particularly sensitive to geopolitical news.
Scalping
Executes a high volume of small trades throughout the day to capture minimal price moves. It is best suited to a laptop or larger screen set-up. Scalping can also be automated using a trading bot, allowing you to set predefined rules for both entries and exits.
Swing trading
Uses technical analysis to capture medium-term price movements over days or weeks. The typical approach is to go long into an upswing, then close and reverse (going short) into a downswing — allowing you to profit from both sides of the market.
Trend following — position trading
Identifies sustained upward and downward movements for longterm gains. This is one of my personal favourites, a style that suits me, and one I’ve been using for well over 30 years. It can be used
to profit from both long (up) and short (down) trends.
Position trading is a long-term strategy built around major market trends and underlying fundamentals. Because position trading and trend following work hand in hand, I cover them together. Typically, it involves going long and holding for weeks, months, or even years, and you’ll usually have more than one position running at the same time.
Trading time frames
Fast (seconds to hours)
• Breakout trading
• Day trading
• Momentum trading
• News trading
• Scalping
Using AI
Medium (days to weeks)
• Swing trading
Long-term (weeks to months)
• Position trading
• Trend following
Before getting into the strategies themselves, it’s worth considering how AI fits into your trading. Used well, it can cut down research time that previously took hours of manual work.
After each strategy in this ebook, you will find a checklist and a set of system ideas that you can paste directly into platforms such as Grok, Gemini, or ChatGPT as prompts. Don’t rely on AI alone to make your trading decisions, but do treat it as a capable assistant.
With AI, the quality of the prompt is everything. A vague request gives you vague output, but a specific one does real work.
For example: “Show me the S&P 500 stocks that are up more than 1% today and are breaking out to a 20-day high.” That kind of targeted prompt will surface candidates in seconds.
It’s worth keeping some perspective, though. Sites like finviz.com and barchart.com have been offering filtering tools for many years — I have been using barchart.com myself for over 25 years. Filters and pattern recognition are not new; what AI changes is the speed and the natural-language ease with which you can apply them.
7 Effective Trading Strategies Every Trader Should Know
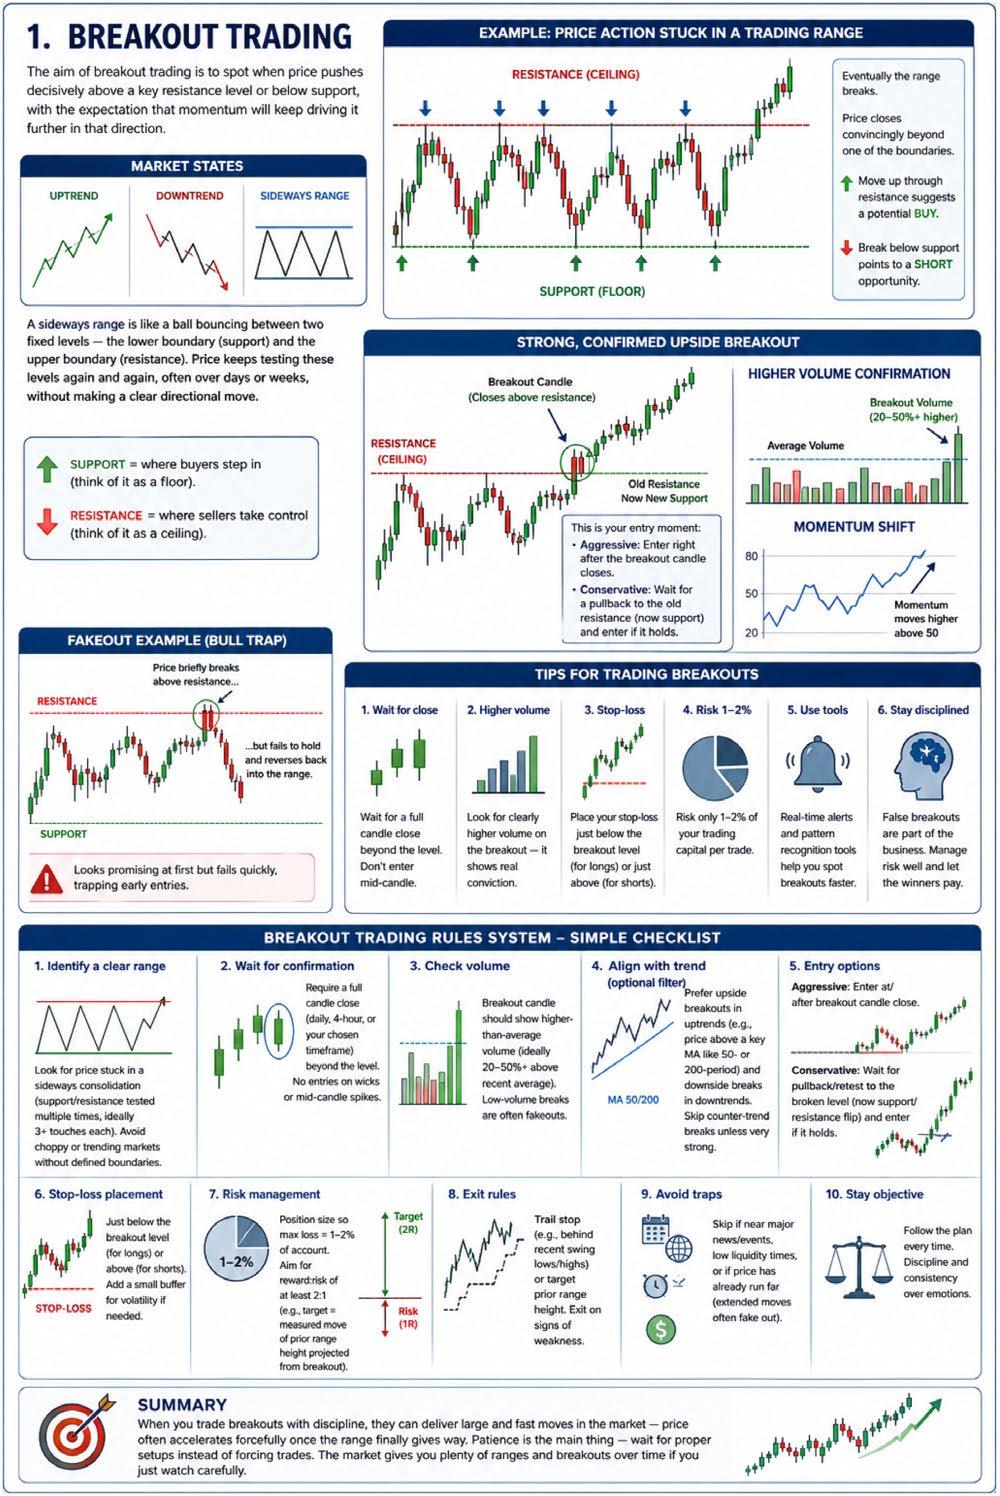
The aim of breakout trading is to spot when price pushes decisively above a key resistance level or below support, with the expectation that momentum will keep driving it further in that direction.
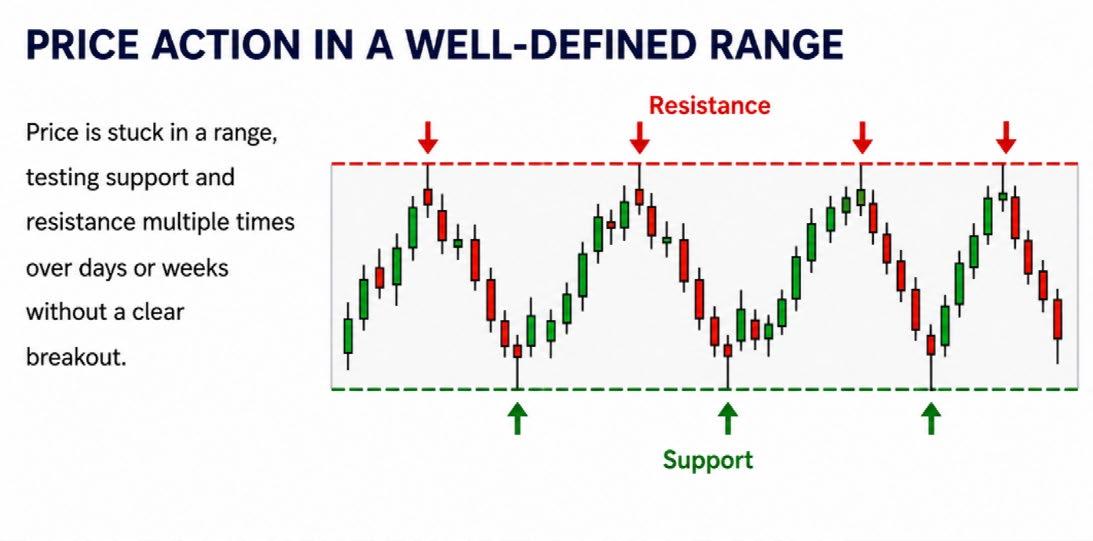
Markets trade in one of three states: uptrend, downtrend, or sideways range. A sideways range is like a ball bouncing between two fixed levels — the lower boundary (support) and the upper boundary (resistance). Price keeps testing these levels again and again, often over days or weeks, without making a clear directional move.
Support is where buyers step in — think of it as a floor.
Resistance is where sellers take control — think of it as a ceiling.
Here you can see an example of price action stuck in a well-defined trading range, with repeated tests of support and resistance. Eventually, the range breaks.
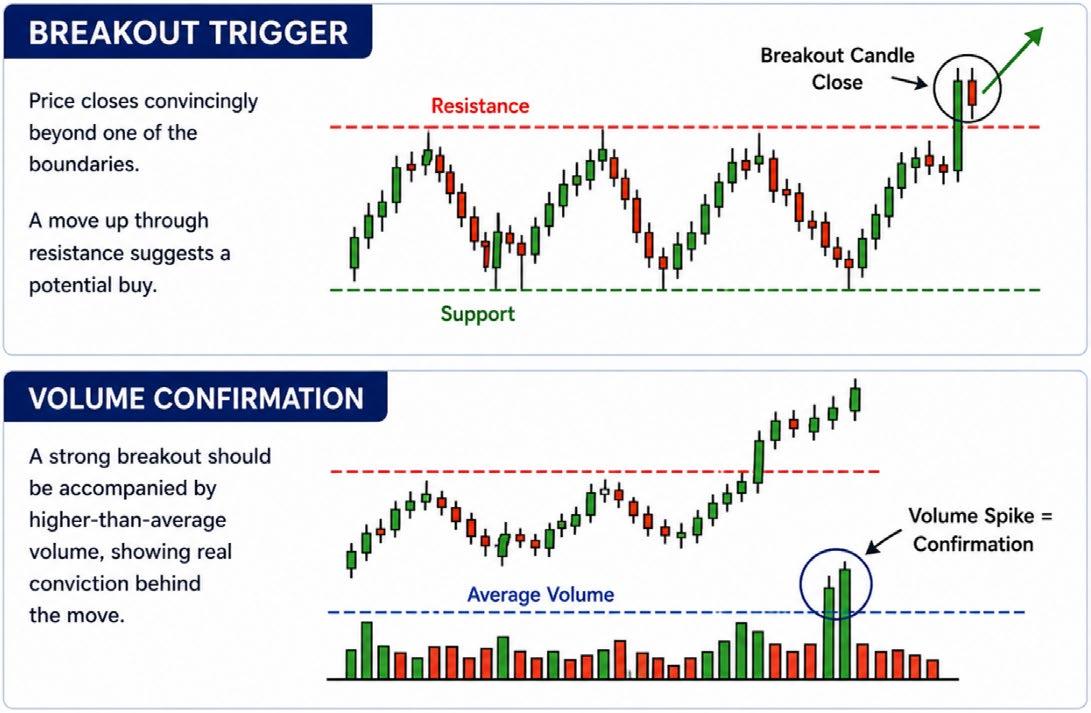
Price closes convincingly beyond one of the boundaries. A move up through resistance suggests a potential buy, while a break below support points to a short opportunity.
The next charts show a strong, confirmed upside breakout, backed by higher volume and a clear change in momentum. This is your entry moment: either jump in right after the breakout candle closes, or wait for a small pullback to the old resistance (which often turns into new support).
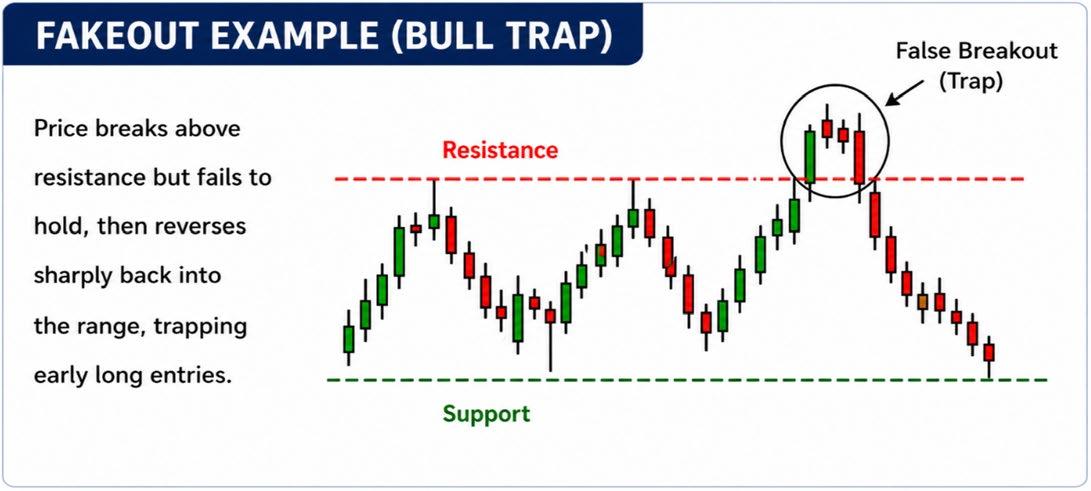
The logic is simple: a real breakout releases all the built-up pressure. Traders caught on the wrong side of the range have to cover their positions, hitting stops and adding even more fuel to the move. Not every breakout is a true one. Some are false (fakeouts), where price pokes through the level briefly then reverses hard and goes back into the range, trapping early entries.
Here’s a classic fake out example — looks promising at first but fails quickly.
Tips for trading breakouts
To cut down on false signals: Wait for a full candle close beyond the level (don’t enter mid-candle).
Look for clearly higher volume on the breakout — it shows real conviction at those prices.
Put your stop-loss just below the breakout level for longs (or just above for shorts) so if you’re wrong, the loss stays manageable.
Risk only 1–2% of your trading capital per trade.
Real-time alerts and pattern recognition tools can help you spot breakouts faster and get in before the move really takes off.
Don’t lose heart after a few false breakouts — it’s just part of the business. With good money management, you keep the false breakout losses small, and then one or two good breakouts will pay those losses off and put you ahead.
Breakout trading rules system — simple checklist
Use this step-by-step checklist for every potential setup to keep things disciplined and objective:
• Identify a clear range — Look for price stuck in a sideways consolidation (support/resistance tested multiple times, ideally 3+ touches each). Avoid choppy or trending markets without defined boundaries.
• Wait for confirmation — Require a full candle close (daily, 4-hour, or your chosen timeframe) beyond the level. No entries on wicks or mid-candle spikes.
• Check volume — Breakout candle should show higher-thanaverage volume (ideally 20-50%+ above recent average). Lowvolume breaks are often fakeouts.
• Align with trend (optional filter for higher probability) — Prefer upside breakouts in uptrends (e.g., price above a key moving average like 50- or 200-period) and downside breaks in downtrends. Skip counter-trend breaks unless very strong.
• Entry options
◦ Aggressive: Enter at/after breakout candle close.
◦ Conservative: Wait for pullback/retest to the broken level (now support/resistance flip) and enter if it holds.
• Stop-loss placement — Just below the breakout level (for longs) or above (for shorts). Add a small buffer for volatility if needed.
• Risk management — Position size so max loss = 1-2% of account. Aim for reward:risk of at least 2:1 (e.g., target = measured move of prior range height projected from breakout).
• Exit rules — Trail stop (e.g., behind recent swing lows/highs) or target prior range height. Exit on signs of weakness (e.g., failure to hold new support).
• Avoid traps — Skip if near major news/events, low liquidity times, or if price has already run far (extended moves often fake out)
This checklist filters out most weak setups and helps you focus on the higher-probability ones.
Summary
When you trade breakouts with discipline, they can deliver large and fast moves in the market — price often accelerates forcefully once the range finally gives way. Patience is the main thing — wait for proper setups instead of forcing trades. The market gives you plenty of ranges and breakouts over time if you just watch carefully.
7 Effective Trading Strategies
Every Trader Should Know
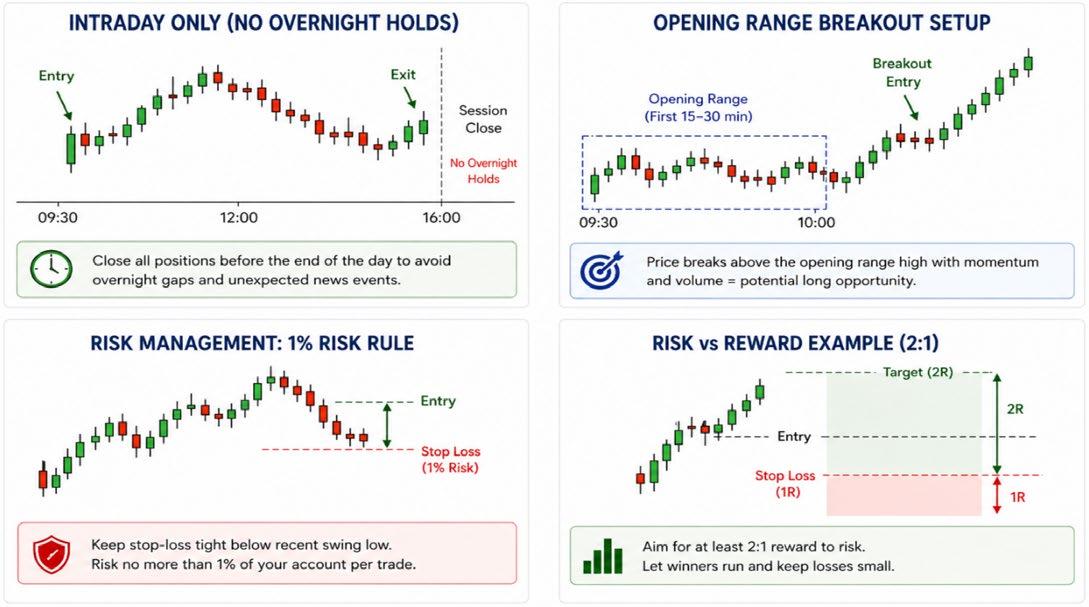
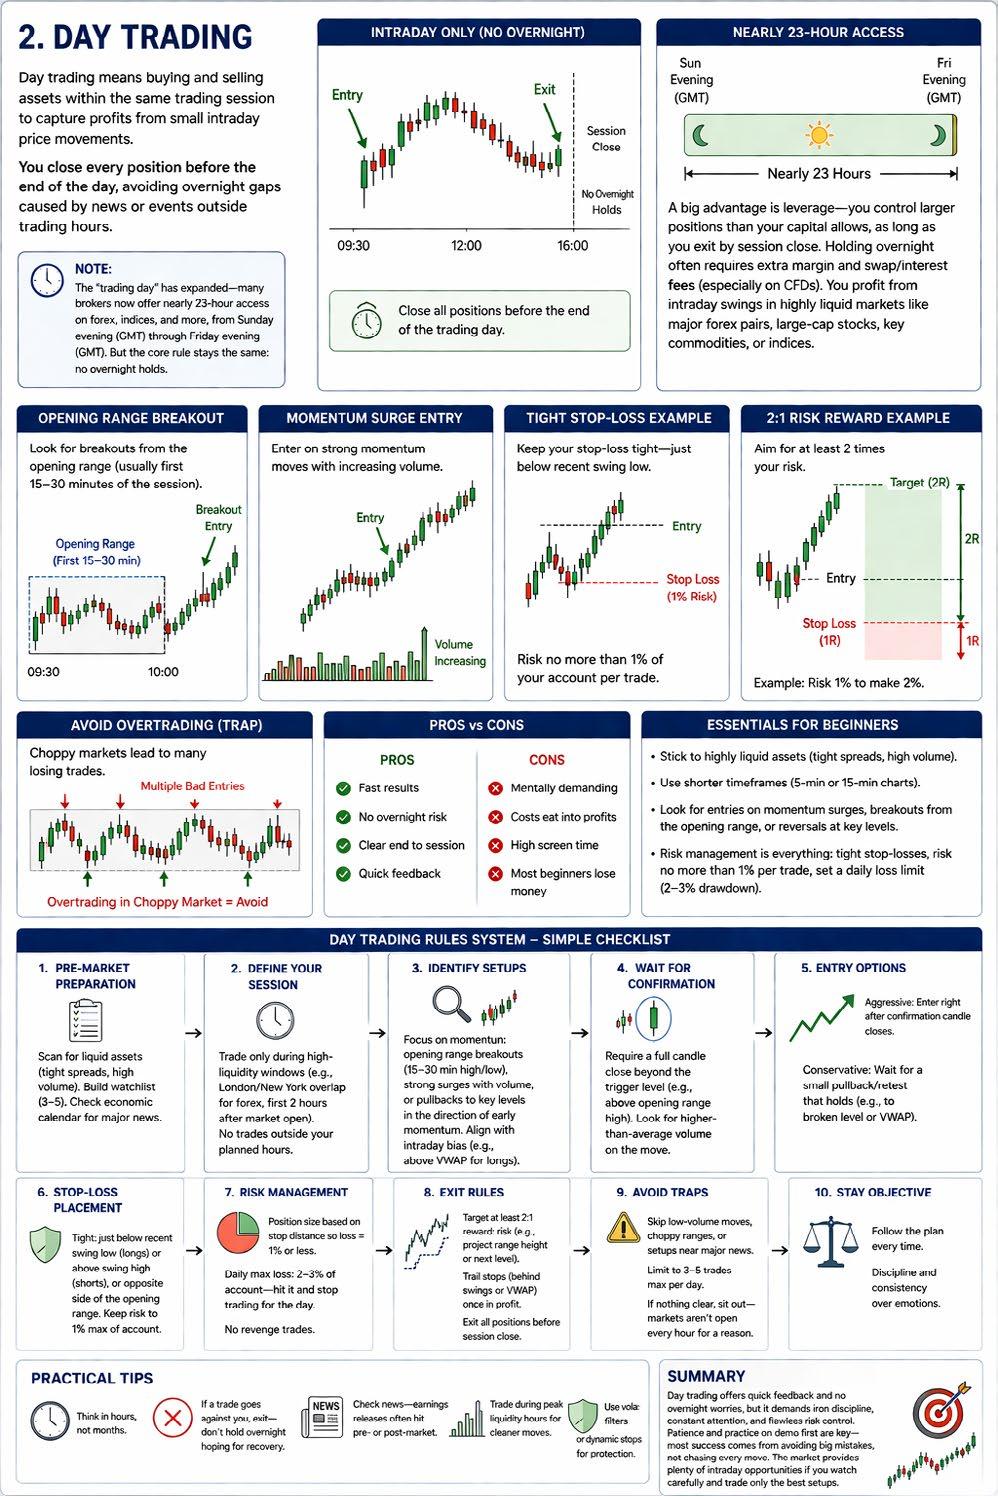
Day trading means buying and selling assets within the same trading session to capture profits from small intraday price movements. Every position is closed before the end of the day, which avoids the overnight gaps that news or events outside trading hours can cause.
Note: the “trading day” has expanded — many brokers now offer nearly 23-hour access on forex, indices, and more, running from Sunday evening (GMT) through Friday evening (GMT). The core rule, though, stays the same: no overnight holds.
A big advantage is leverage — you can control larger positions than your capital alone would allow, provided you exit by session close. Holding overnight typically requires extra margin and incurs swap or interest fees, especially on CFDs.
Day traders profit from intraday swings in highly liquid markets like major forex pairs, large-cap stocks, key commodities, or indices.
Why choose day trading?
It eliminates overnight gap risk and lets you compound small daily gains. It’s fast-paced, gives quick feedback, and suits traders who thrive on intensity and screen time.
Essentials for beginners
Stick to highly liquid assets with tight spreads and high volume (e.g., EUR/USD, major stock indices, or blue-chip stocks).
Use shorter timeframes like 5-minute or 15-minute charts.
Look for entries on momentum surges, breakouts from the opening range, or reversals at key support/resistance.
Risk management is everything: tight stop-losses, risk no more than 1% of your account per trade, and set a daily loss limit (e.g., stop trading after 2–3% drawdown).
✅ Pros
• Fast results and no overnight stress.
• Clear end to each session—no wondering what happens while you sleep.
❌ Cons
• Mentally demanding and requires constant focus.
• Spreads/commissions eat into profits, so you need an edge.
• High screen time.
Most beginners lose money due to overtrading, chasing, or revenge trades after losses. Start small, practice extensively on demo accounts —discipline beats everything else.
Practical tips
Think in hours, not months. If a trade goes against you, exit—don’t hold overnight hoping for recovery. Review the news trading section for overlap (e.g., earnings releases often hit pre- or post-market). Trade during peak liquidity hours for cleaner moves. Use volatility filters or dynamic stops for protection, but keep it simple at first.
Day trading rules system (simple checklist)
Follow this step-by-step checklist to stay disciplined and avoid emotional decisions:
• Pre-market preparation — Scan for highly liquid assets (tight spreads, high volume). Build a watchlist of 3–5 instruments. Check economic calendar for major news—avoid trading right into big events unless experienced.
• Define your session — Trade only during high-liquidity windows (e.g., London/New York overlap for forex, first 2 hours after stock open). No trades outside your planned hours.
• Identify setups — Focus on momentum: opening range breakouts (first 15–30 min high/low), strong surges with volume, or pullbacks to key levels in the direction of early momentum. Align with any clear intraday bias (e.g., above VWAP for longs).
• Wait for confirmation — Require a full candle close beyond the trigger level (e.g., above opening range high). Look for higher-thanaverage volume on the move—low volume = likely fakeout.
• Entry options
◦ Aggressive: Enter right after confirmation candle closes.
◦ Conservative: Wait for a small pullback/retest that holds (e.g., to broken level or VWAP).
• Stop-loss placement — Tight: just below recent swing low (longs) or above swing high (shorts), or opposite side of the opening range. Keep risk to 1% max of account.
• Risk management — Position size based on stop distance so loss = 1% or less. Daily max loss: 2–3% of account—hit it and stop trading for the day. No revenge trades.
• Exit rules — Target at least 2:1 reward: risk (e.g., project range height or next level). Trail stops (behind swings or VWAP VolumeWeighted Average Price) once in profit. Exit all positions before session close—no exceptions.
• Avoid traps — Skip low-volume moves, choppy ranges, or setups near major news. Limit to 3–5 trades max per day. If nothing clear, sit out—markets aren’t open every hour for a reason.
This checklist filters weak ideas, caps damage from bad days, and lets good momentum trades do the work.
Summary
Day trading offers quick feedback and no overnight worries, but it demands iron discipline, constant attention, and flawless risk control. Patience and practising first on a demo account are key. Most success comes from avoiding big mistakes, not from chasing every move. The market gives you plenty of intraday opportunities if you watch carefully and trade only the best setups.
7 Effective Trading Strategies
Every Trader Should Know
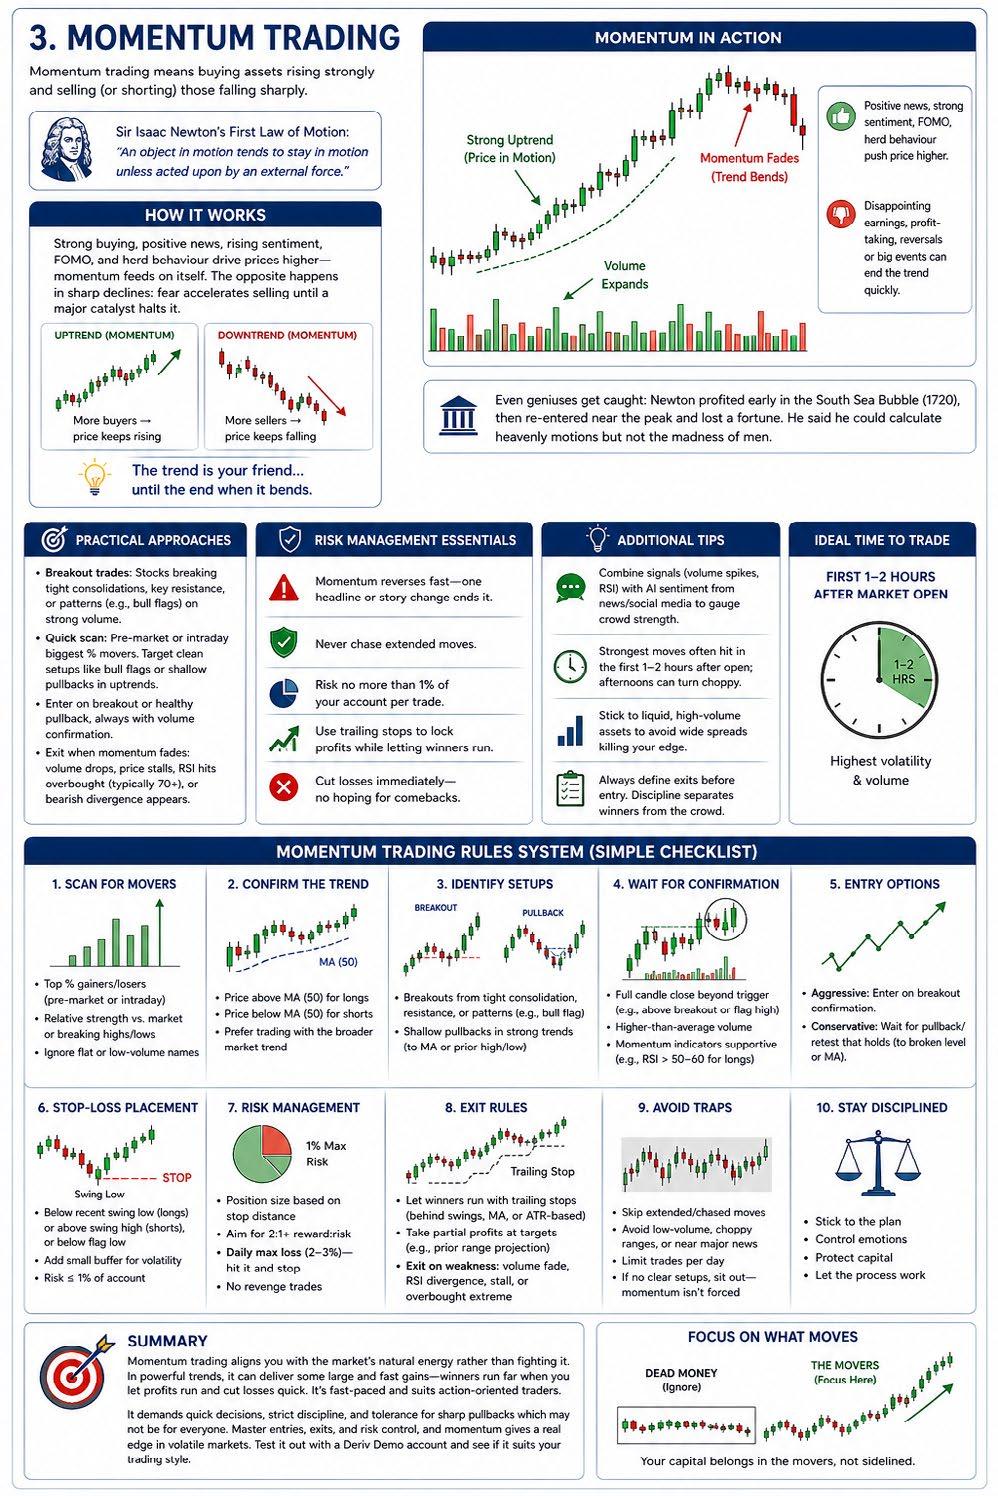
Momentum trading means buying assets rising strongly and selling (or shorting) those falling sharply.
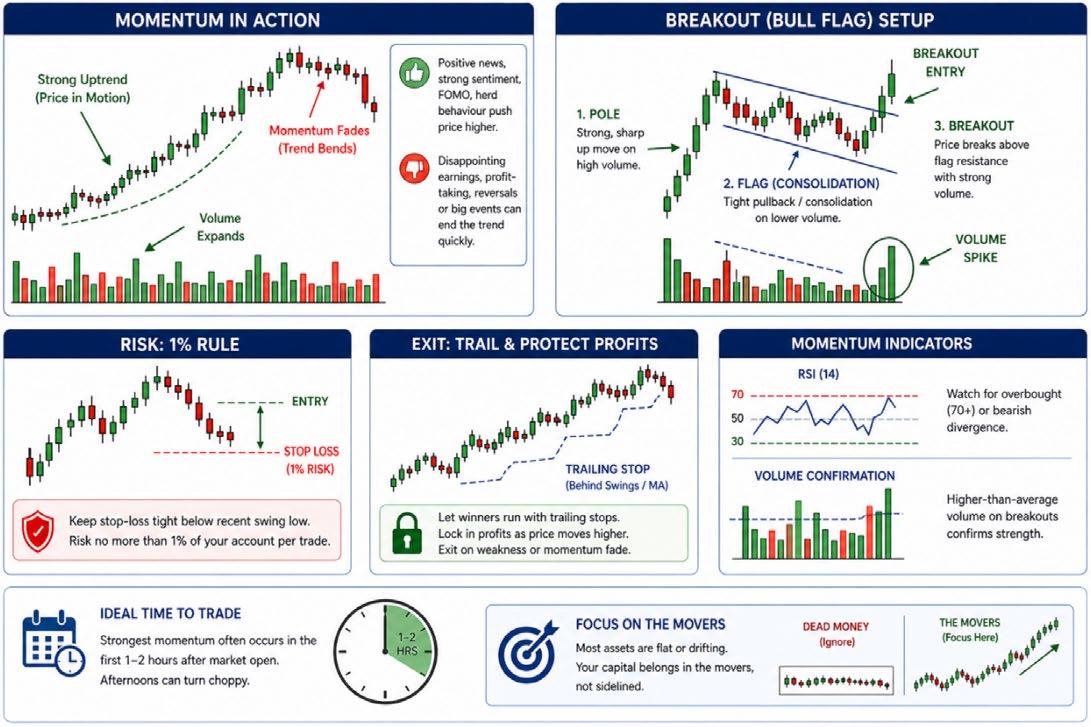
In the short term, what’s moving in one direction tends to keep going that way. This draws from Sir Isaac Newton’s First Law of Motion: “An object in motion tends to stay in motion unless acted upon by an external force.”
How this applies to markets
A surging stock or asset stays in motion thanks to sustained buying, positive news, rising sentiment, FOMO, and herd behaviour. Momentum feeds itself: more participants pile in, pushing prices higher. The same logic works in reverse during sharp declines, where fear accelerates selling until a major catalyst halts it.
As traders often say: “The trend is your friend… until the end when it bends.” Trends can persist powerfully, but they end when something breaks them — disappointing earnings, heavy profit-taking, a market reversal, or a major event.
Even geniuses get caught: Newton profited early in the South Sea Bubble of 1720, then re-entered near the peak and lost a fortune. He famously quipped that he could calculate the motion of the heavenly bodies, but not the madness of men.
Reality check: Most stocks/assets barely move on any day—flat or drifting. Momentum traders ignore “dead money” and focus only on those showing significant action. Your capital belongs in the movers, not sidelined.
Practical momentum trading approaches
Breakout trades: Stocks breaking tight consolidations, key resistance, or patterns (e.g., bull flags) on strong volume. The breakout candle shows conviction—price pushing with expanding volume.
Quick scan: Pre-market or intraday biggest % movers. Target clean setups like bull flags or shallow pullbacks in uptrends.
Enter on breakout or healthy pullback, always with volume confirmation. Hold minutes to hours (or days in strong trends).
Exit when momentum fades: volume drops, price stalls, RSI hits overbought (typically 70+), or bearish divergence appears.
Risk management essentials
Momentum reverses fast —one headline or story change ends it. Never chase extended moves. Risk no more than 1% of your account per trade. Use trailing stops to lock profits while letting winners run. Cut losses immediately —no hoping for comebacks.
Additional tips that work in practice
Combine signals (volume spikes, RSI) with tools like AI sentiment from news/social media to gauge crowd strength.
Strongest moves often hit in the first 1–2 hours after open; afternoons can turn choppy.
Stick to liquid, high-volume assets to avoid wide spreads killing your edge.
Always define exits before entry. Discipline separates winners from the crowd.
Momentum
trading rules system (simple checklist)
Use this step-by-step checklist for every setup to stay objective and disciplined:
• Scan for movers — Focus on assets with strong recent momentum: top % gainers/losers (pre-market or intraday), relative strength vs. market/index, or breaking highs/lows. Ignore flat or low-volume names.
• Confirm the trend — Ensure overall bias aligns: price above key moving average (e.g., 50-period) for longs, below for shorts. Prefer trading with the broader market trend.
• Identify setups — Look for: Breakouts from tight consolidation, resistance, or patterns (e.g., bull flag: sharp pole up + tight pullback/consolidation).
• Shallow pullbacks in strong trends (e.g., to moving average or prior high/low).
• Wait for confirmation — Require: Full candle close beyond trigger (e.g., above breakout level or flag high).
• Higher-than-average volume (spike on move).
• Momentum indicators supportive (e.g., RSI above 50-60 for longs, not extreme overbought yet).
• Entry options
◦ Aggressive: Enter on breakout confirmation.
◦ Conservative: Wait for pullback/retest that holds (e.g., to broken level now support, or moving average).
• Stop-loss placement — Below recent swing low (longs) or above swing high (shorts), or below flag low. Add small buffer for volatility. Keep risk ≤1% of account.
• Risk management — Position size based on stop distance. Aim for 2:1+ reward:risk. Daily max loss limit (e.g., 2-3%)—hit it and stop. No revenge trades.
• Exit rules — Let winners run: Trail stops (behind swings, moving average, or Average True Range ATR-based). Take partial profits at targets (e.g., prior range projection). Exit on weakness: volume fade, RSI divergence, stall, or overbought extreme.
• Avoid traps — Skip extended/chased moves, low-volume, choppy ranges, or near major news. Limit trades per day. If no clear setups, sit out—momentum isn’t forced.
• Stick to the plan —it filters noise, protects capital, and captures real momentum when it appears.
Summary
Momentum trading aligns you with the market’s natural energy rather than fighting it. In powerful trends, it can deliver some large and fast gains—winners run far when you let profits run and cut losses quick. It’s fast-paced and suits action-oriented traders.
Momentum trading demands quick decisions, strict discipline, and a tolerance for sharp pullbacks. It’s not for everyone. But if you master entries, exits, and risk control, it can give you a real edge in volatile markets. Test it out on a Deriv Demo account first and see whether it suits your style.
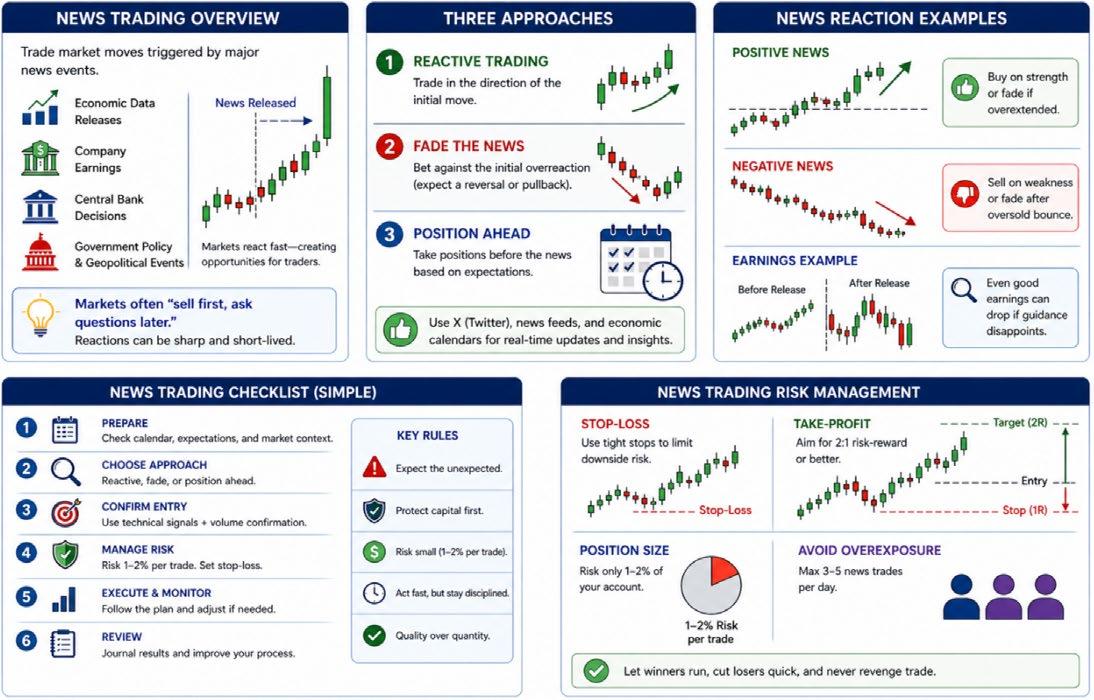
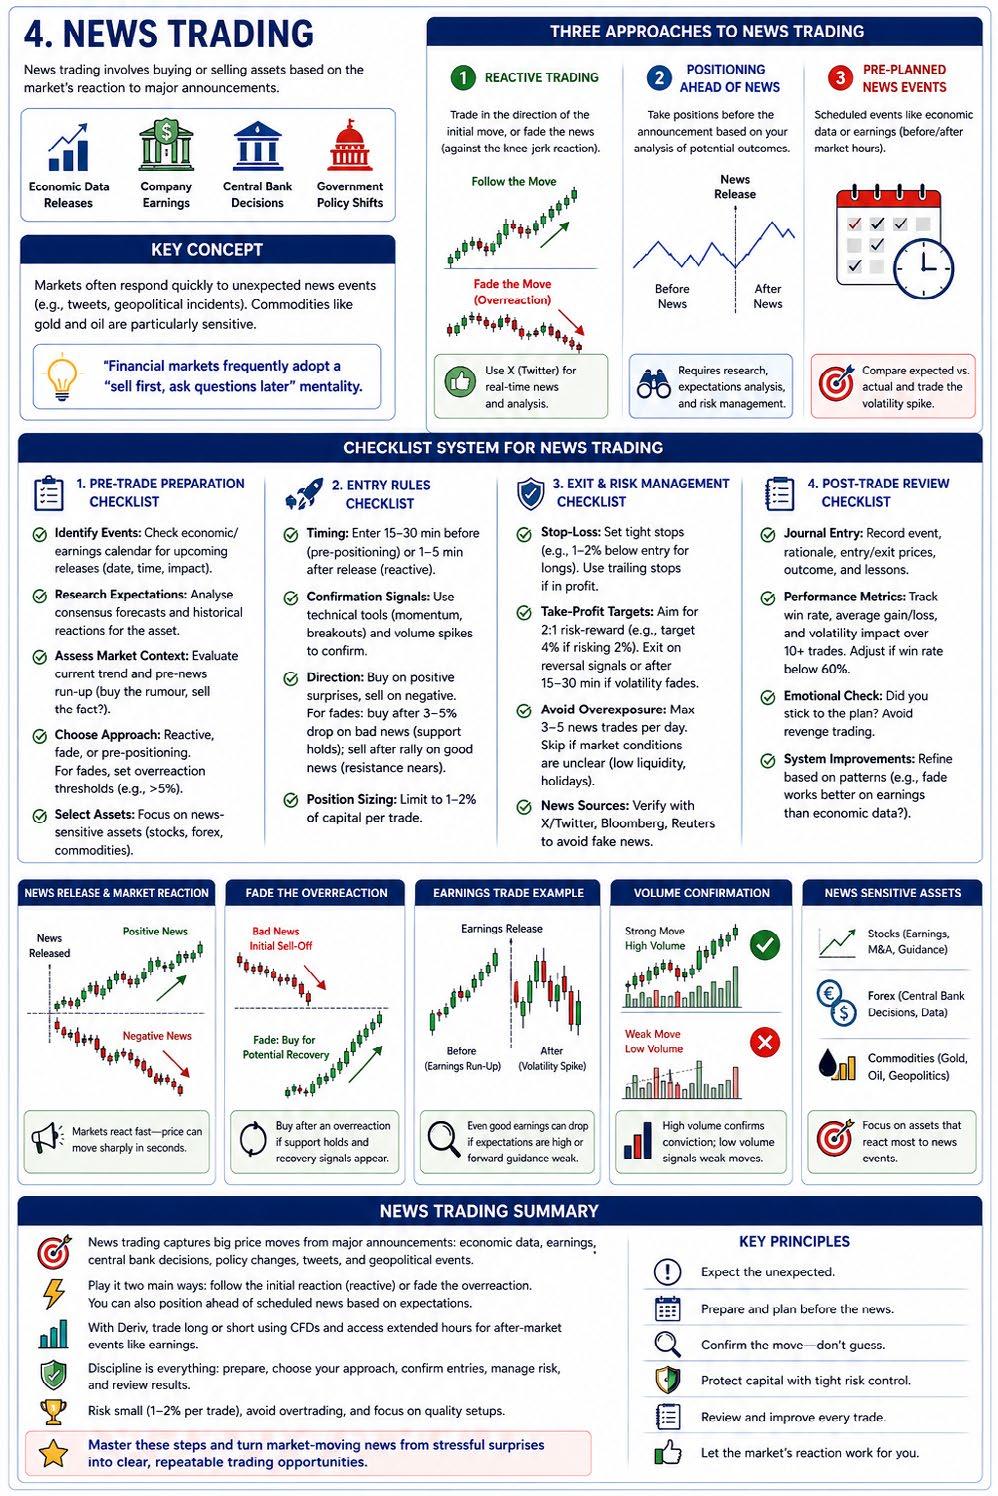
News trading involves buying or selling assets based on the market’s reaction to major announcements — economic data releases, company earnings, central bank decisions, or shifts in government policy. Any of these can trigger significant market movements within seconds.
Markets also respond quickly to unexpected news — a tweet from a high-profile figure like President Donald Trump or Elon Musk, or a geopolitical incident. Commodities like gold and oil are particularly sensitive to these kinds of developments.
News trading often complements the breakout and momentum strategies discussed earlier, where a news event becomes the catalyst that triggers a breakout. There are several different approaches you can take to profit from news:
Reactive trading
When news is released, the market may react positively or negatively. You can trade in the direction of this initial move. Alternatively, you might “fade” the news, betting against the knee-jerk reaction—for instance, selling on good news (anticipating an overreaction) or buying after an initial sell-off on bad news, expecting a recovery. Financial markets frequently adopt a “sell first, ask questions later” mentality, leading to sharp sell-offs on poor earnings announcements, followed by potential rebounds as more details emerge.
X (formerly Twitter) remains an excellent source for real-time news and analysis.
Positioning ahead of news
You can establish positions in anticipation of upcoming news, based on your analysis of potential outcomes. This requires careful research to gauge market expectations and position accordingly, while managing risk in case the news surprises the market.
Pre-Planned News Events
Many news releases are scheduled in advance, such as government economic data or company earnings, which are typically announced before or after regular market hours. In the US markets I primarily trade, “earnings season” sees companies in the same sector report results around similar times — for example, banking stocks followed by technology firms. Online calendars are readily available to track these events.
Do your homework by comparing expected versus actual figures. Trade the volatility spike immediately after the release. Note that even strong earnings matching expectations can lead to price declines if forward guidance disappoints. Markets are forward-looking, so they focus on future prospects. Additionally, if a stock has rallied into earnings, you might encounter a “buy the rumour, sell the fact” scenario, where the price drops post-announcement despite positive news.
The good news is that with Deriv, you can use CFDs to trade both long and short, so you don’t have to be focused on just positive moves. Also, they now offer extended hours trading on major stocks, which means you can open and close trades during the “after hours” when earnings are released. Previously, you would have to wait until the next trading day.
Checklist system ideas for news trading
Similar to the previous strategies, here’s a structured checklist to help implement news trading systematically. This can be adapted into your trading plan, with ideas for rules, risk management, and evaluation. Use it as a pre-trade routine to ensure discipline.
Pre-trade preparation checklist
Identify Events: Review an economic or earnings calendar (e.g., via sites like Investing.com or Yahoo Finance) for upcoming releases. Note the date, time, and expected impact (high/medium/low volatility).
Research Expectations: Analyse consensus forecasts (e.g., expected EPS for earnings or GDP figures). Check historical reactions to similar events for the asset.
Assess Market Context: Evaluate current trends— is the asset in an uptrend/downtrend? Has there been a pre-news run-up (potential “buy the rumour, sell the fact”)?
Choose Approach: Decide on reactive (post-news), fade, or prepositioning. For fading, identify overreaction thresholds (e.g., >5% initial move).
Select Assets: Focus on news-sensitive ones like stocks, forex pairs (e.g., USD on Fed news), or commodities (gold/oil on geopolitics).
Entry rules checklist. Timing:
For pre-planned news, enter positions 15-30 minutes before if positioning ahead, or wait 1-5 minutes post-release for reactive trades to avoid whipsaws.
Confirmation Signals: Use technical indicators from prior strategies (e.g., momentum oscillators or breakouts). Enter only if volume spikes confirm the move.
Direction: Buy on positive surprises/reactions; sell on negative. For fades: Buy after a 3-5% drop on bad news if support levels hold; sell after a rally on good news if resistance nears.
Position Sizing: Limit to 1-2% of capital per trade to manage volatility.
Exit and risk management checklist
• Stop-Loss: Set tight stops (e.g., 1-2% below entry for longs) to protect against adverse moves. Use trailing stops if the trade goes in your favour.
• Take-Profit Targets: Aim for 2:1 risk-reward ratio (e.g., target 4% gain if risking 2%). Exit on reversal signals or after 15-30 minutes if volatility fades.
• Avoid Overexposure: No more than 3-5 news trades per day; skip if market conditions are unclear (e.g., low liquidity holidays).
• News Sources: Cross-verify with reliable real-time feeds like X/ Twitter, Bloomberg, or Reuters to avoid fake news.
• Post-Trade Review Checklist. Journal Entry: Record the news event, your rationale, entry/exit prices, and outcome. Note if expectations matched actuals and why the trade succeeded/failed.
• Performance Metrics: Track win rate, average gain/loss, and volatility impact over 10+ trades. Adjust strategy if the win rate is below 60%.
• Emotional Check: Did you stick to the plan? Avoid revenge trading after losses.
• System Improvements: Refine based on patterns (e.g., fade works better on earnings than economic data?).
Summary
News trading is all about catching the big price moves that happen when important announcements hit the market — whether that’s economic data, company earnings, central bank decisions, or surprise events like a major tweet or geopolitical flare-up.
Markets can react fast and strongly, so this strategy works well alongside the breakout and momentum approaches we covered earlier.
You have two main ways to play it: Jump in reactively right after the news and follow the initial move, or “fade” it by trading against the knee-jerk reaction.
Or position yourself ahead of scheduled news by studying what the market expects and managing your risk in case things go differently.
With Deriv, you can go long or short using CFDs and even trade during extended hours, so you’re not stuck waiting until the next day after earnings.
The key to success is staying disciplined. Use the checklist system: prepare by checking the calendar and expectations, pick your approach, set clear entry rules with confirmation, protect every trade with tight stops, and always review what happened afterward. Keep your risk small (1-2% per trade) and don’t overdo it a few well-planned news trades are better than many emotional ones. Master this, and you’ll turn market-moving events from stressful surprises into clear trading opportunities.
7 Effective Trading Strategies
Every Trader Should Know
Scalping
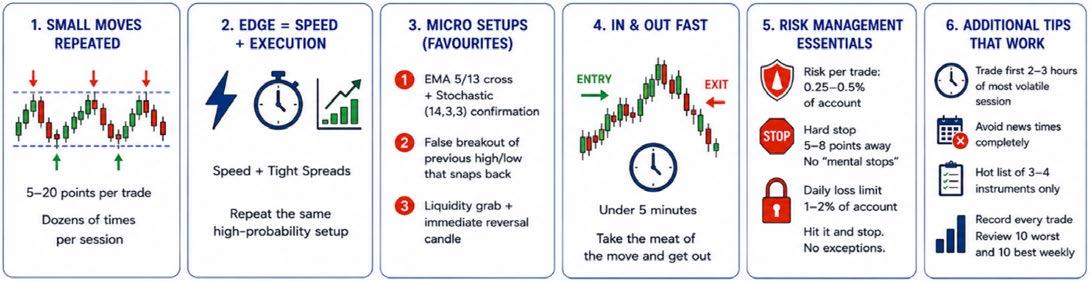
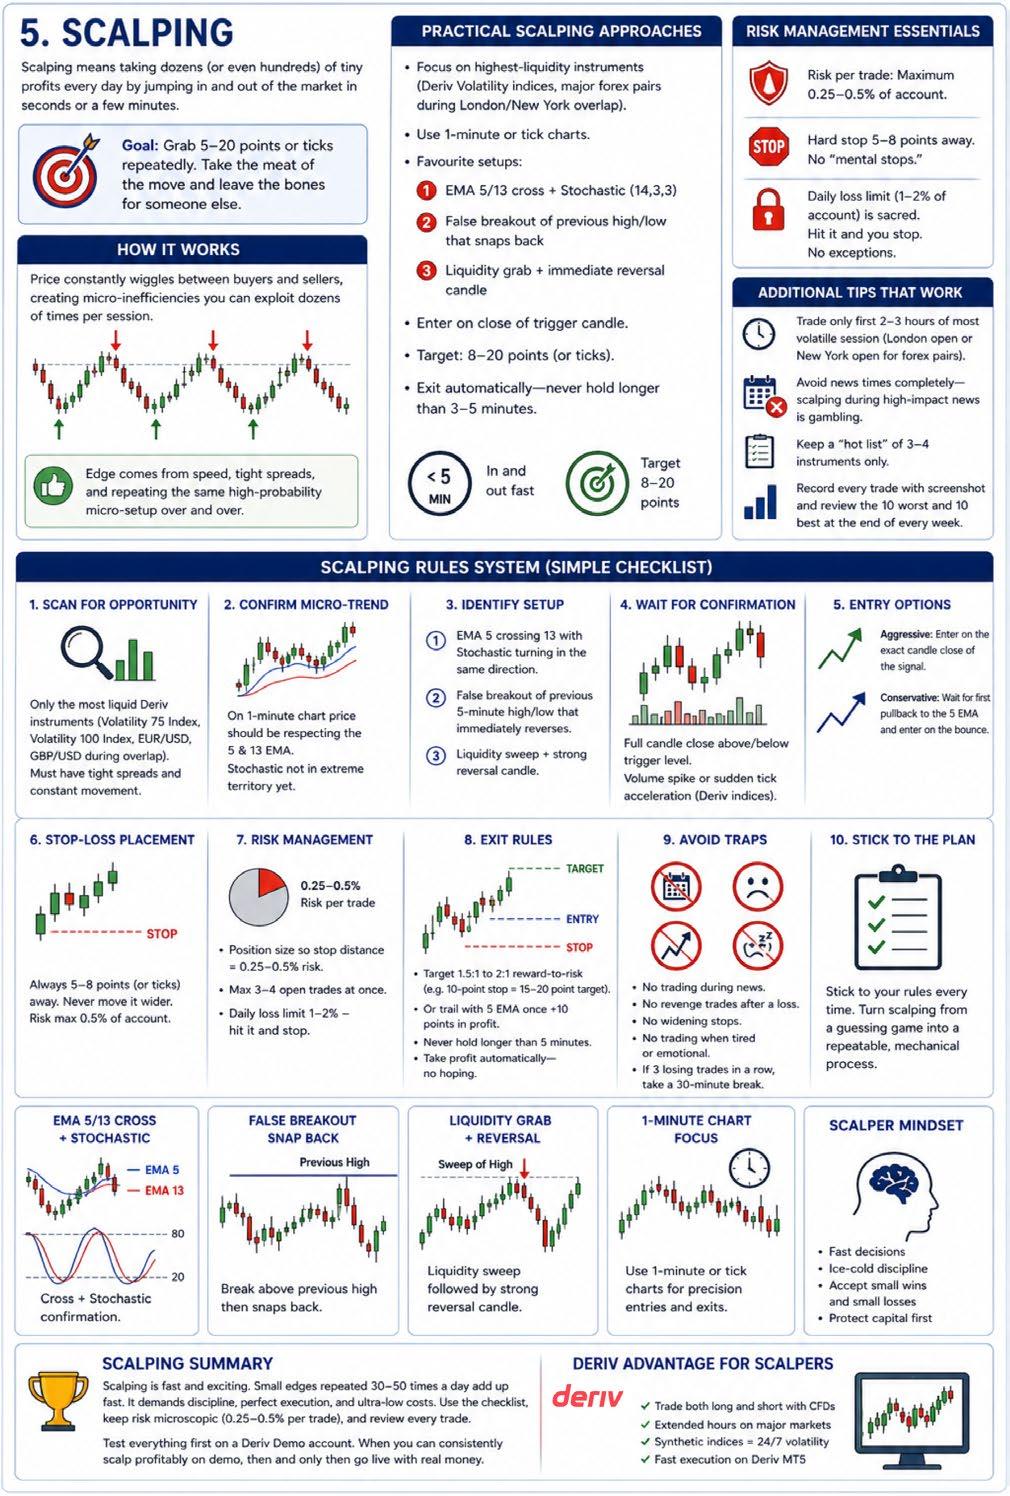
Scalping means taking dozens, or even hundreds, of tiny profits a day by jumping in and out of the market in seconds or a few minutes at a time. You are not trying to catch the big move — you are simply grabbing 5–20 ticks or points, repeatedly.
In the short term, price is never perfectly flat. It wiggles constantly between buyers and sellers, creating micro-inefficiencies you can exploit dozens of times per session. Think of it as catching lots of small fish quickly, rather than landing one big one.
How this applies to markets
Every second, the market is alive with noise — news ticks, order flow, retail stops being hunted, algorithms rebalancing. A scalper doesn’t care about the bigger picture. They only care whether the next 8–15 points are likely to go in their direction right now. The edge comes from speed, tight spreads, and repeating the same high-probability micro-setup over and over.
Traders often say: “Take the meat of the move and leave the bones for someone else.” Scalpers want the quick, clean slice in the middle and get out before the reversal.
Reality check: Most retail traders lose money scalping because they over-trade, chase, or let one loss wipe out ten small wins. It looks easy on a 1-minute chart but demands ice-cold discipline, lightning-fast execution, and rock-bottom transaction costs.
On Deriv’s synthetic indices (Volatility 75, Boom/Crash, etc.) the constant volatility makes it possible; on forex pairs you need a broker with razor-thin spreads and a responsive platform such as Deriv MT5.
Practical scalping approaches
Focus on the highest-liquidity instruments only (Deriv Volatility indices, major forex pairs during London/New York overlap).
Use 1-minute or even tick charts.
Favourite setups:
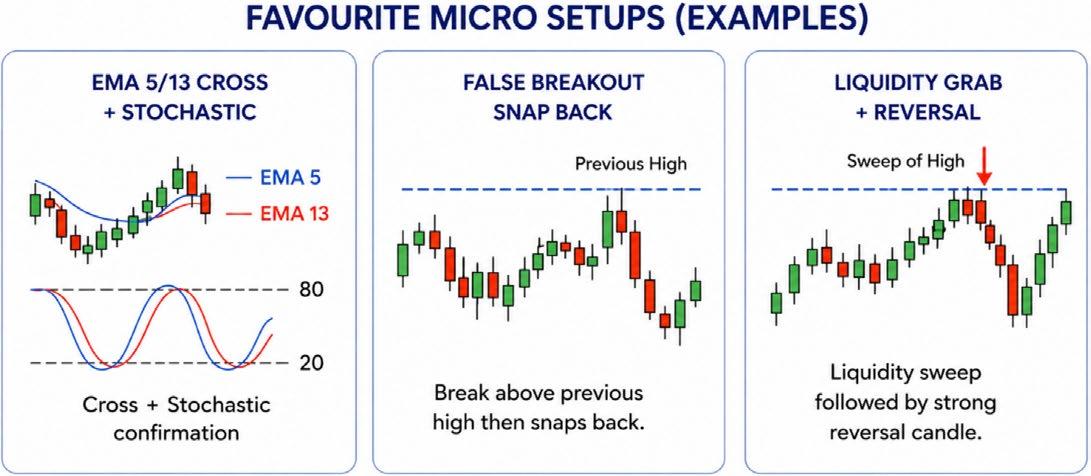
• EMA 5/13 cross with Stochastic (14,3,3) confirmation
• Order-flow “trapped traders” (false break of previous high/low that snaps back)
• Liquidity grab + immediate reversal candle
Enter on the close of the trigger candle. Target is usually 8–20 points (or ticks). Exit is automatic—never hold longer than 3–5 minutes max.
Risk management essentials
One bad trade can erase twenty small winners, so risk is tiny: maximum 0.25–0.5 % of account per trade.
Use a hard stop 5–8 points away—no “mental stops.”
Daily loss limit (1–2 % of account) is sacred. Hit it and you switch the platform off. No exceptions.
Additional tips that work in practice
Trade only the first 2–3 hours of the most volatile session (London open or New York open for forex pairs).
Avoid news times completely—scalping during high-impact news is gambling.
Keep a “hot list” of 3–4 instruments only. Master them instead of jumping around.
Record every trade with screenshot and review the 10 worst and 10 best at the end of every week.
Scalping rules system (simple checklist)
Use this step-by-step checklist for every single trade to stay objective and disciplined:
• Scan for opportunity — Only the most liquid Deriv instruments (Volatility 75 Index, Volatility 100 Index, EUR/USD, GBP/USD during overlap). Must have tight spreads and constant movement.
• Confirm the micro-trend — On 1-minute chart price should be respecting the 5 & 13 EMA. Stochastic not in extreme territory yet.
• Identify high-probability setup
◦ EMA 5 crossing 13 with Stochastic turning in the same direction, OR
◦ False breakout of previous 5-minute high/low that immediately reverses, OR
◦ Clear liquidity sweep + strong reversal candle.
• Wait for confirmation — Full candle close above/below trigger level. Volume spike or sudden tick acceleration on Deriv synthetic indices.
• Entry options
◦ Aggressive: Enter on the exact candle close of the signal.
◦ Conservative: Wait for first pullback to the 5 EMA and enter on the bounce.
• Stop-loss placement — Always 5–8 points (or ticks) away. Never move it wider. Risk must equal maximum 0.5 % of account.
7
• Risk management — Position size calculated so that stop distance = 0.25–0.5 % risk. Maximum 3–4 open trades at once. Daily loss limit 1–2 %—hit it and stop.
• Exit rules — Target 1.5 : 1 to 2 : 1 reward-to-risk (e.g. 10-point stop = 15–20 point target). Or trail with 5 EMA once +10 points in profit.
• Never hold longer than 5 minutes. Take profit automatically—no hoping.
• Avoid traps — No trading during news, no revenge trades after a loss, no widening stops, no trading when tired or emotional. If you have three losing trades in a row, take a 30-minute break.
• Stick to the plan —it turns scalping from a frantic guessing game into a repeatable, mechanical process.
Summary
Scalping is fast, exciting and can be extremely profitable when done correctly because small edges repeated 30–50 times a day add up fast. It suits traders who love action, have iron discipline, and can sit in front of the screen for focused sessions.
Scalping is not for everyone. The mental intensity, the screen time, and the need for perfect execution can burn people out very quickly.
Master the checklist, keep risk microscopic, and test everything first on a Deriv Demo account. When you can consistently scalp profitably on demo — and only then — should you go live with real money.
Scalping would work very well with automated trading, and it’s worth looking at ways you could use a trading bot such as Deriv DBot or others that can work with Deriv MT5.
7 Effective Trading Strategies
Every Trader Should Know
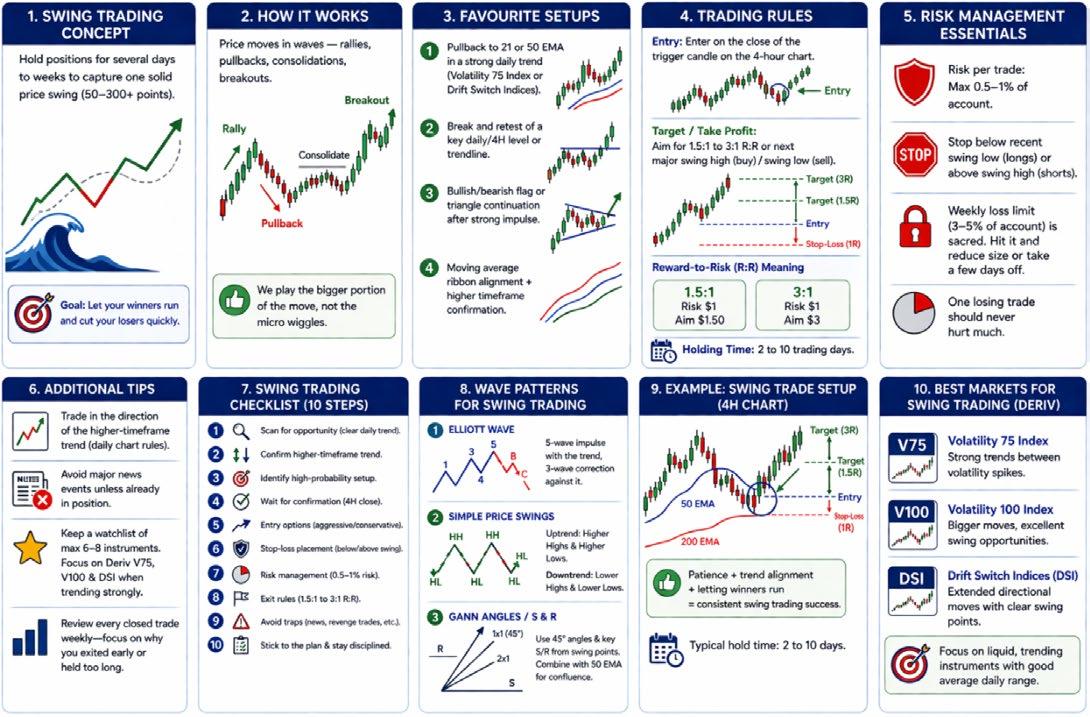
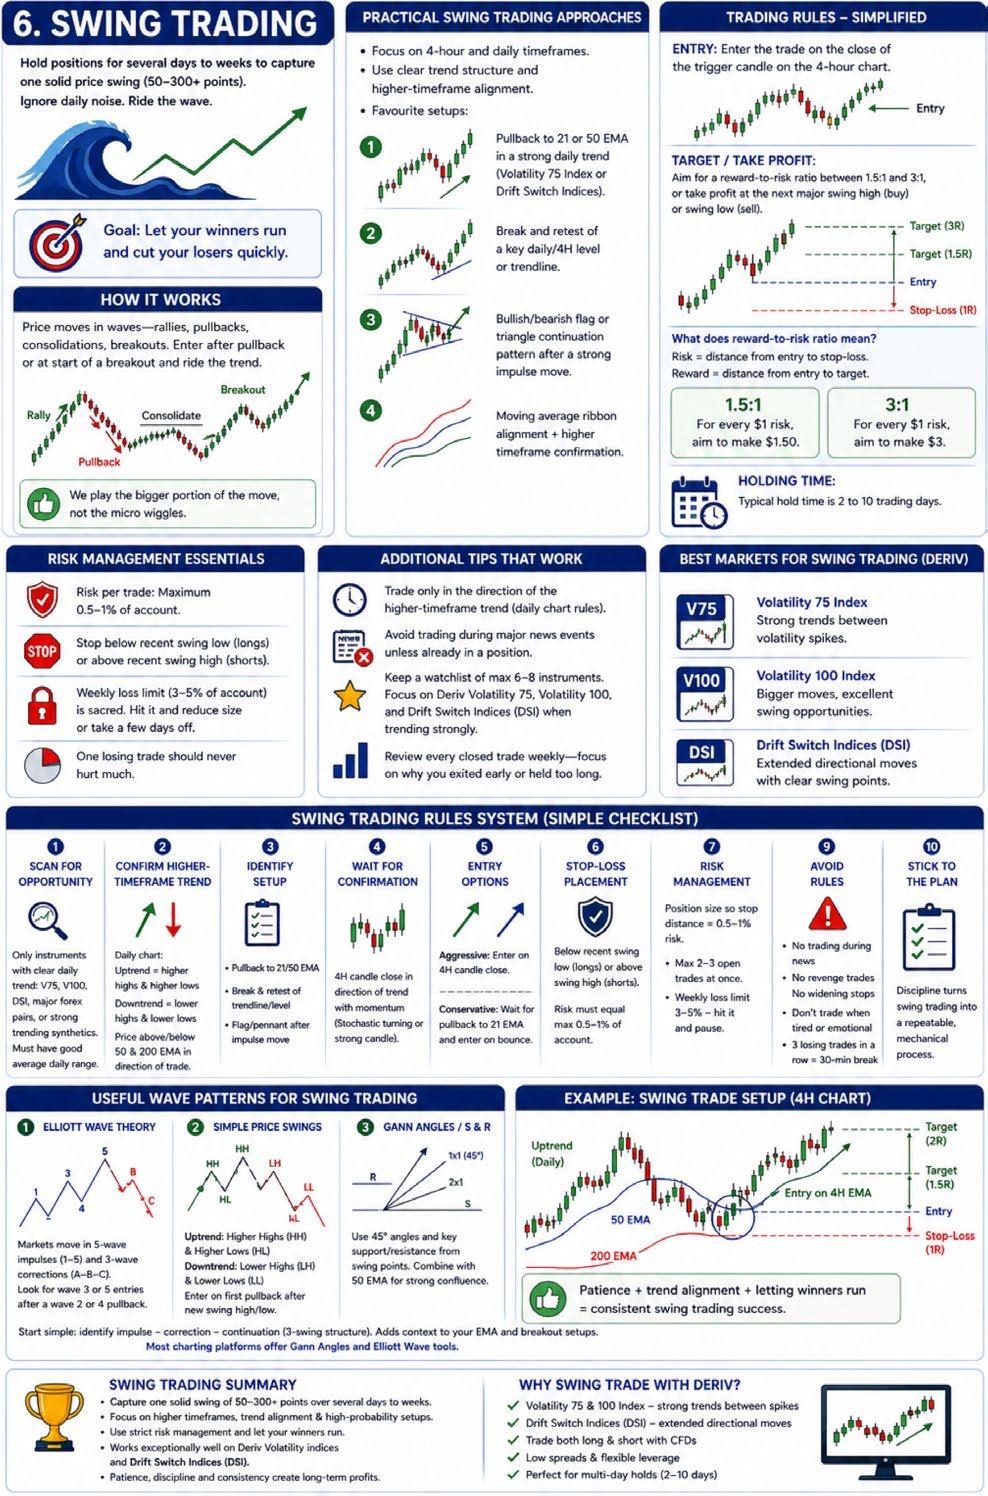
Swing trading means holding positions for several days up to a few weeks to capture one solid price swing. Instead of grabbing dozens of tiny moves, you aim for one meaningful move of 50–300+ points (or pips) per trade while ignoring the daily noise.
In the medium term, markets move in clear waves — trends, pullbacks, and breakouts. A swing trader’s job is to identify the start of a new leg and ride it until the momentum starts to fade. This is the trading equivalent of patiently waiting for the big fish to take the bait and then reeling it in steadily rather than scooping up hundreds of small ones.
How this applies to markets
Price does not go straight up or down. It breathes — it rallies, corrects, consolidates, then rallies again. Swing traders exploit these natural swings by entering after a pullback in an established trend or at the beginning of a fresh breakout. They let winners run and do not panic over small counter-moves during the hold period.
Traders often say: “Let your winners run and cut your losers quickly.” Swing traders live by this rule. They are happy to sit through normal volatility because they are playing for the bigger portion of the move, not the micro wiggles.
Reality check: Most retail traders fail at swing trading because they exit too early out of fear, move their stops too wide out of hope, or ignore the overall trend. It looks relaxed on a daily chart but still demands strong discipline and the ability to watch unrealized profits swing back and forth without closing the trade emotionally.
On Deriv’s synthetic indices, particularly the Volatility 75 Index, Volatility 100 Index, and the Drift Switch Indices (DSI), the strong trending behaviour between volatility spikes makes swing trading very effective. The Drift Switch Indices are especially well-suited for swing trading because they frequently produce extended directional moves with clear swing points, giving traders excellent opportunities to ride trends for several days.
Practical swing trading approaches
Focus on the 4-hour and daily timeframes.
Use clear trend structure and higher-timeframe alignment.
Favourite setups:
• Pullback to the 21 or 50 EMA in a strong daily trend on Volatility 75 Index or Drift Switch Indices
• Break and retest of a key daily/4H level or trendline
• Bullish/bearish flag or triangle continuation pattern after strong impulse move
• Moving average ribbon alignment + higher timeframe confirmation
Trading Rules – Simplified
Entry: Enter the trade on the close of the trigger candle on the 4-hour chart.
Target / Take Profit: Aim for a reward-to-risk ratio between 1.5:1 and 3:1, or
Take profit at the next major swing high (if you are buying) or swing low (if you are selling).
What does reward-to-risk ratio mean?
Risk = distance from your entry price to your stop-loss.
Reward = distance from your entry price to your target.
A 1.5:1 ratio means: For every $1 you risk, you aim to make $1.50 profit.
A 3:1 ratio means: For every $1 you risk, you aim to make $3 profit. In simple terms: You want your potential profit to be 1.5 to 3 times bigger than the amount you are willing to lose on the trade.
Holding Time:
Typical hold time is 2 to 10 trading days.
This works especially well on Deriv Volatility indices and Drift Switch Indices, where trends can stay strong for longer.
Risk management essentials
One losing trade should never hurt much, so risk is still controlled: maximum 0.5–1 % of account per trade.
Use a hard stop below the recent swing low (for longs) or above the recent swing high (for shorts).
Weekly loss limit (3–5 % of account) is sacred. Hit it and you reduce size or take a few days off.
Additional tips that work in practice
Trade only in the direction of the higher-timeframe trend (daily chart rules).
Avoid trading during major news events unless you have already entered before the release.
Keep a watchlist of maximum 6–8 instruments, focusing especially on Deriv Volatility 75, Volatility 100, and Drift Switch Indices (DSI) when they show strong trending behaviour.
Review every closed trade weekly— focus especially on why you exited early or held too long.
Swing trading rules system (simple checklist)
Use this step-by-step checklist for every single trade to stay objective and disciplined:
• Scan for opportunity — Only instruments showing clear trend on the daily chart (Volatility 75 Index, Volatility 100 Index, Drift Switch Indices, major forex pairs, or strong trending synthetics). Must have good average daily range.
• Confirm the higher-timeframe trend — Daily chart must show higher highs & higher lows (uptrend) or lower highs & lower lows (downtrend). Price trading above/below the 50 and 200 EMA in the direction of the trade.
Identify high-probability setup
• Clean pullback to the 21/50 EMA in a trending market on Deriv Volatility indices or Drift Switch Indices, OR
• Break and successful retest of a daily trendline or previous swing level, OR
• Clear continuation pattern (flag, pennant) after a strong impulse move. Wait for confirmation — 4-hour candle close in the direction of the trend with increasing momentum (e.g., Stochastic turning or strong bullish/bearish candle).
Entry options
Aggressive: Enter on the 4H (4 hour) candle close of the signal.
Conservative: Wait for a small retracement to the 21 EMA and enter on the bounce. Stop-loss placement — Place stop below the most recent swing low (longs) or above swing high (shorts). Risk must equal maximum 0.5–1 % of account.
Risk management — Position size calculated so stop distance = 0.5–1 % risk. Maximum 2–3 open trades at once. Weekly loss limit 3–5 % — hit it and pause.
Exit rules — Target 1.5 : 1 to 3 : 1 reward-to-risk, or exit at the next major daily resistance/support level.
Or trail stop using the 50 EMA or previous swing lows once the trade is +1R in profit.
Useful wave patterns for swing trading
You can improve your swing trading edge by learning a few simple wave concepts. Keep it basic at first:
• Elliott Wave Theory – Markets move in 5-wave impulses in the direction of the trend and 3-wave corrections against it. Look for wave 3 (strongest) or wave 5 entries after a wave 2 or 4 pullback on Deriv Volatility 75 Index or Drift Switch Indices.
• Simple Price Swings – Mark higher highs/higher lows in uptrends and lower highs/lower lows in downtrends. Enter on the first pullback after a new swing high/low is confirmed.
• Gann Angles / Support & Resistance – Use 45-degree trend lines or major horizontal levels from previous swing points. Many traders combine these with the 50 EMA for confluence on Volatility indices and DSI.
Start with just identifying clear 3-swing structures (impulse –correction – continuation). This adds context to your EMA and breakout setups without overcomplicating things.
Most charting packages will offer Gann Angles and Elliot wave tools.
Summary
Swing trading offers a more balanced, less stressful approach than scalping. By focusing on Deriv’s Volatility Indices, Drift Switch Indices (DSI), and major forex pairs on higher timeframes, you can capture larger, cleaner moves while spending far less time in front of the screen. Success comes from patience, strict trend alignment, and letting your winners run.
Master the daily and 4-hour charts, respect your risk rules, and swing trading can deliver consistent, high-quality returns with much lower emotional pressure than fast scalping.
7 Effective Trading Strategies Every Trader Should Know
& position trading
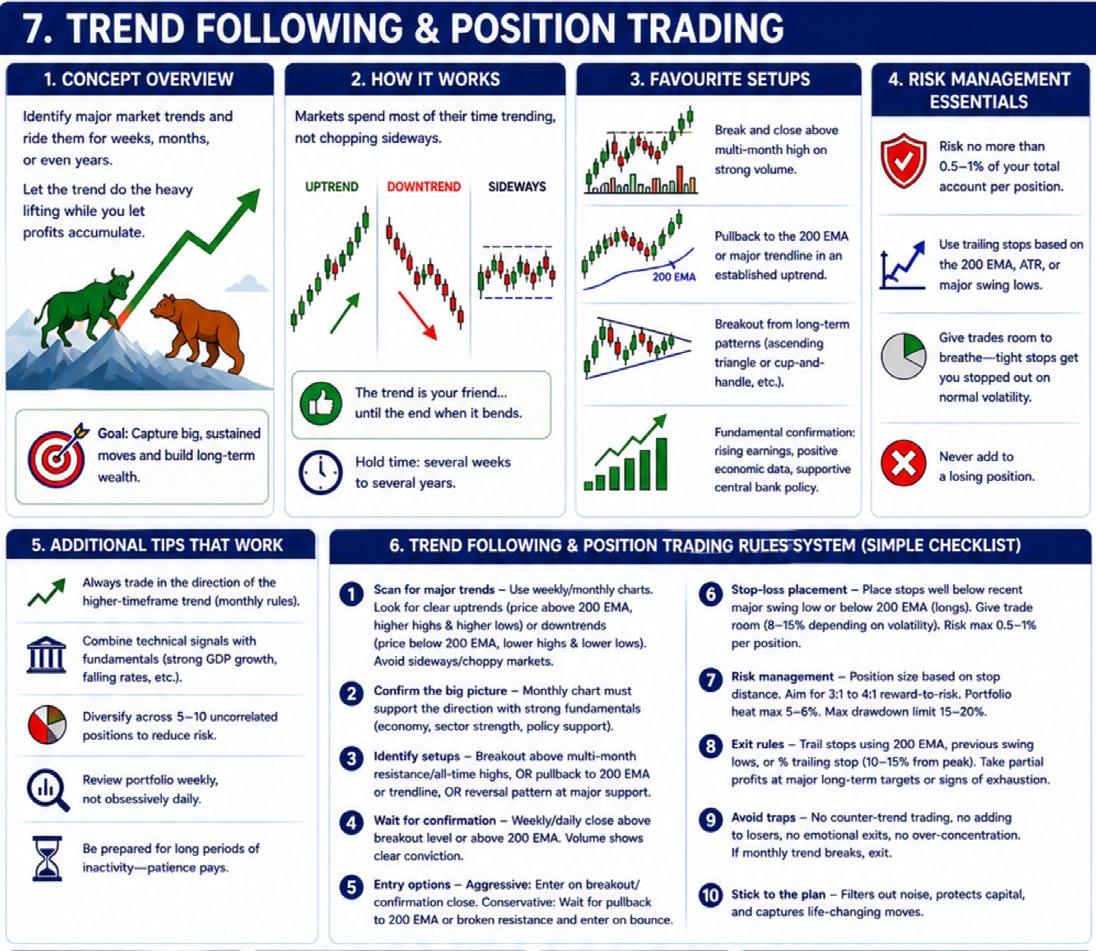
Trend following and position trading mean identifying the major upward or downward moves in a market and riding them for weeks, months, or even years. Instead of fighting the direction, you get on board and stay with the trend for as long as it remains healthy.
This is one of my personal favourites, and a style I’ve been using profitably for well over 35 years. Trend following can profit from both long (up) and short (down) trends, while position trading tends to focus on holding substantial long positions based on major market trends and underlying fundamentals.
How this applies to markets
Markets spend most of their time trending, not chopping sideways. Once a strong trend begins—driven by economic growth, interest rate cycles, commodity supercycles, or major shifts in sentiment—it can last far longer than most traders expect. Position traders and trend followers simply let the market do the heavy lifting while they sit back and let profits accumulate.
Traders often say: “The trend is your friend… until the end when it bends.” The real money in trading is made by capturing the big, sustained moves rather than the small daily noise.
History shows the power of this approach: some of the greatest fortunes in trading were built by simply riding multi-year trends in stocks, commodities, or currencies. The key is having the patience and discipline to stay with the trend even when it looks like it’s about to end.
Reality check: Most retail traders fail at trend following and position trading because they get shaken out during normal pullbacks, enter too late after the trend is obvious, or hold losing positions hoping for a reversal. It looks easy on a monthly chart, but it demands strong emotional control and the willingness to sit through drawdowns of 20–40% while the trend temporarily pauses or corrects.
Practical trend following & position trading approaches
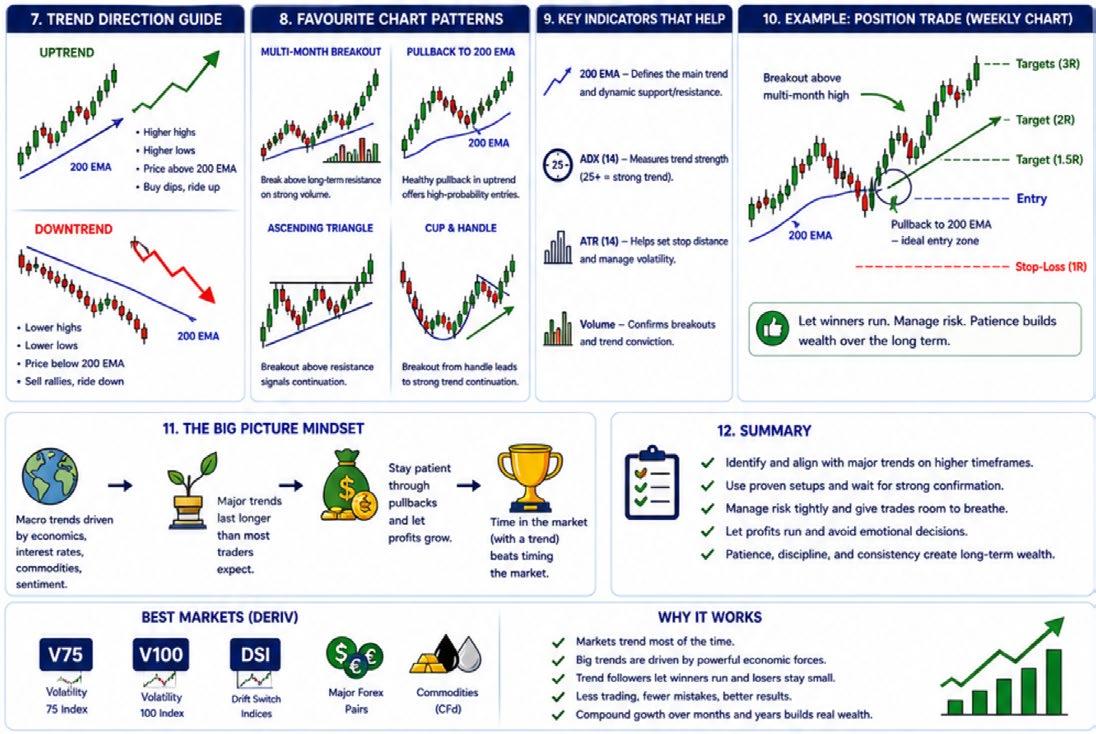
Use higher timeframes: weekly and monthly charts for the big picture, daily charts for precise entry and risk management. Favourite setups include:
• Price breaking and closing above a multi-month high on strong volume (for longs)
• Pullbacks to the 200-period moving average or a major trendline in an established uptrend
• Breakouts from long-term chart patterns such as ascending triangles or cup-and-handle formations
• Fundamental confirmation: rising earnings, positive economic data, or supportive central bank policy. Enter on weekly or daily confirmation. Typical hold time ranges from several weeks to several years. You will usually run multiple positions at the same time across different assets or sectors.
Risk management essentials
Risk no more than 0.5–1% of your total account per position. Because hold times are long, you must give trades enough room to breathe— tight stops will get you stopped out on normal volatility.
Use trailing stops based on the 200-period moving average, ATR, or previous major swing lows to protect profits as the trend matures. Never add to a losing position.
Additional tips that work in practice
Always trade in the direction of the higher-timeframe trend—never fight the monthly chart.
Combine technical trend signals with basic fundamentals (for example, strong GDP growth or falling interest rates for long stock indices).
Diversify across 5–10 uncorrelated positions to reduce risk.
Review your entire portfolio once a week, but avoid checking it obsessively every day.
Be prepared for long periods of inactivity—trend following rewards patience, not constant action.
Trend following & position trading rules system (simple checklist)
Use this step-by-step checklist for every setup to stay objective and disciplined:
• Scan for major trends — Focus on weekly and monthly charts. Look for assets in clear, sustained uptrends (price well above the 200 EMA and making higher highs/higher lows) or downtrends (price below the 200 EMA with lower highs/lower lows). Ignore sideways or choppy markets.
• Confirm the big picture — The monthly chart must support the direction. Look for fundamental tailwinds (strong economy, sector strength, or policy support) that can sustain the move for months or years.
• Identify setups
◦ Breakout above multi-month resistance or all-time highs on expanding volume, OR
◦ Healthy pullback to the 200-period EMA or rising trendline in an established uptrend, OR
◦ Reversal pattern (such as double bottom or bullish engulfing) at major long-term support. Wait for confirmation — Weekly or daily candle close above the breakout level or above the 200 EMA. Volume should show clear conviction on the move.
• Entry options
Aggressive: Enter on the breakout or confirmation candle close.
Conservative: Wait for a pullback to the 200 EMA or broken resistance (now support) and enter on the bounce with confirmation.
Stop-loss placement
Place stops well below the most recent major swing low or below the 200 EMA (for longs). Give the trade enough room—typically 8–15% depending on the asset’s volatility. Risk must not exceed 0.5–1% of your total account per position.
Risk management — Position size calculated strictly from stop distance. Aim for minimum 3:1 or 4:1 reward-to-risk on every trade. Portfolio heat (total risk across all open positions) should never exceed 5–6%. Set a maximum portfolio drawdown limit (e.g., 15–20%) and reduce exposure if hit.
Exit rules — Let winners run: Trail stops using the 200 EMA, previous major swing lows, or a percentage trailing stop (e.g., 10–15% from peak).
Take partial profits only at major long-term targets or when the trend shows clear signs of exhaustion (price closing below the 200 EMA on
weekly chart, massive divergence, or fundamental deterioration).
Never exit a strong trend just because it “feels” extended. Avoid traps — No counter-trend trading, no adding to losers, no emotional exits during normal corrections, no over-concentration in one asset or sector. If the monthly trend breaks, exit without hesitation. Avoid forcing trades during sideways markets—cash is a position.
Stick to the plan —it filters out noise, protects your capital during corrections, and allows you to capture the truly life-changing moves when big trends develop.
Summary
Trend following combined with position trading is a powerful, timetested approach that has created enormous wealth for patient traders over decades. By aligning yourself with the market’s major directional moves and letting profits run, you can achieve substantial long-term gains with relatively low daily screen time.
This style suits disciplined, patient traders who are comfortable holding through volatility and drawdowns in exchange for much larger rewards. It is not for those who crave constant action or need quick results.
Master the checklist, respect the higher-timeframe trend, and control your risk tightly. Test the approach thoroughly on a Deriv Demo account first, then move on to real trading.
Effective Trading Strategies
Every Trader Should Know
Useful websites and resources
Here are some helpful websites to support your trading journey. Most offer free tools, with optional paid upgrades for more features, but in most cases the free tools work well enough.
Charting and market analysis
TradingView.com — Powerful interactive charts with tons of technical indicators, drawing tools, and community ideas. Great for beginners and experienced traders alike.
www.barchart.com — Excellent for stock quotes, technical analysis, futures, and market data. Easy-to-use charts and scanners.
www.finviz.com — Fast stock screener with heatmaps, charts, and financial visualizations. Perfect for quickly finding trading opportunities.
mt5.com — Official website for MetaTrader 5 (MT5), the popular free trading platform. Download the desktop, web, or mobile version here and access advanced charting, indicators, and automated trading tools.
StockCharts.com — Clean, advanced charting tools focused on technical analysis. Includes educational resources and reliable indicators.
Screeners and data tools
Yahoo Finance (finance.yahoo.com) — Free stock quotes, news, financial statements, and basic charts. A simple all-in-one starting point.
Investing.com — Real-time quotes, economic calendars, news, and charts for stocks, forex, and more.
Education and learning
Deriv Academy (traders-academy.deriv.com) — Free trading courses and lessons, especially useful for forex and derivatives.
BabyPips.com — Fun, easy-to-follow free school for learning forex and trading basics (highly recommended for complete beginners).
Investopedia.com — Clear explanations of trading terms, strategies, and concepts. Great glossary and tutorials.
News and additional tools
Forex Factory (forexfactory.com) — Popular economic calendar, news, and forum for traders.
Simply Wall St (simplywall.st) — Visual portfolio tracker and stock insights with easy-to-understand graphics.
X accounts to follow
X, formerly Twitter, remains an excellent source for trading updates and data.
@Vince_Stanzione (41+ years trading experience, spreads, derivatives, commodities, short-selling insights).
@Barchart – Real-time market data, charts, news, and tools across stocks, options, futures, commodities, and forex. Perfect pulse on the markets.
Top technical/chart-focused traders
@PeterLBrandt – Classic chart trader (since 1975), Market Wizard, transparent with wins/losses. Excellent classical charting, price-action ideas, and long-term setups on futures and commodities.
@KimbleCharting – Chris Kimble’s technical analysis. Focuses on chart patterns for reversals and breakouts—very visual “chart art” style that highlights extremes.
@ChartGuys – Live technical analysis, chart patterns, and 24/7 market coverage (stocks + crypto). Great for real-time pattern breakdowns and community discussion.
Momentum, day/swing trading, and recaps
@ripster47 – Daily trade recaps, momentum ideas, and his own Ripster Cloud System charts. Very transparent with setups and market flow.
@InvestorsLive (Nathan Michaud) – Real-time day and swing trading: entries, exits, and reasoning behind each move. One of the better accounts for watching actual trade execution.
@LindaRaschke – Veteran pro trader (featured in New Market Wizards). Short-term technical setups and market commentary from a lifelong student of the markets.
Final thoughts
Trading is a journey, not a sprint. The seven strategies in this ebook — from breakout and day trading to momentum, news, scalping, swing, and trend/position trading — give you a complete toolkit to suit any style, time frame, or personality.
The real secret to success isn’t trying to master them all at once. It’s picking one or two that feel right for you, practising them relentlessly on a demo account, and sticking to iron-clad risk management and discipline.
Markets will always test your emotions, but with patience, continuous learning, and the right tools, they can also reward you handsomely over time — just as they have for me over more than 40 years.
Deriv makes that journey easier and more accessible than ever. Intuitive platforms, synthetic indices with constant volatility, low minimum deposits starting at just $5, and a completely free demo account let you test every idea in this ebook without risking a single cent.
Pair that with Deriv Academy’s free courses, and you have everything you need to move from theory to confident, profitable trading at your own pace.
I hope this ebook has given you clarity, inspiration, and practical ideas you can put to work immediately.
Trade smart, stay disciplined, keep learning — and above all, enjoy the process. Here’s to your trading success!
Vince Stanzione
Glossary of trading terms (A–Z)
ATR (Average True Range)
A technical indicator that measures market volatility by showing how much an asset typically moves in a given period. Used to set realistic stop-loss distances and trailing stops.
Ascending Triangle
A bullish continuation pattern where price makes higher lows but meets resistance at roughly the same level, often leading to an upside breakout.
Boom/Crash Indices
Deriv’s synthetic indices that simulate sudden sharp price spikes (Boom) or drops (Crash), popular for scalping and short-term trading.
Breakout
When the price moves decisively above a resistance level or below a support level, often with increased volume. Traders expect the move to continue in that direction.
Bull Flag
A short-term consolidation pattern that looks like a flag on a pole after a strong upward move. Often signals continuation of the uptrend.
Candlestick/Candle Close
A visual representation of price action over a specific time period. Traders often wait for a full candle to close before entering to avoid false signals.
CFD (Contract for Difference)
A derivative product that lets you trade on price movements without owning the underlying asset. Offered by Deriv with leverage.
Consolidation/Sideways Range
A period when price moves within clear upper (resistance) and lower (support) boundaries without a strong directional trend.
Cup and Handle
A bullish chart pattern that resembles a teacup. The “cup” is a rounded bottom followed by a smaller “handle” consolidation, typically leading to a breakout higher.
Day trading
Buying and selling the same asset within one trading session (no overnight positions).
Divergence
When price moves in one direction but an indicator (e.g., RSI or Stochastic) moves in the opposite direction. Often signals weakening momentum and a possible reversal.
Drift Switch Indices (DSI)
Deriv’s synthetic indices designed with strong trending behaviour and clear swing points, excellent for swing and trend trading.
Drawdown
The decline in account balance from its peak to its lowest point. A key risk metric.
Economic Calendar
A schedule of upcoming economic data releases, central bank decisions, and earnings reports.
EMA
(Exponential Moving Average)
A moving average that gives more weight to recent prices (e.g., 5, 13, 21, 50, 200 periods).
Elliott Wave Theory
A method of analysing market cycles by identifying repetitive 5-wave impulse and 3-wave correction patterns.
Fakeout/False Breakout
When price briefly breaks a level but quickly reverses, trapping early traders.
FOMO (Fear Of Missing Out)
The emotional urge to jump into a fast-moving market, often leading to poor entries.
Gann Angles
Trend lines drawn at specific angles (especially 45 degrees) used to identify support, resistance, and trend changes.
Leverage
Borrowed capital from the broker that magnifies both potential profit and risk.
Liquidity
How easily an asset can be bought or sold without affecting its price. High liquidity = tight spreads.
Momentum
The speed and strength of a price move. Strong momentum with volume often continues.