
Santa Barbara Area Market Report
SANTA BARBARA AREA REAL ESTATE THROUGH MARCH 2026
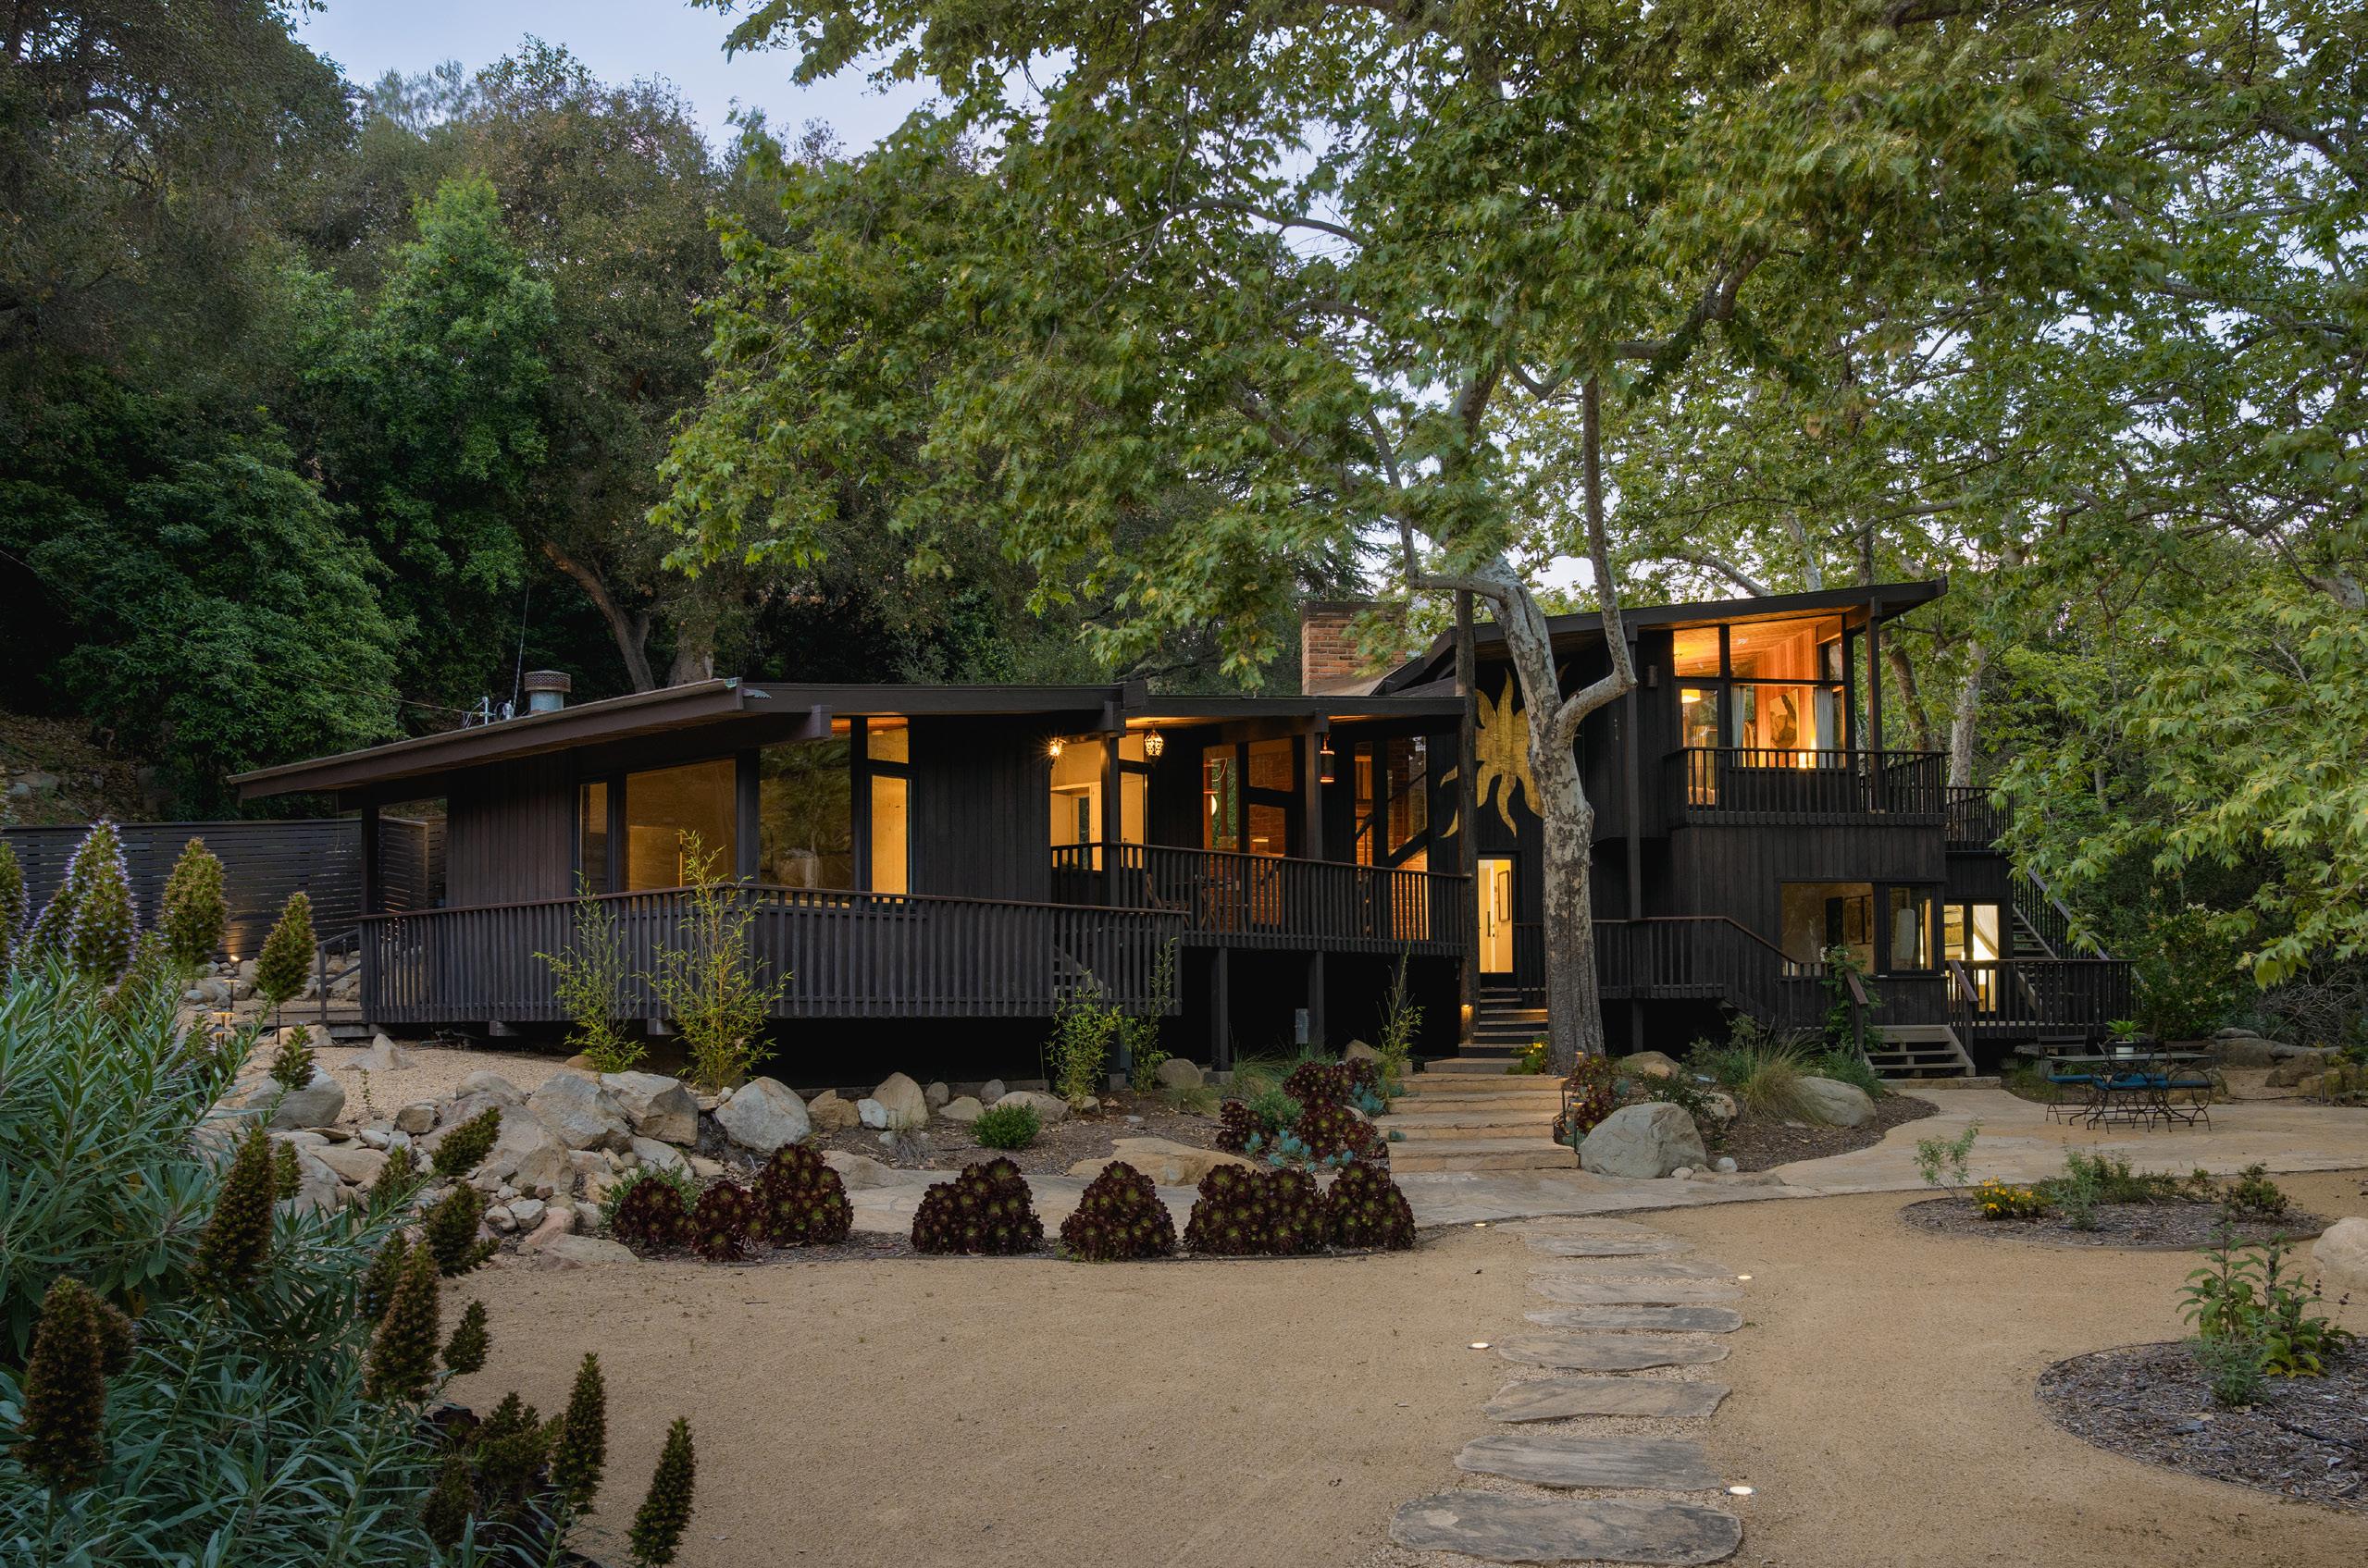
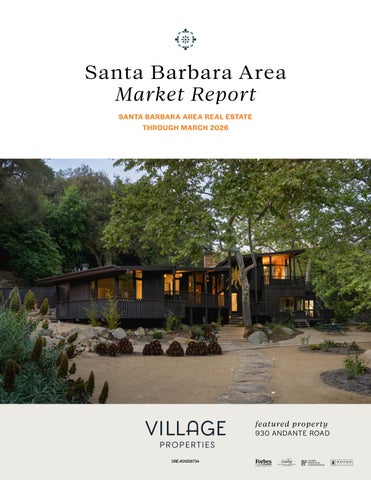
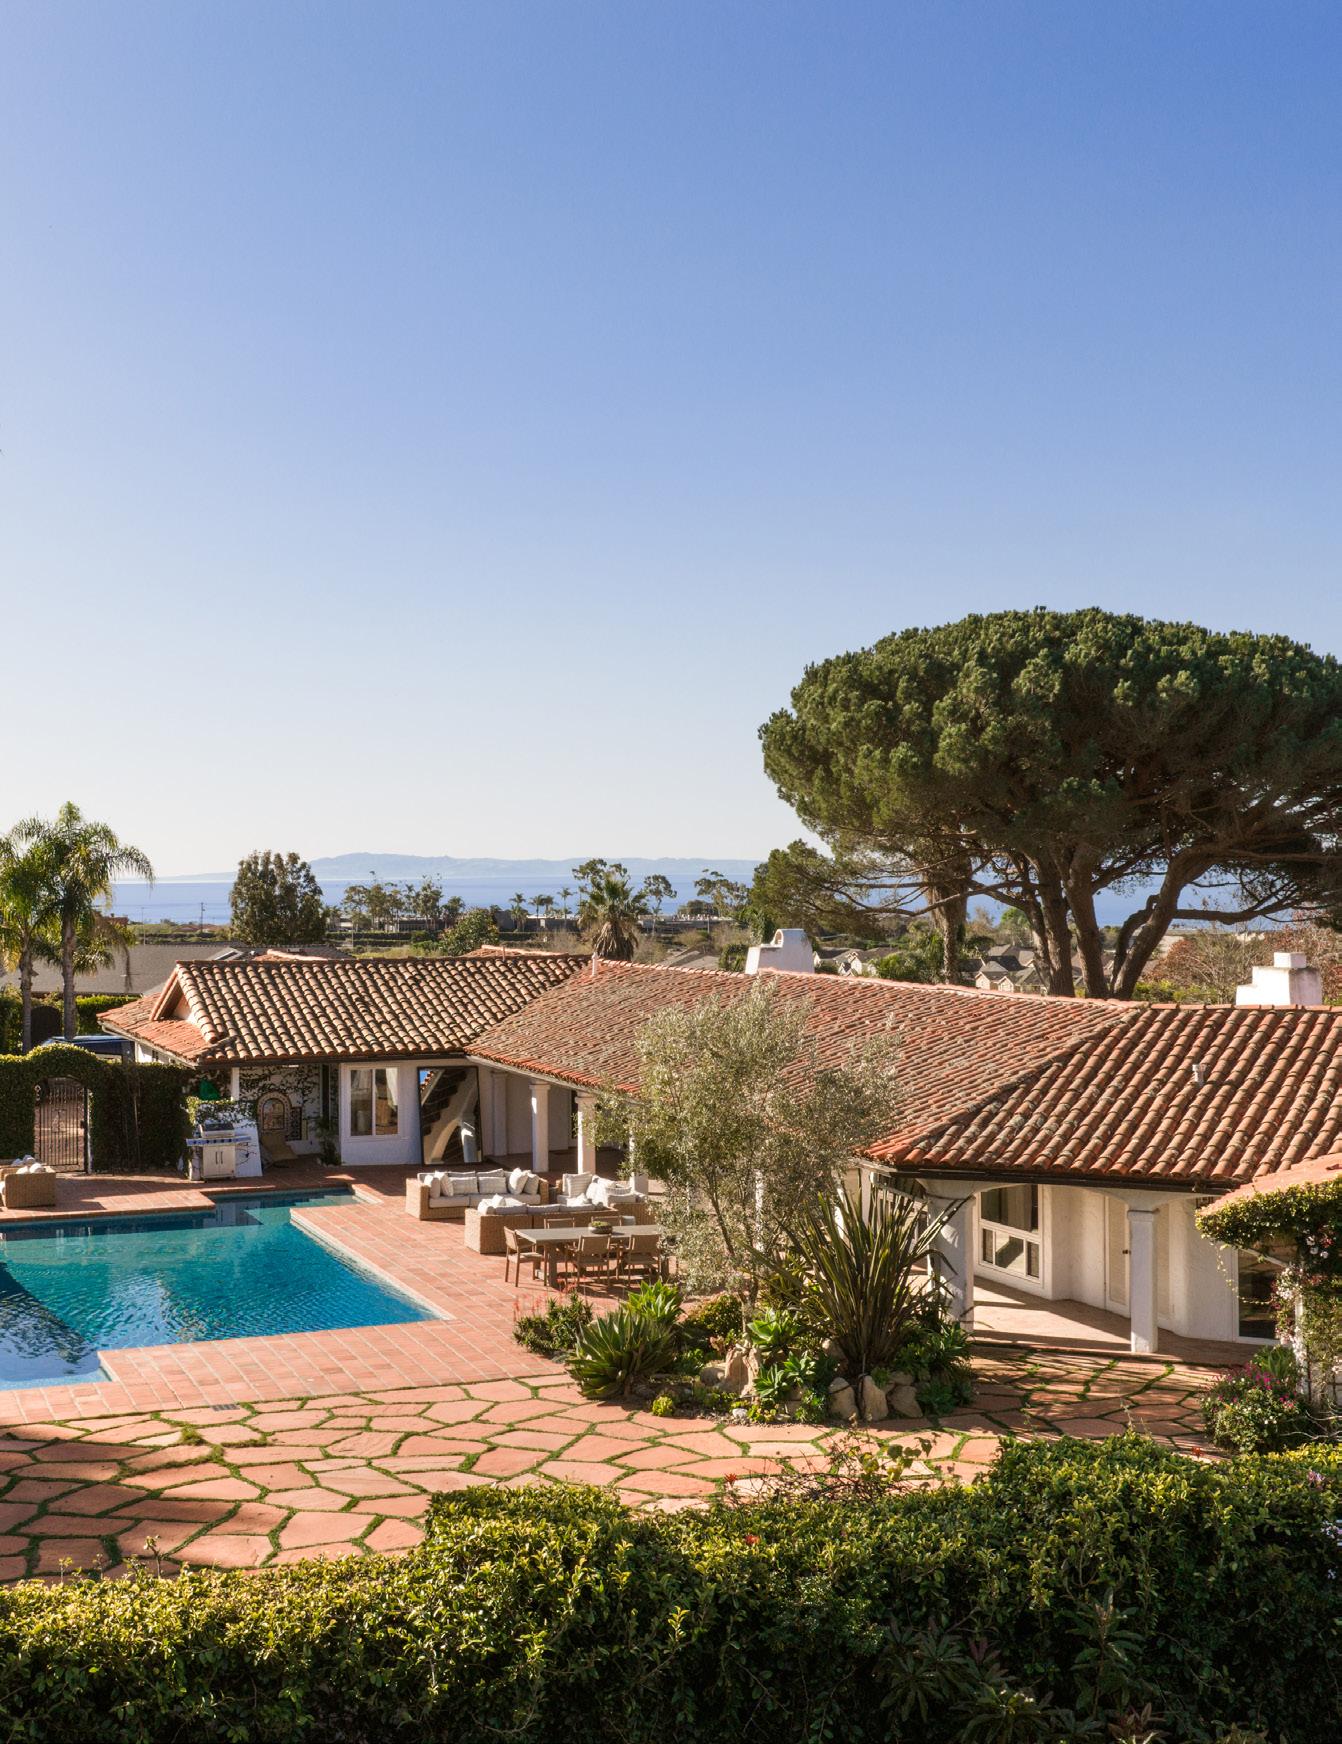
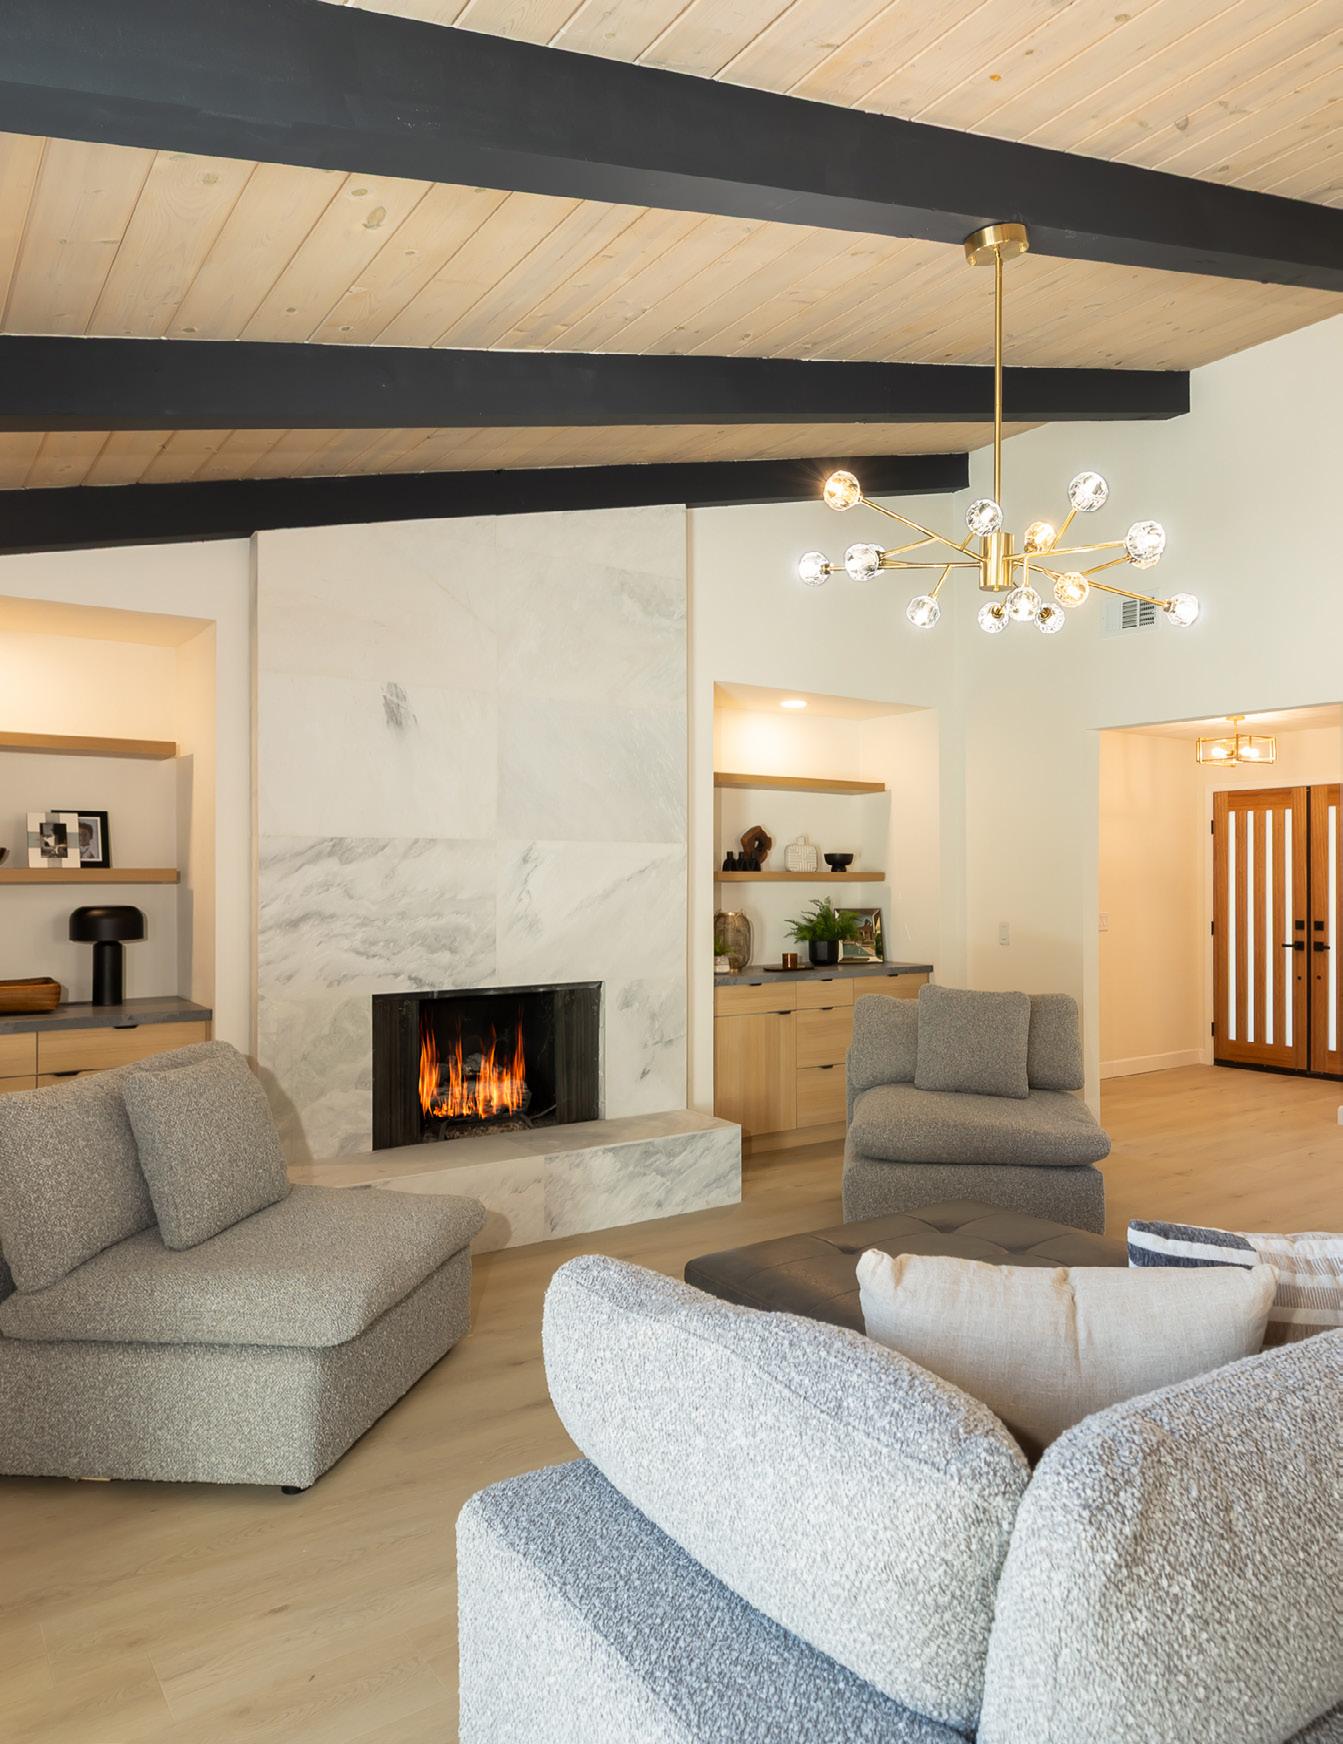
featured property 930 ANDANTE ROAD

(+5% change from 2025)
Review in Numbers
SOUTH SANTA BARBARA COUNTY
MARCH 2026 YTD
SINGLE FAMILY RESIDENCE SALES
(+4% change from 2025)
CONDOMINIUM SALES
(+9% change from 2025)
Greetings, and thank you for reading our First Quarter 2026 Market Report.
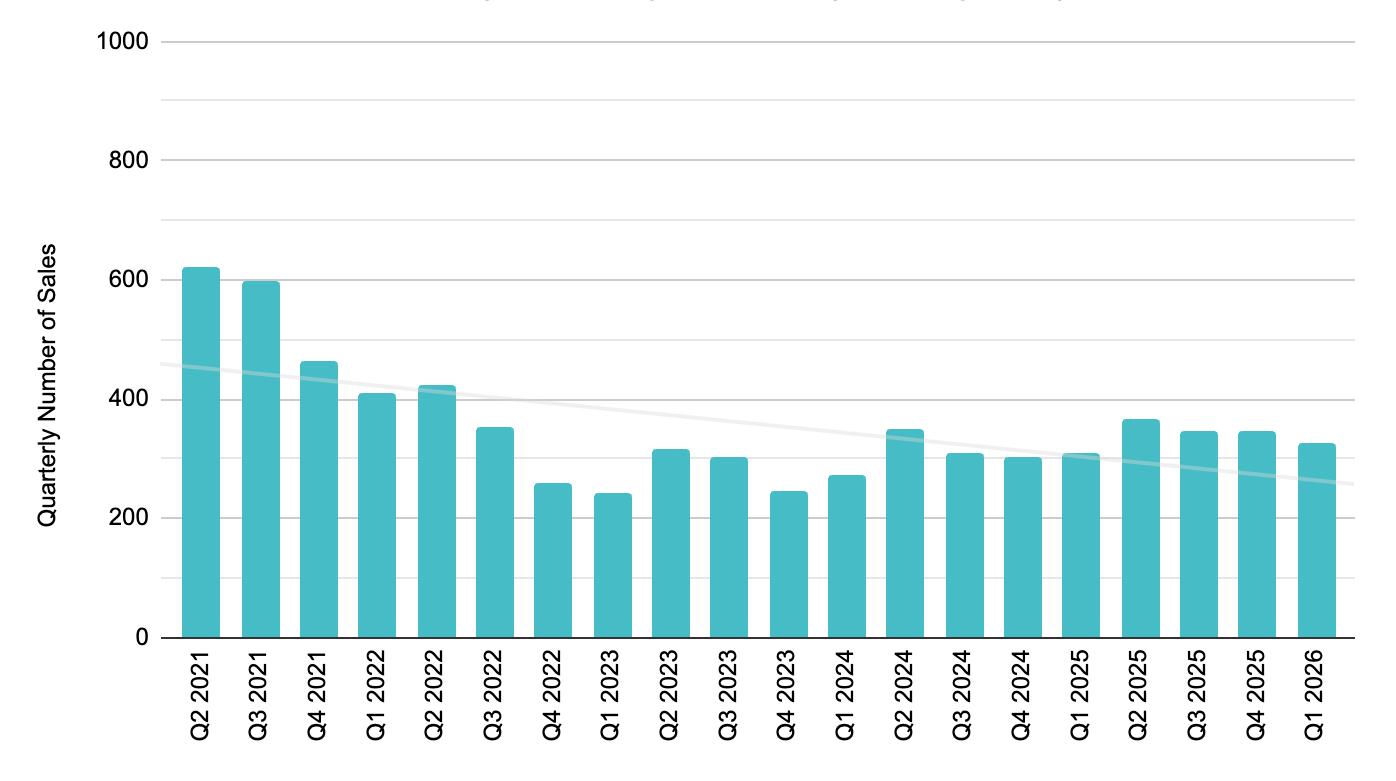
As we step into 2026, South Santa Barbara County is experiencing a fascinating shift in neighborhood dynamics. Q1 saw 327 closed sales—a 5% year-over-year increase—marked by evolving market share between submarkets and a healthy pricing reset.
The most compelling narrative is where activity is happening. Santa Barbara proper surged to capture 50% of all South County sales—its highest level since mid-2018—while Goleta expanded to 28%. Conversely, Montecito’s market share dropped by half compared to Q1 2025.
This pivot toward our historically more accessible submarkets is driven by a confluence of realities: mid-tier buyers are finally accepting the “new normal” of interest rates, while ultra-luxury buyers are adopting a wait-and-see approach amid macro uncertainty from the onset of the Iran war and the ongoing localized insurance squeeze. Consequently, our overall Median Price adjusted to $1.8MM (an 11% YoY decline). We view this “reset” as a positive transition away from unsustainable, double-digit hikes, keeping pricing rangebound between $1.8MM and $2MM since Q2 2024.
However, inventory remains tight. While 2025 marched steadily toward balanced supply, Q1 2026 showed a slight reversal. Months of Supply (MoS) ticked down to 2.93 by March, pausing our journey toward the 4-to-6 months required for true market equilibrium just as we enter the highly anticipated spring selling season.
We hope this report provides valuable context, but the nuances of each neighborhood are unique. Should you have specific inquiries, please do not hesitate to contact us. The entire Village Properties team is dedicated to providing you with tailored insights and exceptional service.
Best regards, Renee
Grubb
S ingle Family
SOUTH SANTA BARBARA COUNTY
MARCH 2026 YTD
AVERAGE SALES PRICE • YTD
$3,213,068 -23% change from 2025
MEDIAN SALES PRICE • YTD
$2,125,000 -24% change from 2025


SOUTH SANTA BARBARA COUNTY MARCH 2026 YTD
AVERAGE SALES PRICE • YTD
$1,256,653 -15% change from 2025
MEDIAN SALES PRICE • YTD
$1,099,500 -8% change from 2025
SALES & INVENTORY
There were 327 closed sales in the First Quarter, an increase of 5% from one year ago, but down 5% from Q4. On a seasonal basis over the past five years, sales have decreased by 2% on average from Q4 to Q1, so this year we experienced a slightly deeper decline than we’ve typically seen recently. However, from Q4 2023 to Q1 2024, and Q4 2024 to Q1 2025, sales actually increased by 11% and 3%, respectively.
Whereas last quarter, the distribution of sales remained relatively unchanged, there were notable changes in the percentage of sales by submarket that undoubtedly affected the overall pricing metrics. Most notably, whereas Santa Barbara proper represented 41% of sales in Q1 2025, they were 50% in Q1 2026. This is Santa Barbara’s highest market share within the South County since Q2 2018. Montecito market share declined substantially from one year ago; from 22% of total sales to 11% this quarter. Finally, whereas Goleta represented 23% of sales one year ago, it represented 28% this quarter.
While Inventory and Months of Supply (MoS) took steps toward supply/demand equilibrium over the past few years, we started to see this rebalancing level off in Q1. As a reminder, we started 2025 at 2.6 MoS, and at times during last Spring, Summer, and Fall, almost hit four months. In line with past years, there was a pullback in new listings at the end of the year, and we ended December with 2.6 Months. Typically four to six MoS equals a neutral, balanced market. We started 2026 with just over 3.0 months. However, that level has declined each month, landing at 2.93 in March, meaning the market is moving in the wrong direction if we’re seeking a more balanced market.
Santa Barbara Area real estate market
SOUTH SANTA BARBARA COUNTY · THROUGH MARCH 2026
PRICING
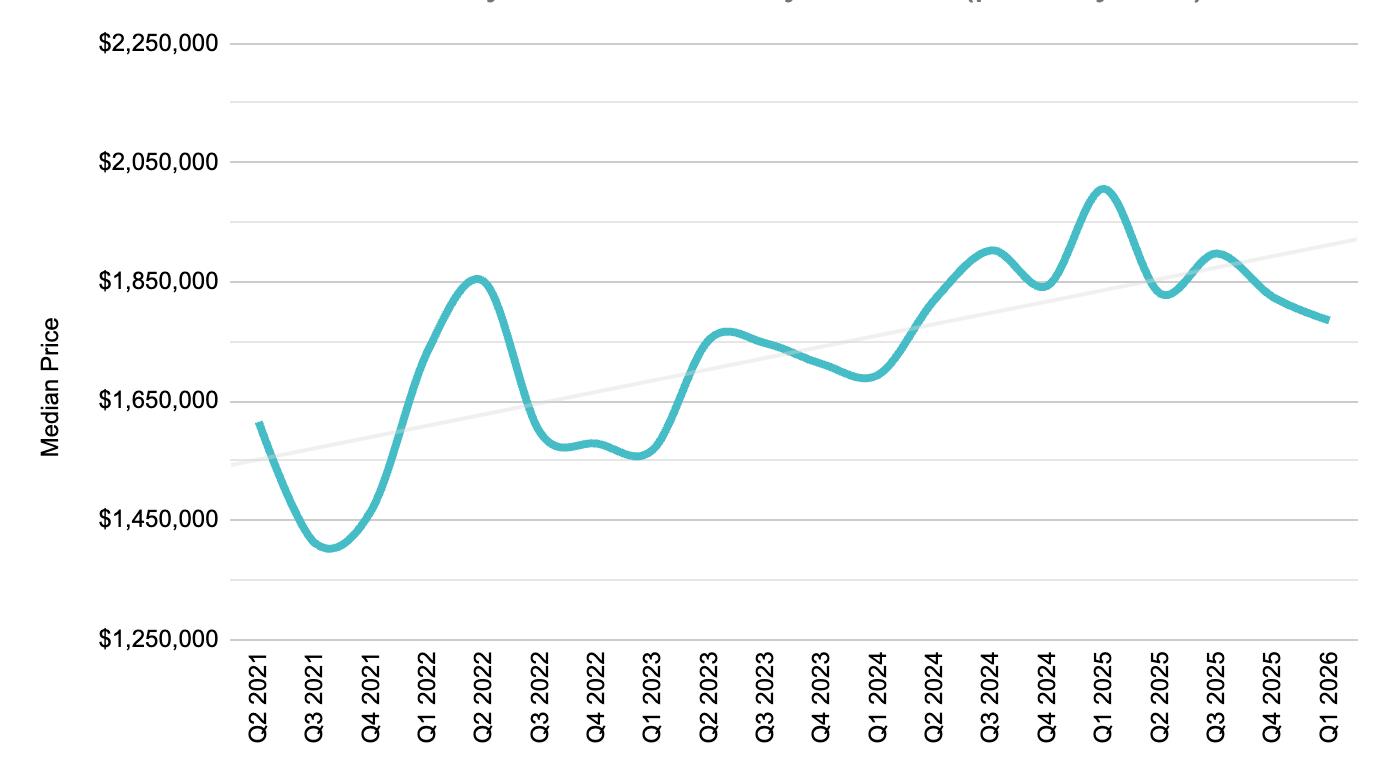
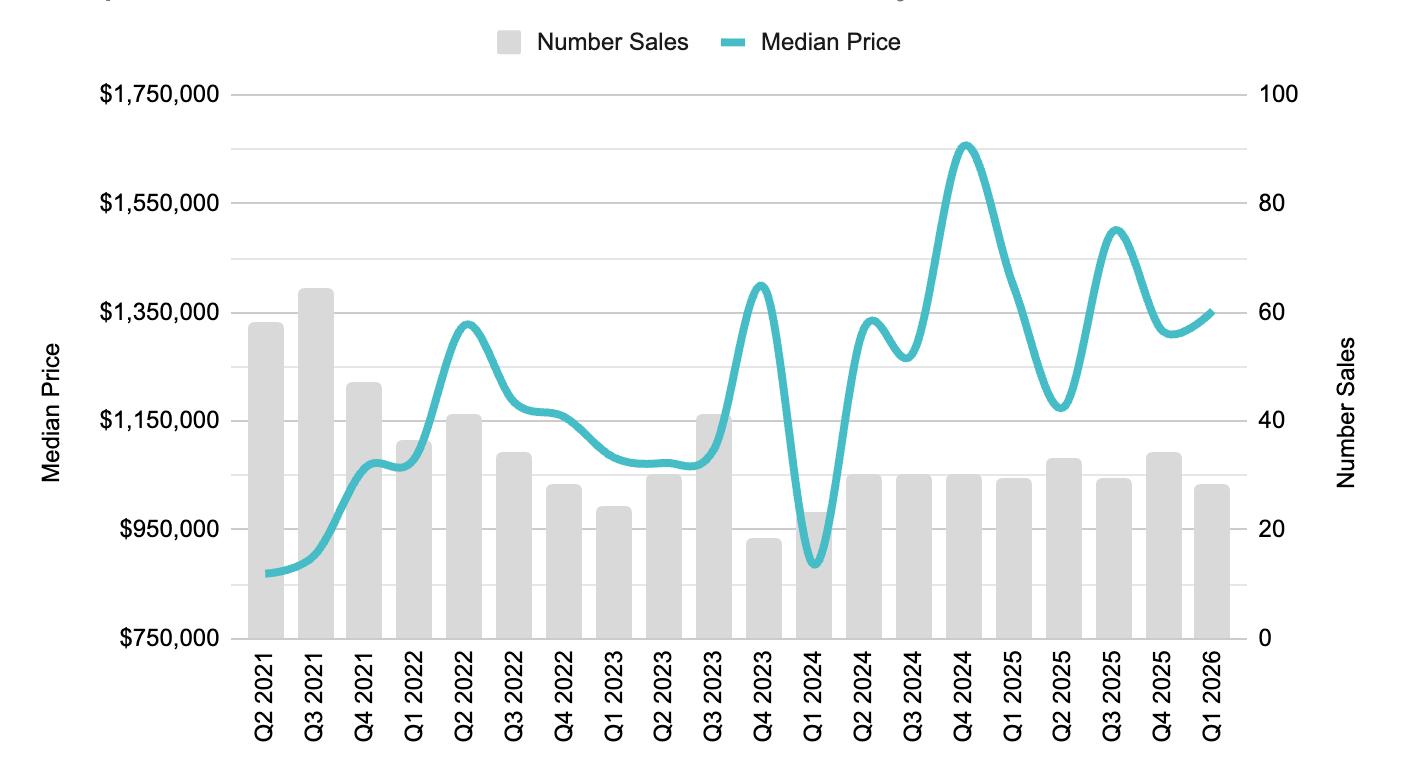
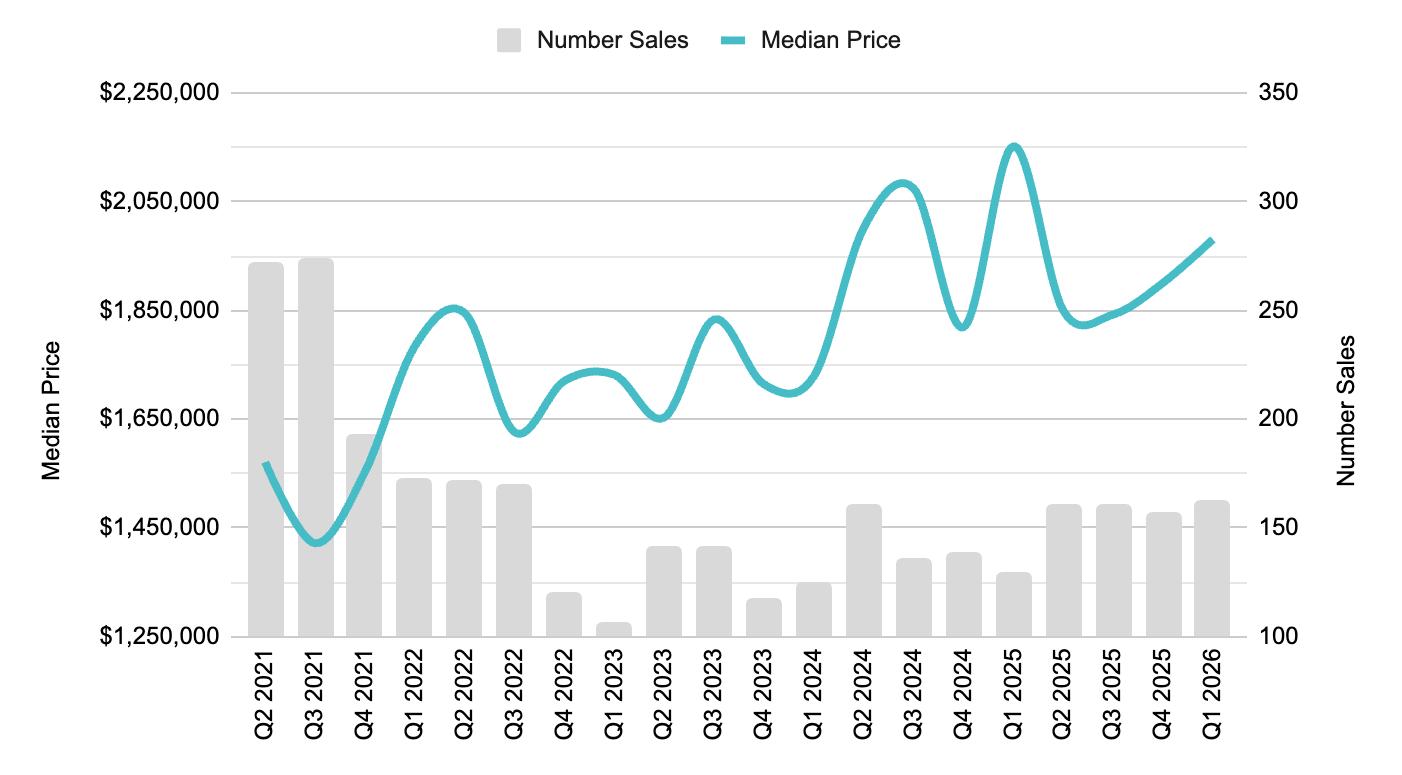
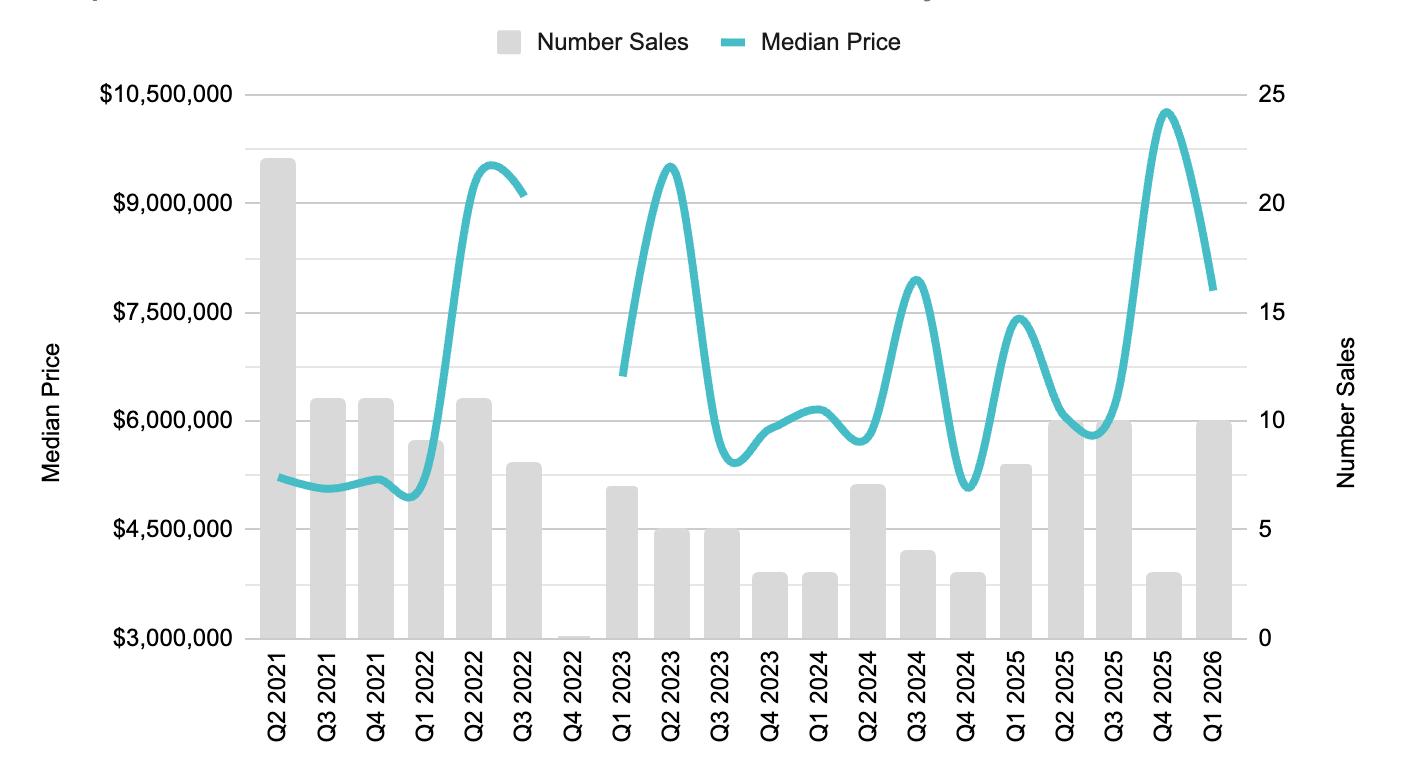
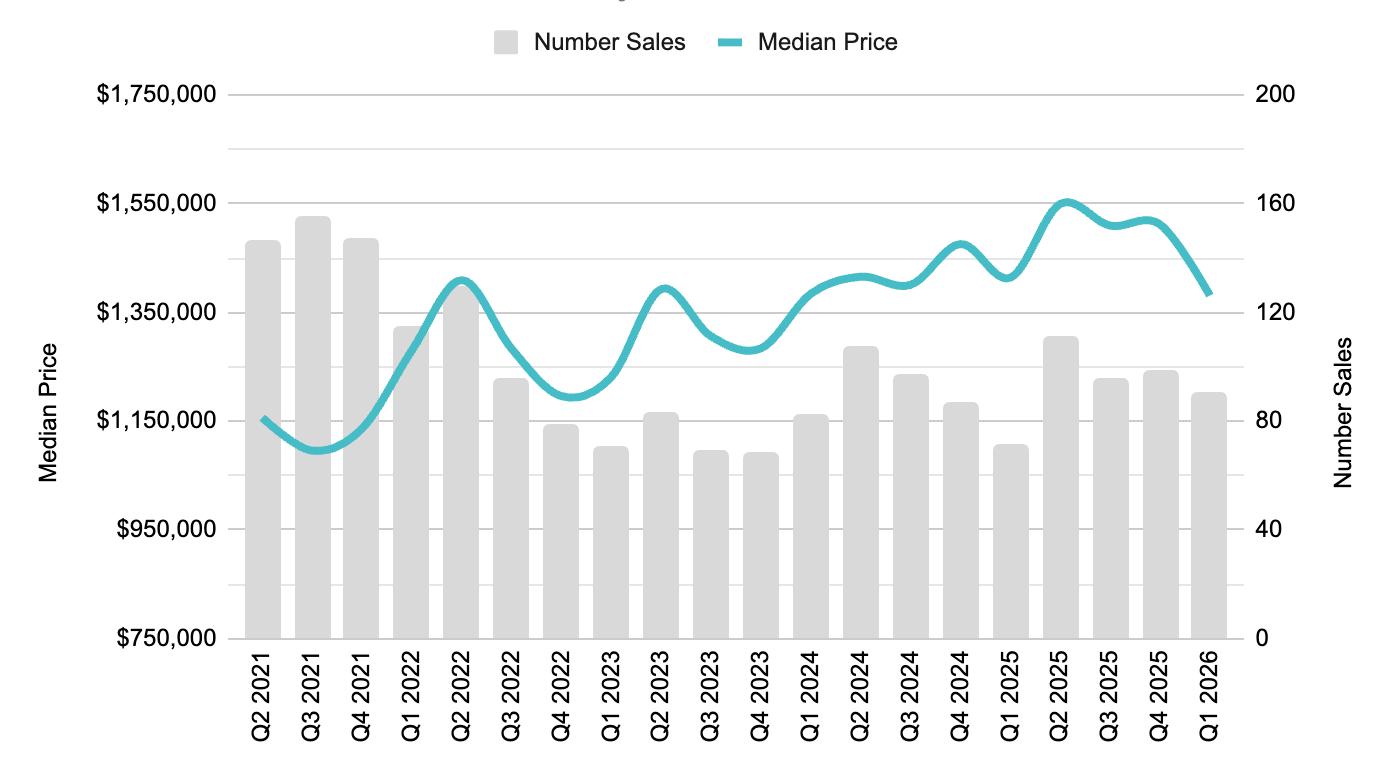
Median Price for South Santa Barbara County in Q1 2026 declined slightly 2% compared to Q4 2025, but 11% compared to Q1 2025. In Q4, Median Price was just under $1.8MM, down $200,000 from one year ago when Median Price was $2MM. Since Q2 2024, pricing has been rangebound between $1.8MM and $2MM depending on the Quarter.
We reiterate this ‘reset’ is a positive dynamic for the market long term as the consistent double digit increases in pricing during 2021 and 2022 (during the severe undersupply condition), were not and are not sustainable. As supply gradually came back to the market starting in 2023, price increases generally became more muted (in the single digit range).
Market conditions and especially price performance should always be more closely analyzed by submarket.

Carpinteria
MARCH 2026
$1,647,000

Carpinteria
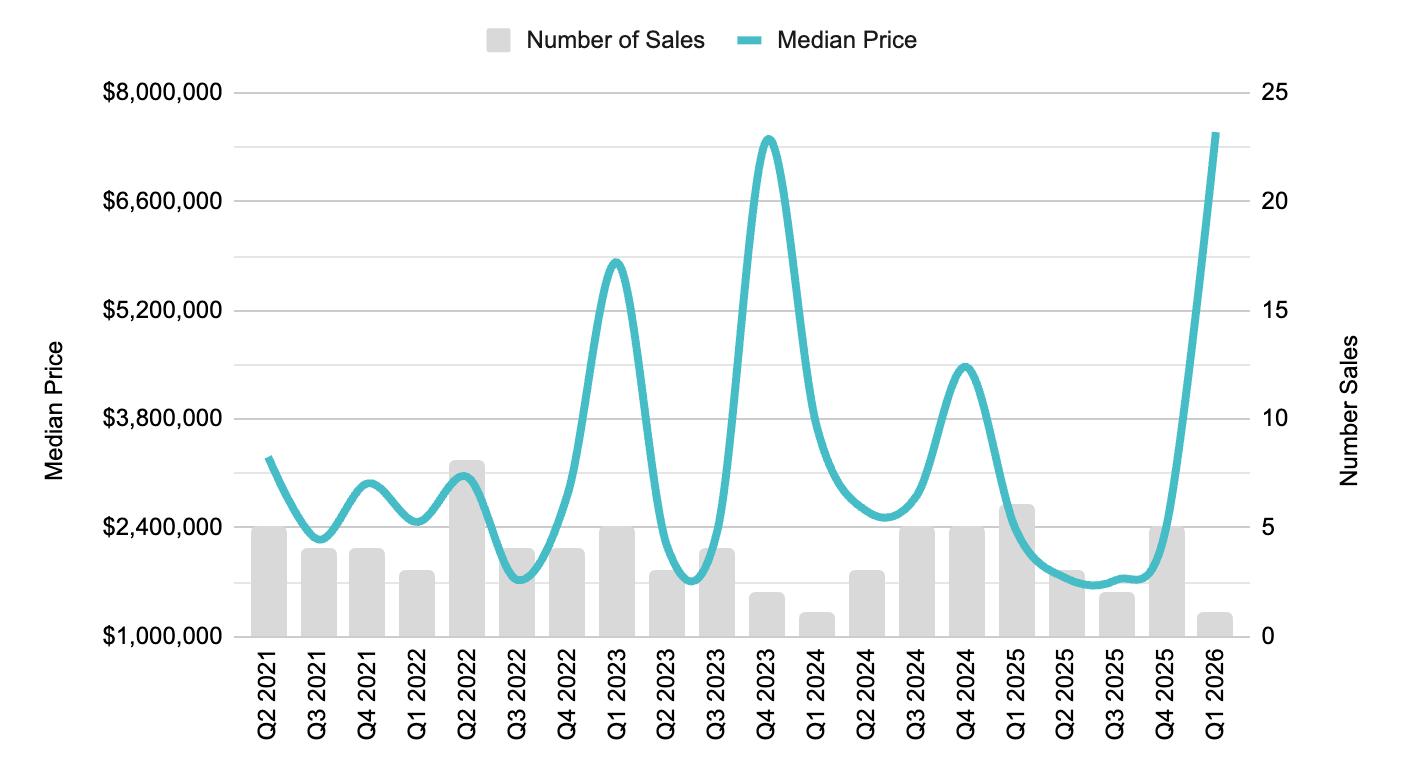
Over in Carp, there were 28 closed sales in Q1, down a mild 3% YoY. Median Price came in at $1.35MM, a 3% decline compared to Q1 2025 ($1.4MM). Compared to Q4 though, pricing ticked up 3% (from $1.315MM). This quarter, the most notable transactions included one new construction sale at Polo Condos: 3250 Polo Way ($3.3MM), in addition to 439 Lambert Rd ($9.6MM), and an estate on Padaro Ln ($29MM).

Summerland
Summerland is another submarket with typically few sales per month/quarter, which makes it tougher to compare. There was only one sale in Summerland in the first quarter, 480 Ortega Ridge Rd for $7.5MM.

1
$7,500,000
$7,500,000

$5,347,500

$2,676,500
$2,507,000
Montecito
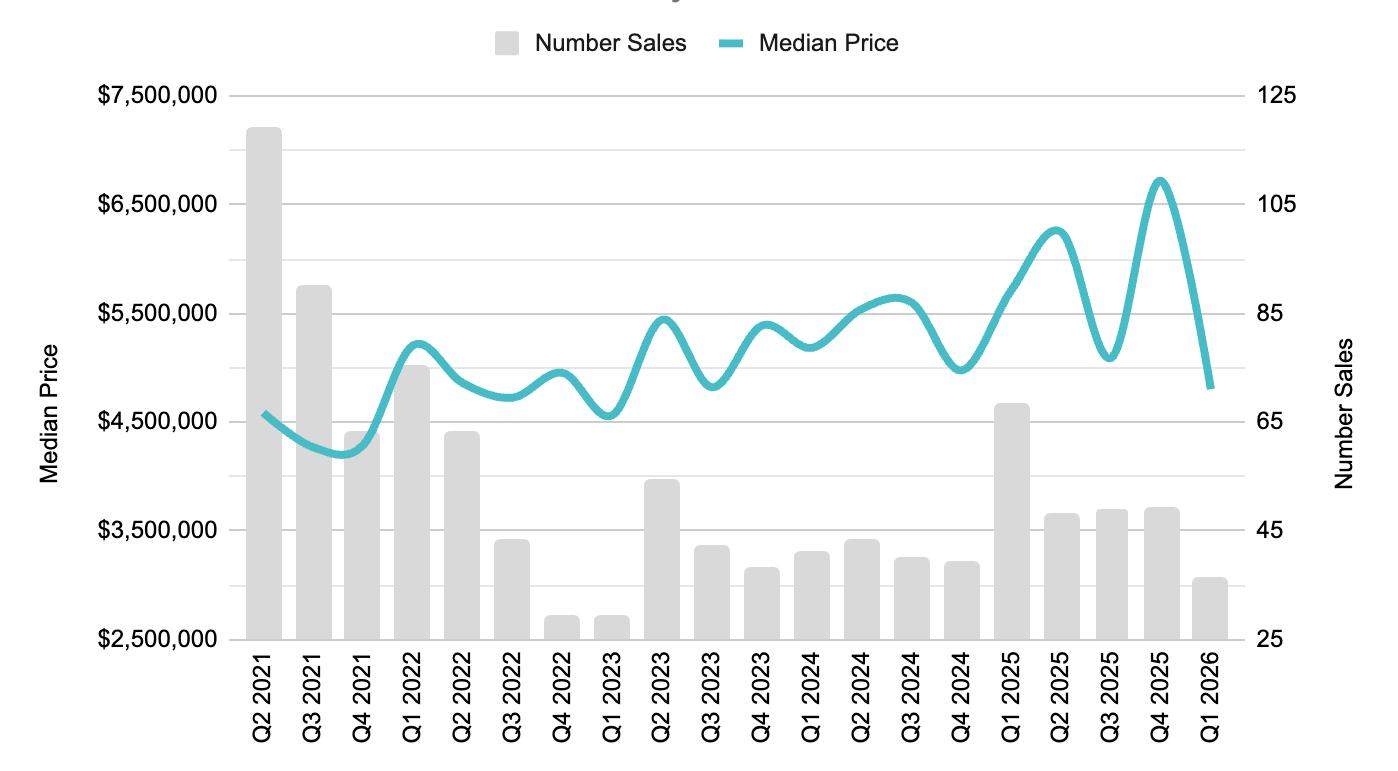
Statistically speaking, the Montecito market took a bit of a breather this quarter, with sales down 47% compared to Q1 2025, which was a strong quarter for sales post covid (36 sales vs. 68). Median Price also backtracked, declining by 16% from Q1 2025 ($4.8MM vs. $5.7MM). For reference in Q1 2025, there were six sales over $20MM, whereas in Q1 2026, there were none. The most notable sales this quarter were 940 Alston Rd ($14MM) and 633 Parra Grande Ln ($14.5MM).

Santa Barbara
Sales in Santa Barbara jumped 26% compared to a year ago, from 129 in Q1 2025 to 162 in Q1 2026. Median Price, however, declined 8%, to just under $2MM (vs. $2.15MM in Q1 2025). This quarter there were eight sales over $5MM and three over $7MM; most notably 1420 APS ($7.25MM), 945 Arbolado Rd ($7.65MM), and 2805 Spyglass Ridge Rd ($7.795MM).
Santa Barbara

$1,338,743
$1,200,000

from 2025 MARCH 2026
$6,712,500

$7,617,000
Hope Ranch
Month-to-month and quarter-to-quarter comparisons in Hope Ranch are typically difficult as there are so few transactions to analyze, which creates “skew” in key metrics. Q1 was another breakout quarter for Hope Ranch, with 10 sales at a Median Price of $7.8MM (+5% YoY). There were four sales over $8MM; 765 Via Vistosa ($8.24MM), 4328 Via Esperanza ($8.83MM), 4178 Cresta Ave ($9.83MM), and 4200 Marina Dr ($15.5MM).

Goleta
There were 90 sales in Goleta this quarter, up 27% YoY. The Median Price of $1.4MM was down slightly by 2% compared to Q1 2025, and down 9% from last quarter. Generally, Median Pricing in 2023 was $1.3MM, $1.4MM in 2024, and sat at a new benchmark of $1.5MM for 2025. The most notable sales in the first quarter were 1045 Via Los Padres ($4.08MM), 1030 Via Los Padres ($4.15MM), 1062 Camino del Retiro ($4.675MM), and 4678 Bedrock Court ($5.2MM), in the Foothills around San Antonio Creek.

Santa Ynez Valley Review in Numbers
SANTA YNEZ VALLEY
MARCH 2026 YTD
TOTAL SALES
44 (+10% over 2025)
SINGLE FAMILY RESIDENCE SALES
39 (+18% over 2025)
CONDOMINIUM SALES
5 (-29% over 2025)
S ingle Family
SANTA YNEZ VALLEY
MARCH 2026 YTD
AVERAGE SALES PRICE • YTD
$1,964,088 -13% change from 2025
MEDIAN SALES PRICE • YTD
$1,650,000 -9% change from 2025


SANTA YNEZ VALLEY MARCH 2026 YTD
AVERAGE SALES PRICE • YTD
$676,780 -13% change from 2025
MEDIAN SALES PRICE • YTD
$680,000 -6% change from 2025

4
$650,000
Solvang and Ballard

1
$839,900

Los Olivos & Santa Ynez
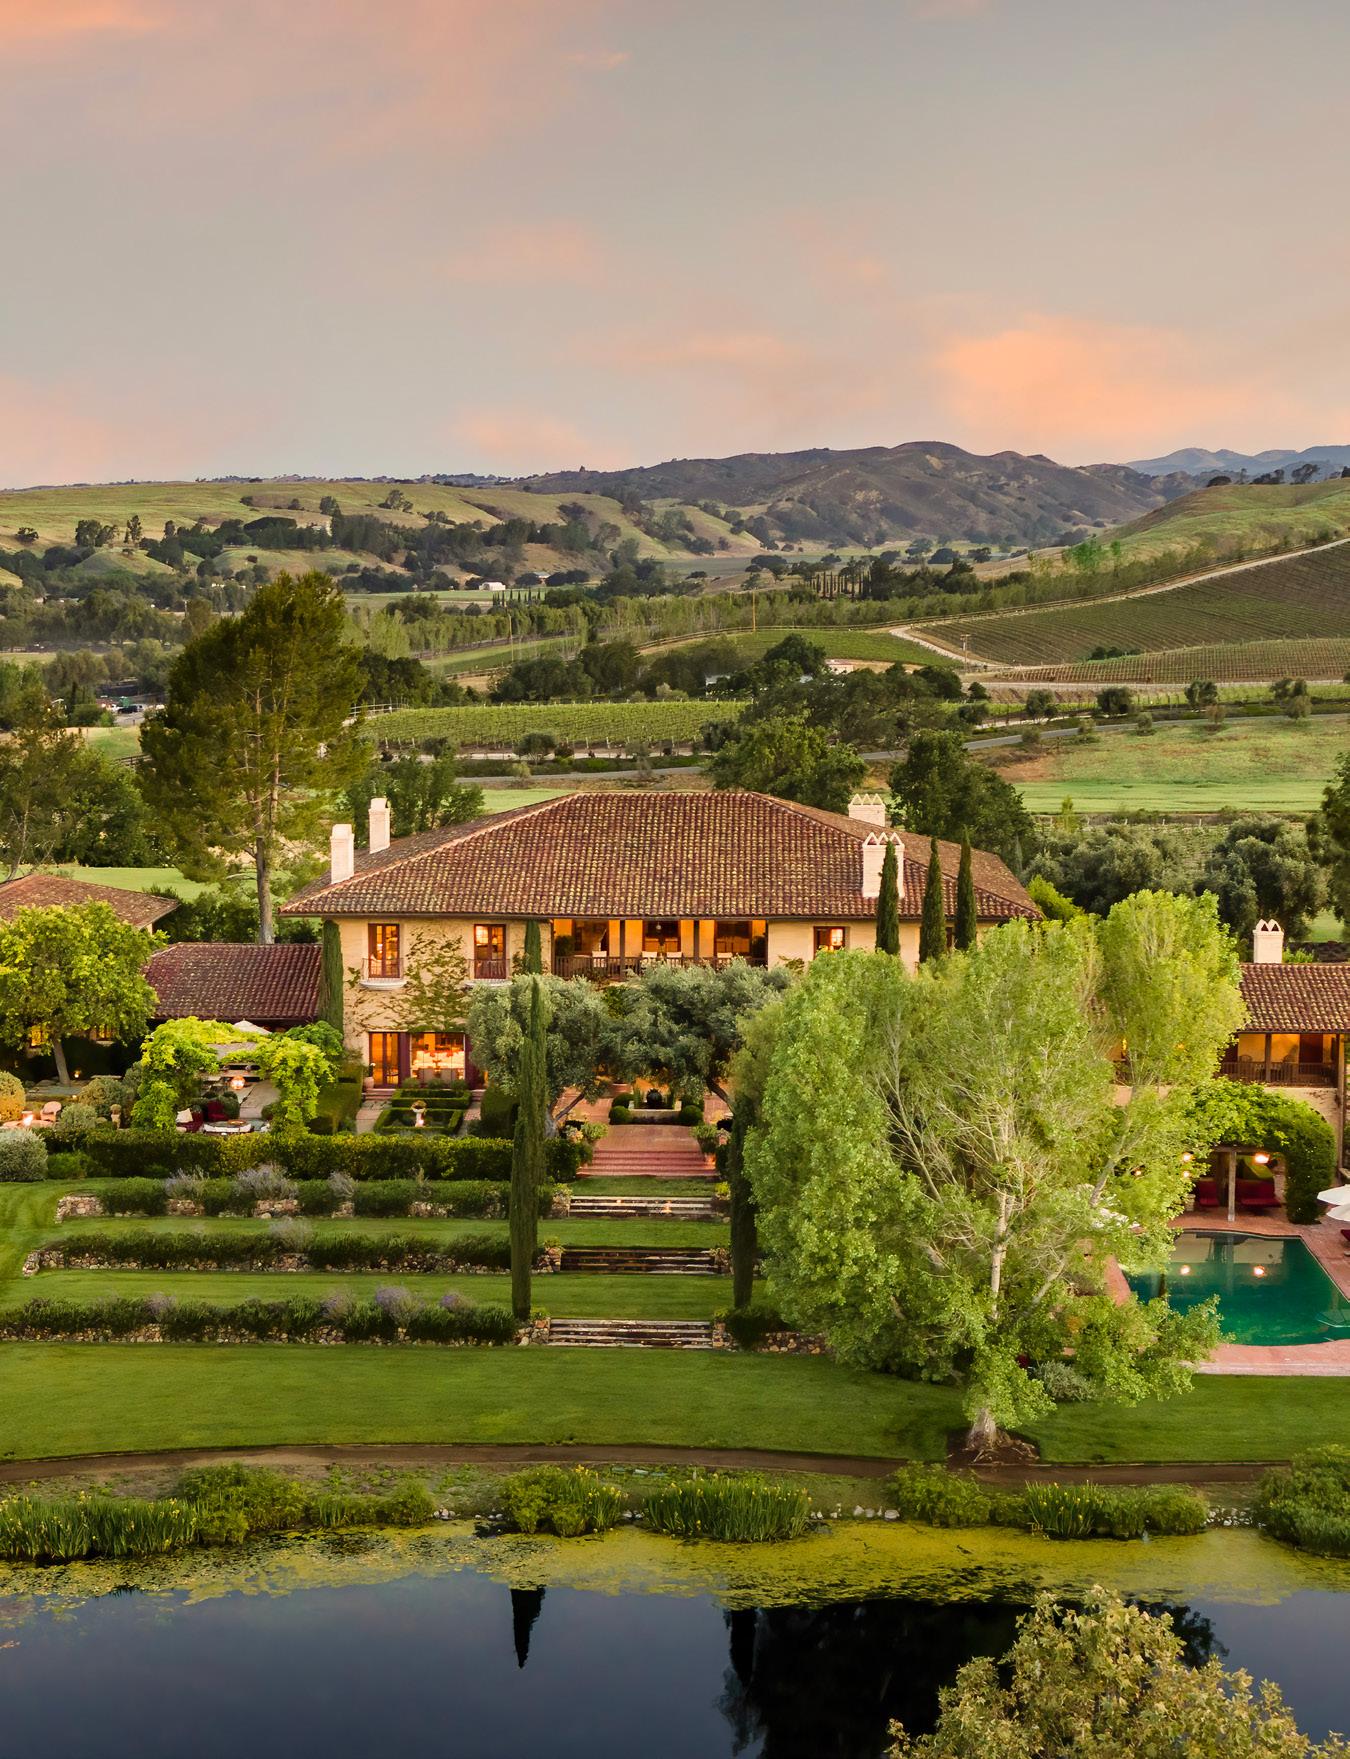
Santa Ynez
TOTAL SALES · YEAR TO DATE
14
SINGLE FAMILY RESIDENCES • YTD
AVERAGE SALES PRICE · YTD
$2,350,063
MEDIAN SALES PRICE · YTD $2,375,000

TOTAL SALES · YEAR TO DATE
3 AVERAGE SALES PRICE · YTD $2,000,000
MEDIAN SALES PRICE · YTD $1,450,000
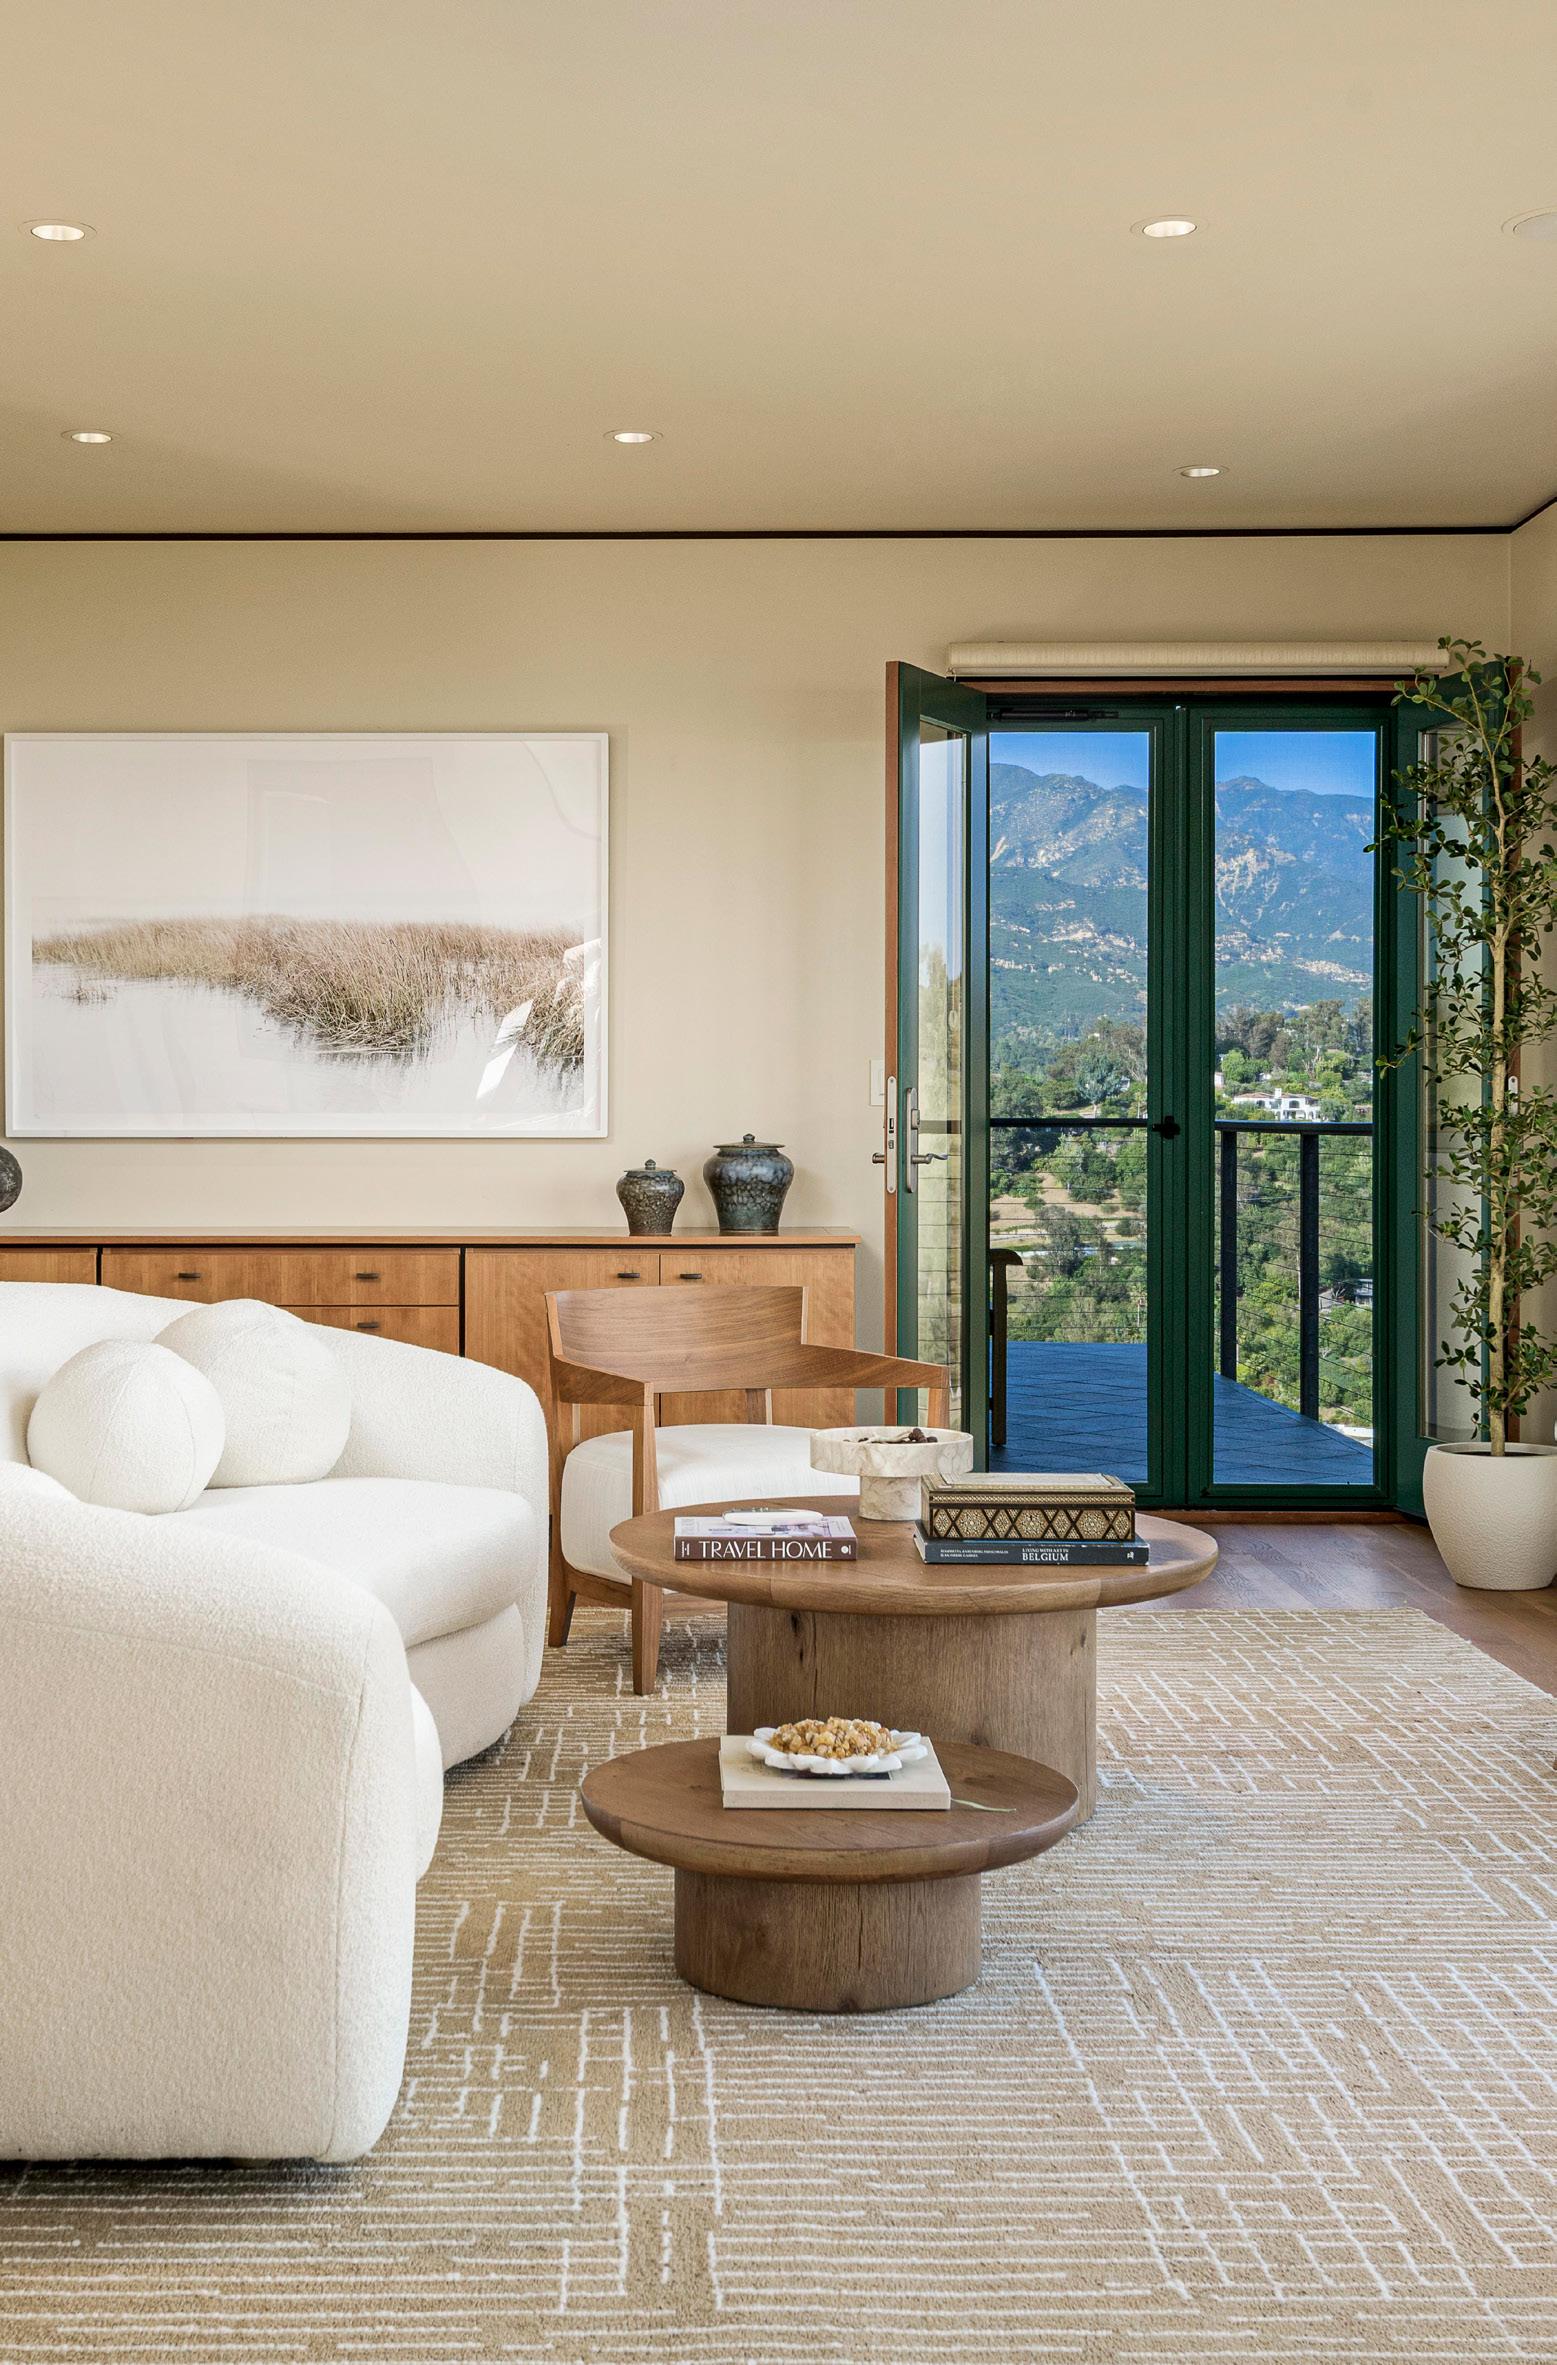
50 RINCON VISTA ROAD, SANTA BARBARA

Global Connections

“Our global partners ensure your home is seen by interested buyers across the world.”
RENEÉ GRUBB Founder & CEO

We are fortunate to be in a place that people all over the world desire to be. We cultivate strategic global relationships that ultimately benefit you by putting your home in front of those people.