
Santa Barbara Area Market Report
SANTA BARBARA AREA REAL ESTATE THROUGH JUNE 2026
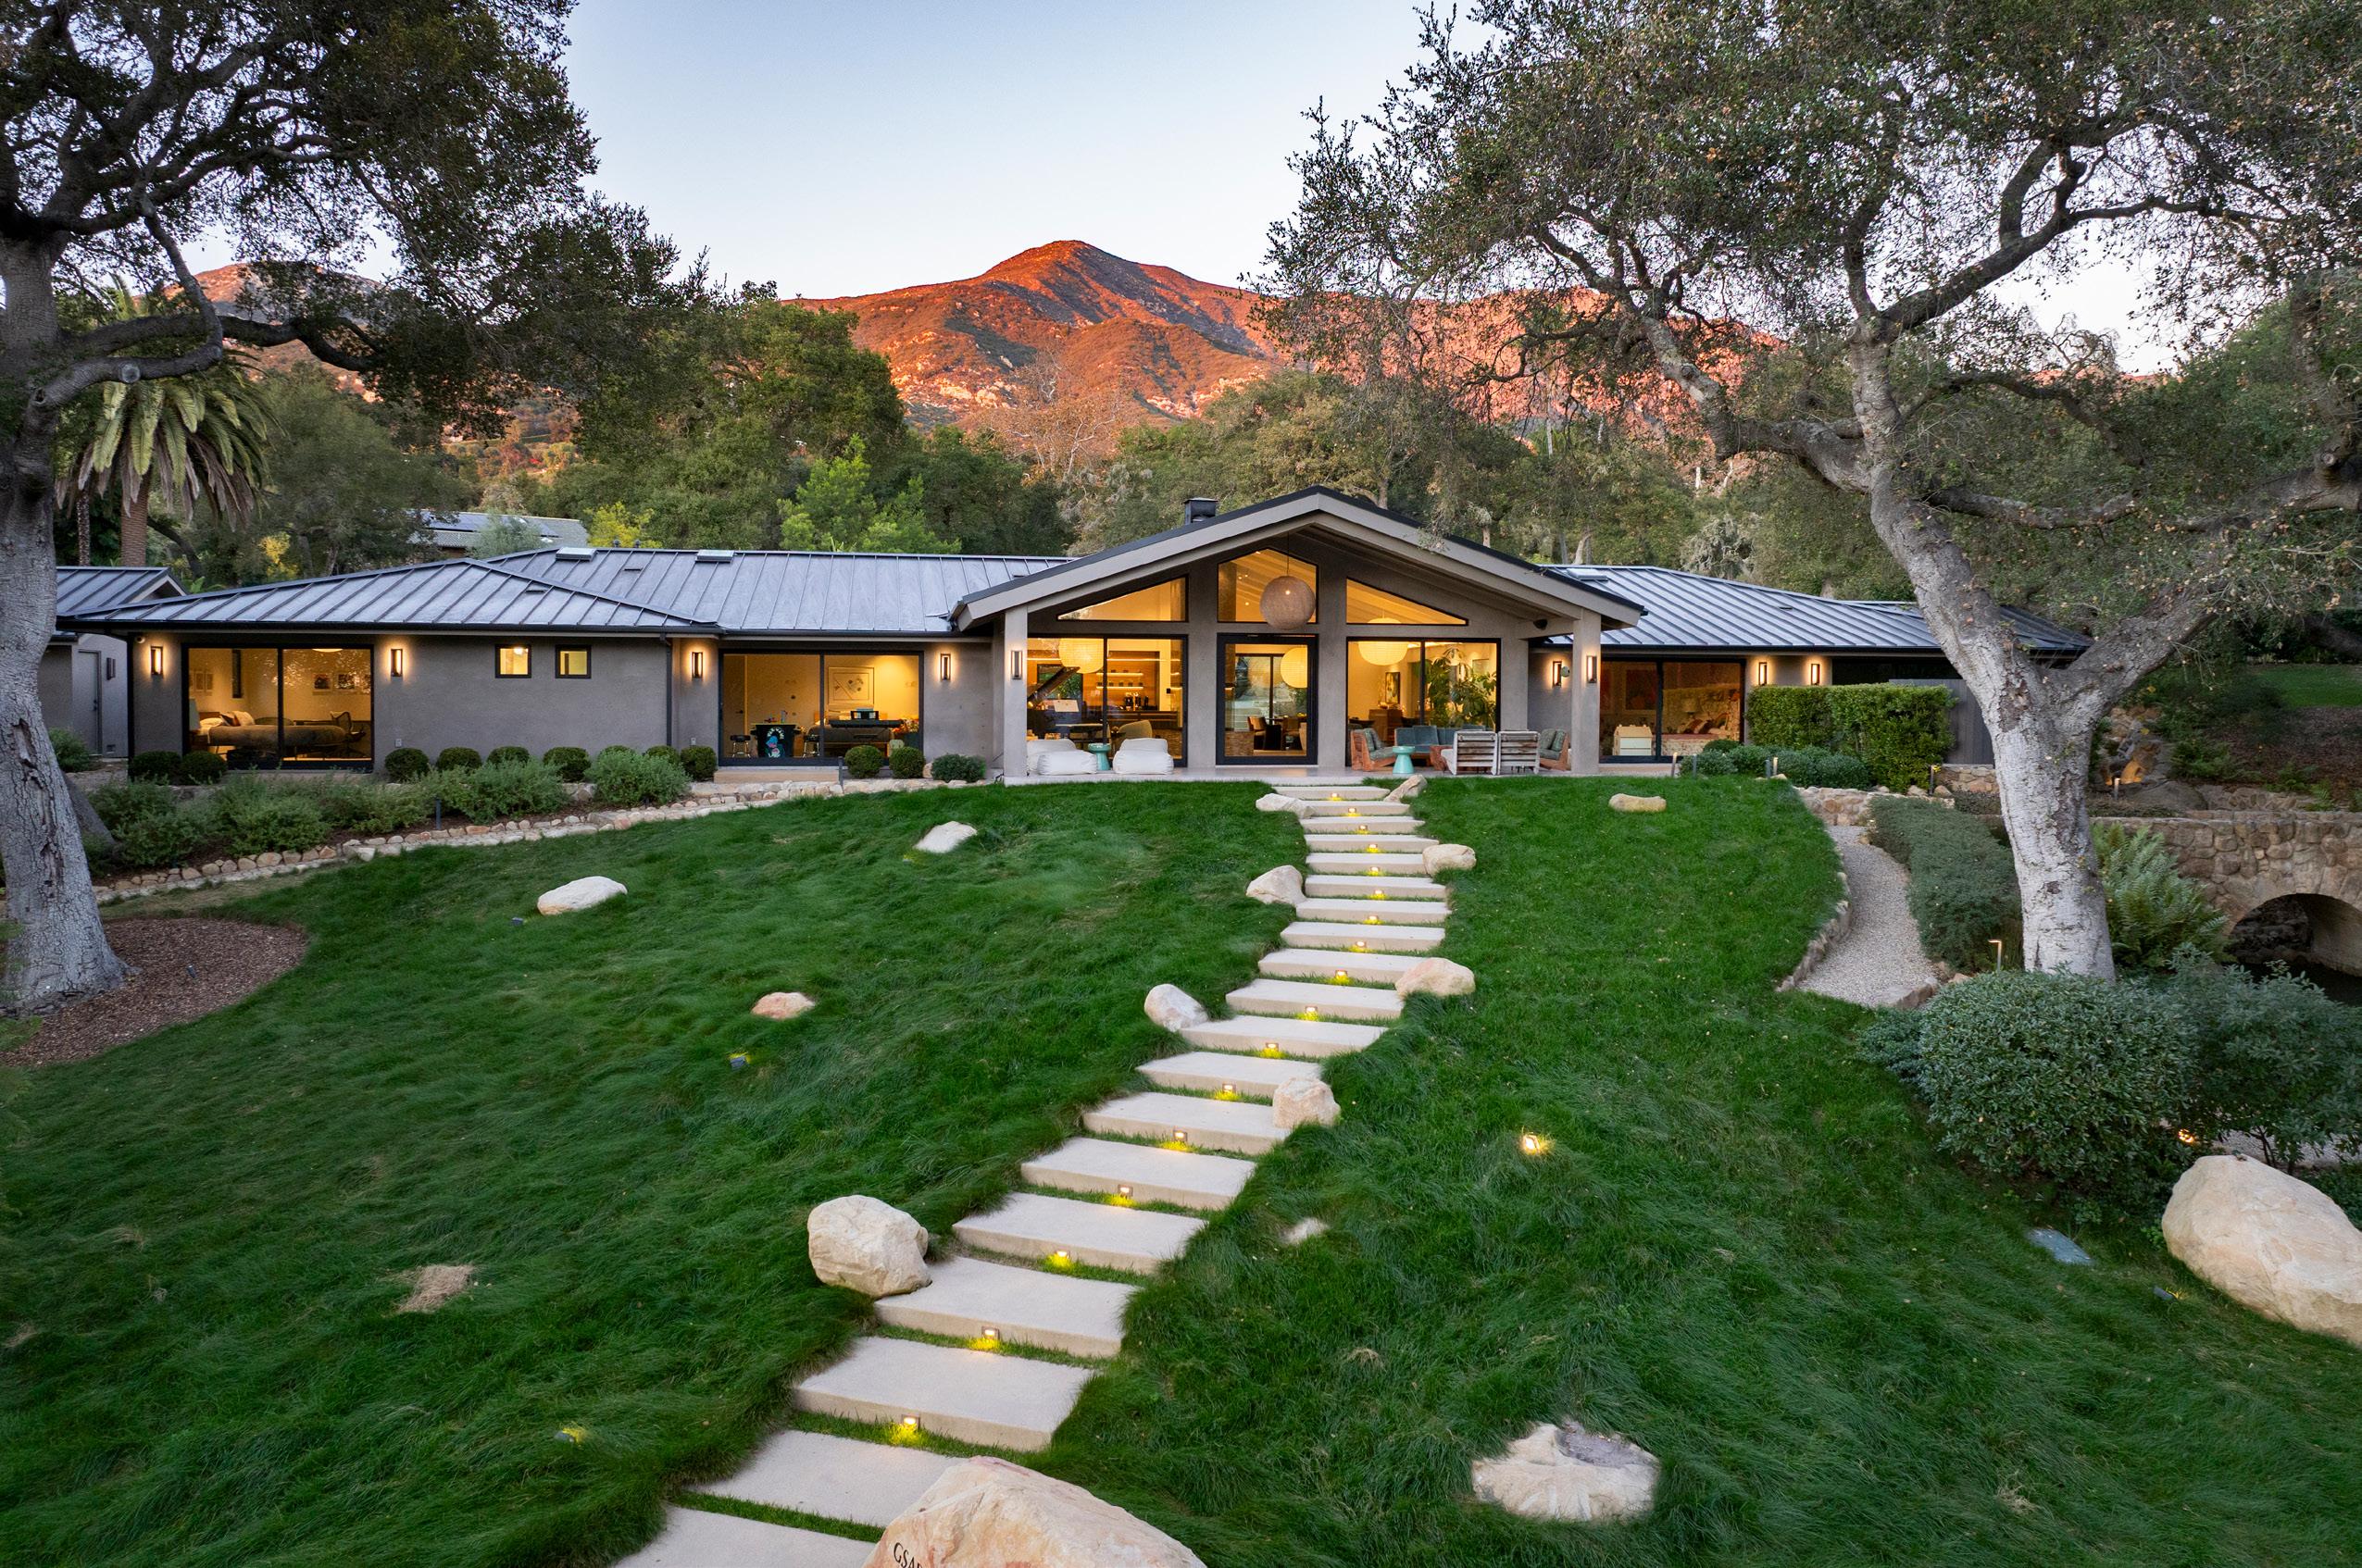

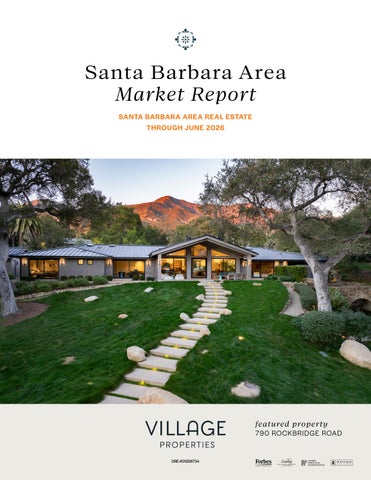
790 ROCKBRIDGE ROAD
TOTAL SALES
726
(+7% change from 2025)
Review in Numbers
SOUTH
SANTA
BARBARA
COUNTY JUNE 2026 YTD
SINGLE FAMILY RESIDENCE SALES
522
(+7% change from 2025)
CONDOMINIUM SALES
204
(+9% change from 2025)
Greetings, and thank you for reading our Second Quarter 2026 Market Report.
The spring selling season delivered on its promise. Q2 saw 399 closed sales—a 9% year-over-year increase and a 22% jump from Q1—marking the strongest second quarter for sales since 2022. Just as notable, the dramatic submarket shifts we highlighted last quarter largely normalized, with activity redistributing back toward historical patterns.
After capturing an outsized 50% of South County sales in Q1, Santa Barbara proper settled back to 46%—right in line with its long-term average. Montecito, which saw its market share cut in half a year ago, rebounded to 14% of sales. Perhaps the quarter’s most compelling story, however, was Carpinteria, where 47 closed sales (up 42% YoY) represented the submarket’s highest quarterly count since late 2021.
Pricing, meanwhile, continues to demonstrate remarkable stability. The overall Median Price came in at $1.8MM—up 1% from Q1 and down a modest 2% year-over-year—extending the rangebound pattern between $1.8MM and $2MM that has held since Q2 2024. We continue to view this plateau as a healthy consolidation following the unsustainable double-digit appreciation of 2021–2022, and a foundation from which the market can grow at a durable pace.
We hope this report provides valuable context, but the nuances of each neighborhood are unique. Should you have specific inquiries, please do not hesitate to contact us. The entire Village Properties team is dedicated to providing you with tailored insights and exceptional service.
Best regards,
Renee Grubb
S ingle Family
SOUTH SANTA BARBARA COUNTY
JUNE 2026 YTD
AVERAGE SALES PRICE • YTD
$3,584,830 -2% change from 2025
MEDIAN SALES PRICE • YTD
$2,147,500 -12% change from 2025


SOUTH SANTA BARBARA COUNTY JUNE 2026 YTD
AVERAGE SALES PRICE • YTD
$1,278,954 -11% change from 2025
MEDIAN SALES PRICE • YTD
$1,027,500 - 11% change from 2025
SALES & INVENTORY
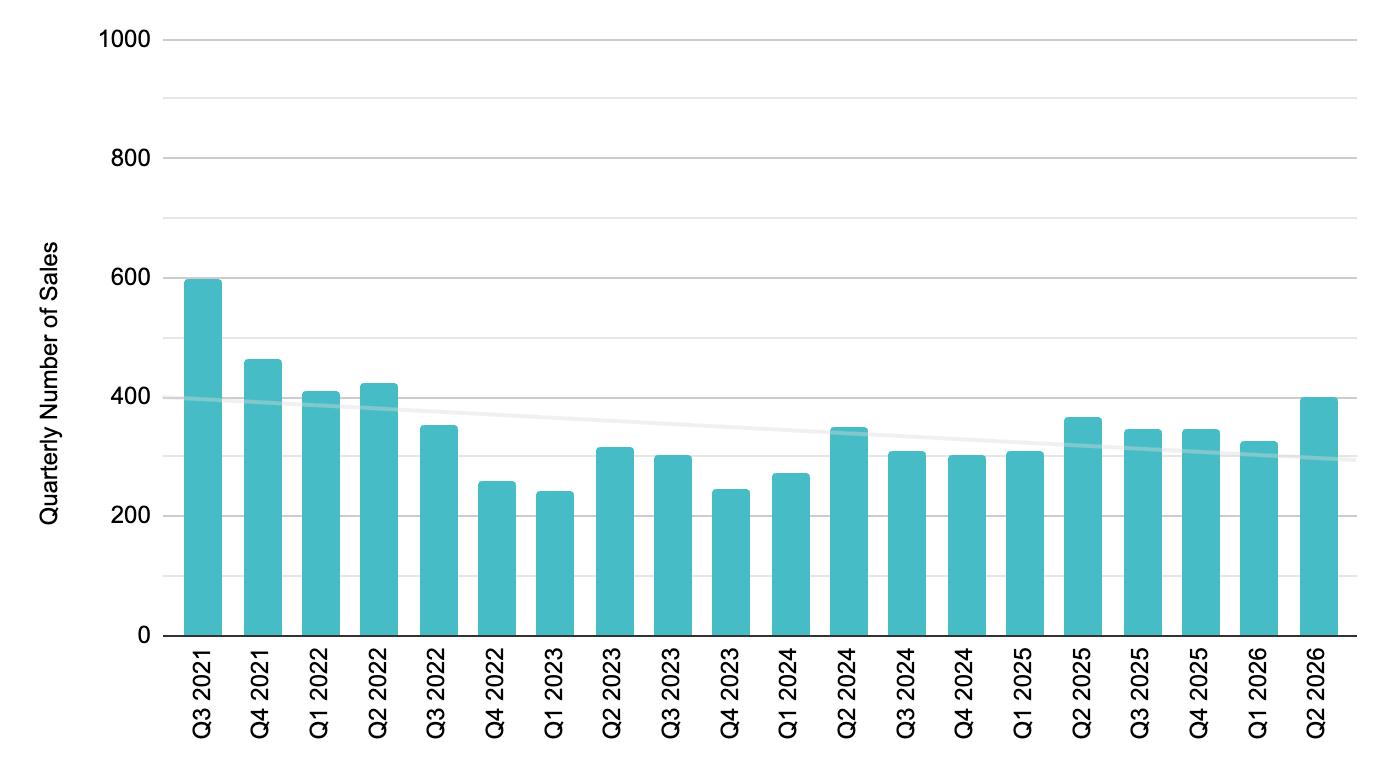
There were 399 closed sales in the Second Quarter, an increase of 9% from one year ago and up 22% from Q1. On a seasonal basis over the past five years, sales have increased by roughly 19% on average from Q1 to Q2, so this year’s spring bounce was slightly stronger than the recent norm.
Whereas Q1 was defined by dramatic shifts in the distribution of sales—Santa Barbara proper hit its highest market share since 2018 while Montecito’s share fell by half—Q2 saw a broad normalization back toward historical patterns. Santa Barbara represented 46% of sales, easing from 50% last quarter and right at its long-run average. Montecito rebounded from 11% of total sales in Q1 to 14% this quarter, in line with its typical share. Goleta moderated from 28% to 25%. The standout was Carpinteria, which captured 12% of South County sales—well above its 9% historical average.
On the inventory front, Q2 told a tale of two halves. As a reminder, we ended Q1 with Months of Supply (MoS) declining each month—landing at 2.93 in March—which had the market moving in the wrong direction if we’re seeking better balance. April continued that slide, dipping to 2.90. Then the spring listing season arrived in force: May jumped to 3.81, the highest May reading since 2020 and comfortably above last May’s 3.49. The relief was short-lived, however. The same buyer demand that drove 399 closed sales absorbed much of that fresh inventory, and June settled at 3.12—notably below the 3.72 recorded in June 2025. Typically four to six MoS equals a neutral, balanced market, so despite the spring surge in listings, we remain firmly in supply-constrained territory.
Underscoring the point: 23% of June sales closed above list price, and average days on market yearto-date sits at just 41.
Santa Barbara Area real estate market
SOUTH SANTA BARBARA COUNTY · THROUGH JUNE 2026
PRICING
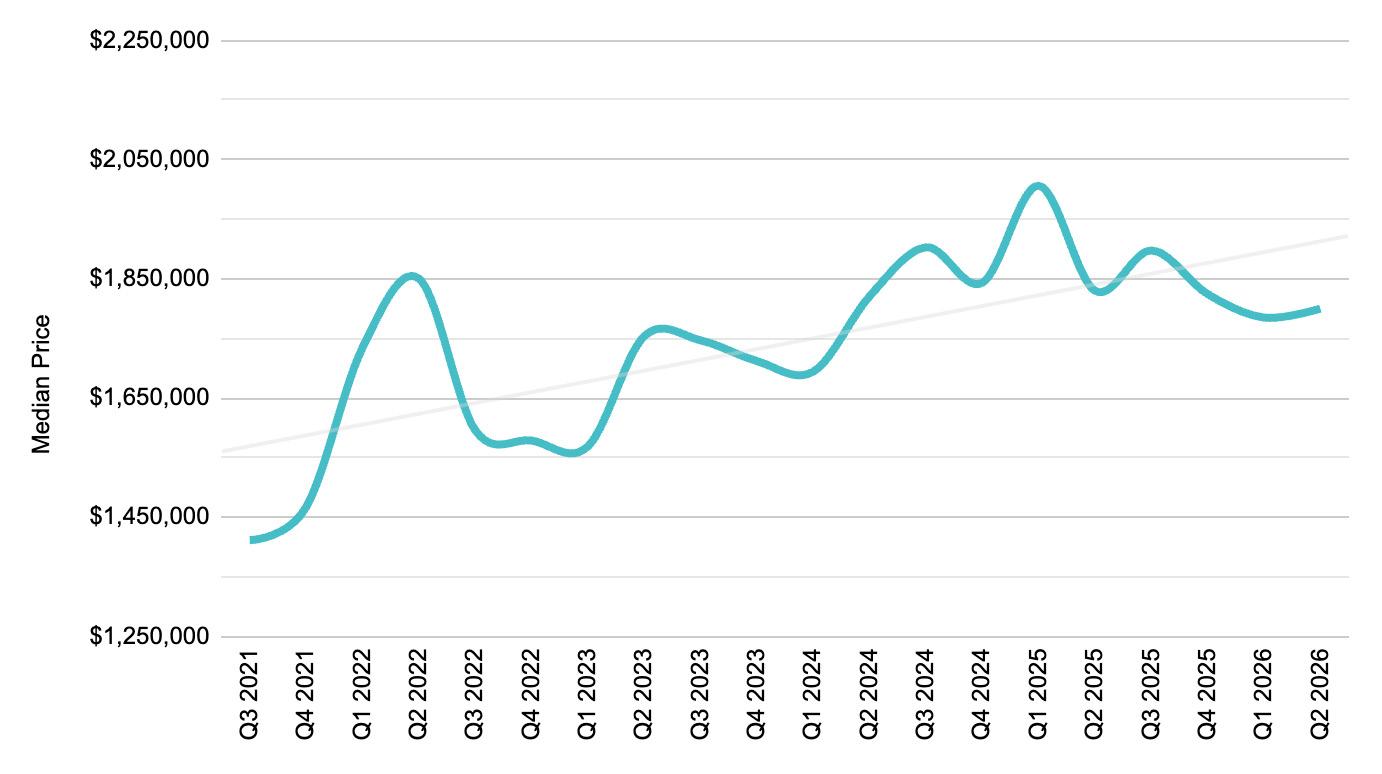
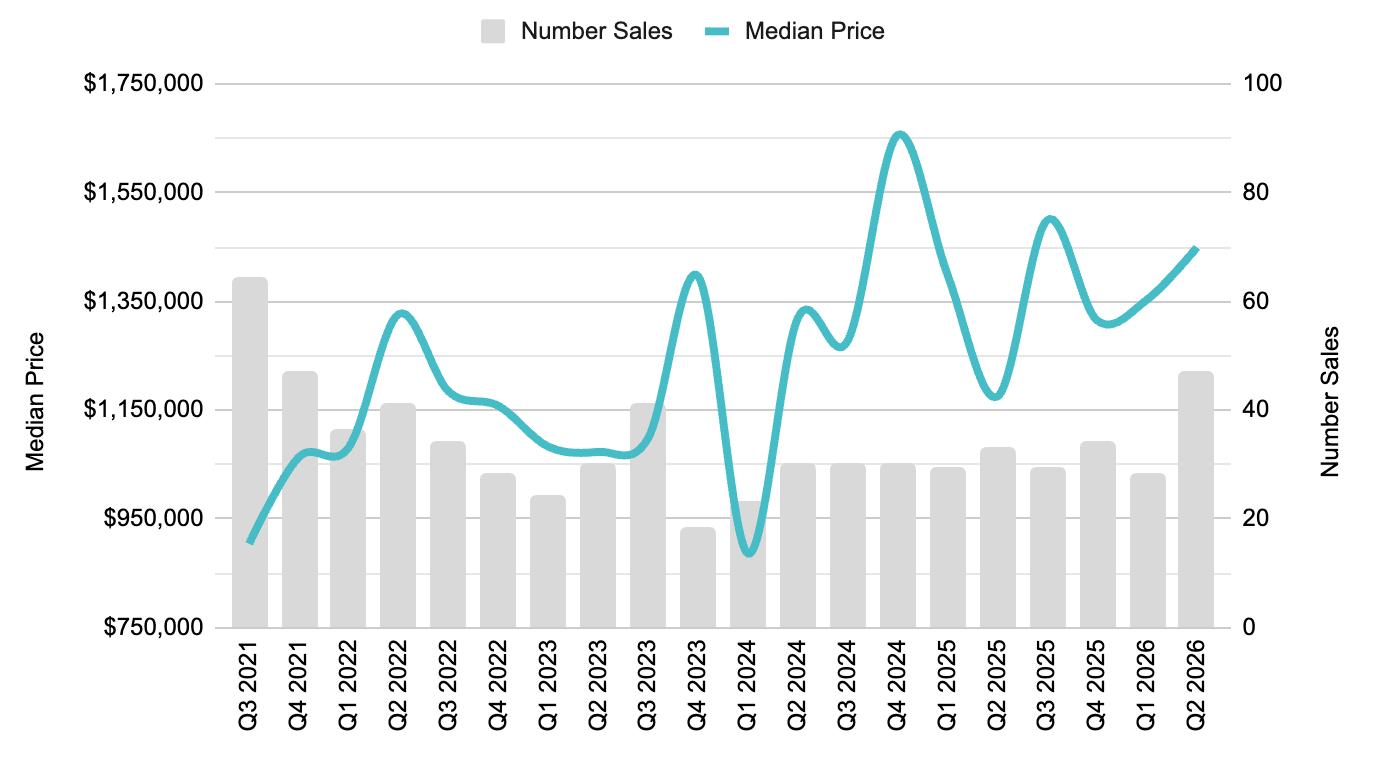
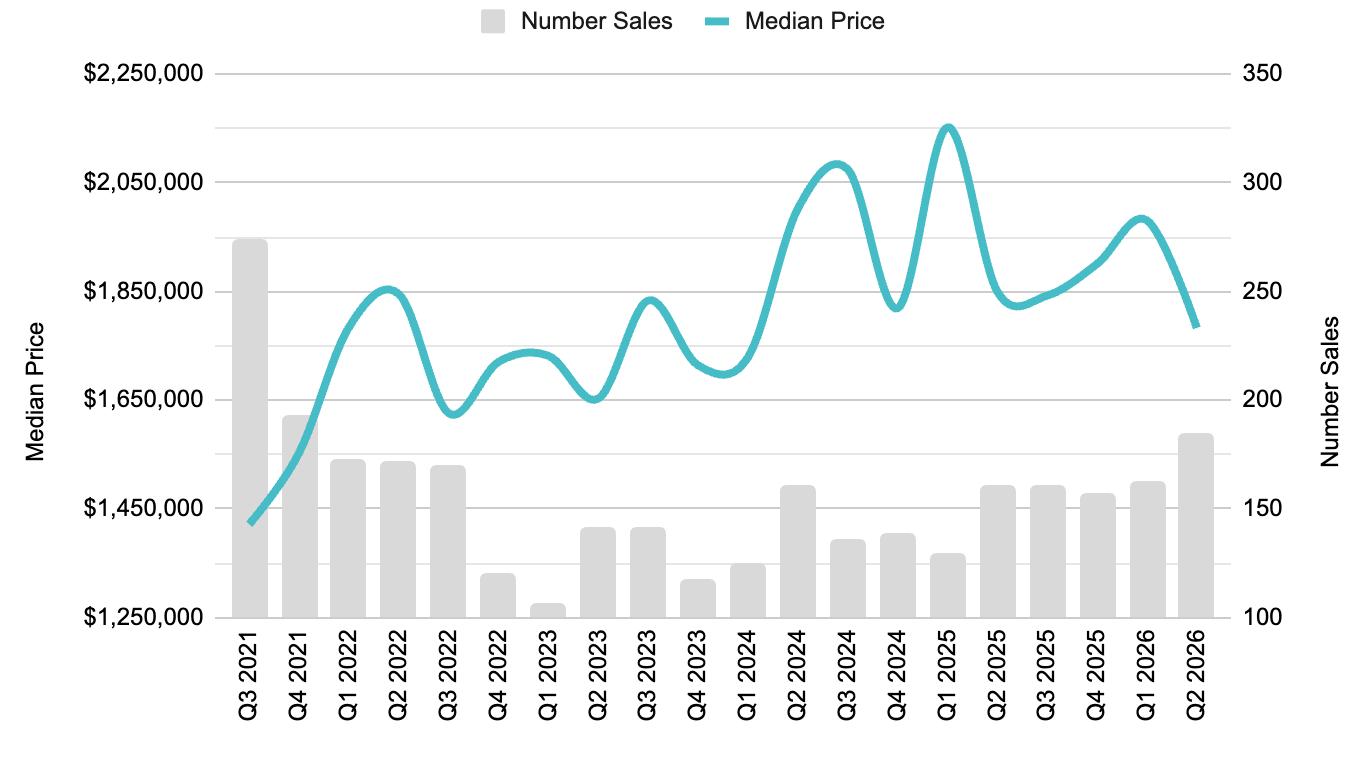
Median Price for South Santa Barbara County in Q2 2026 came in at $1.8MM, up 1% from Q1 2026 but down 2% compared to Q2 2025 ($1.83MM). Since Q2 2024, pricing has remained rangebound between $1.8MM and $2MM depending on the quarter, and this quarter sat at the lower bound of that channel.
We reiterate this ‘reset’ is a positive dynamic for the market long term, as the consistent double-digit increases in pricing during 2021 and 2022 (during the severe undersupply condition) were not and are not sustainable. With sales volume now growing year-over-year while pricing holds steady, the market appears to be finding an equilibrium where transaction activity—rather than price appreciation—is doing the work.
Market conditions and especially price performance should always be more closely analyzed by submarket.

Carpinteria
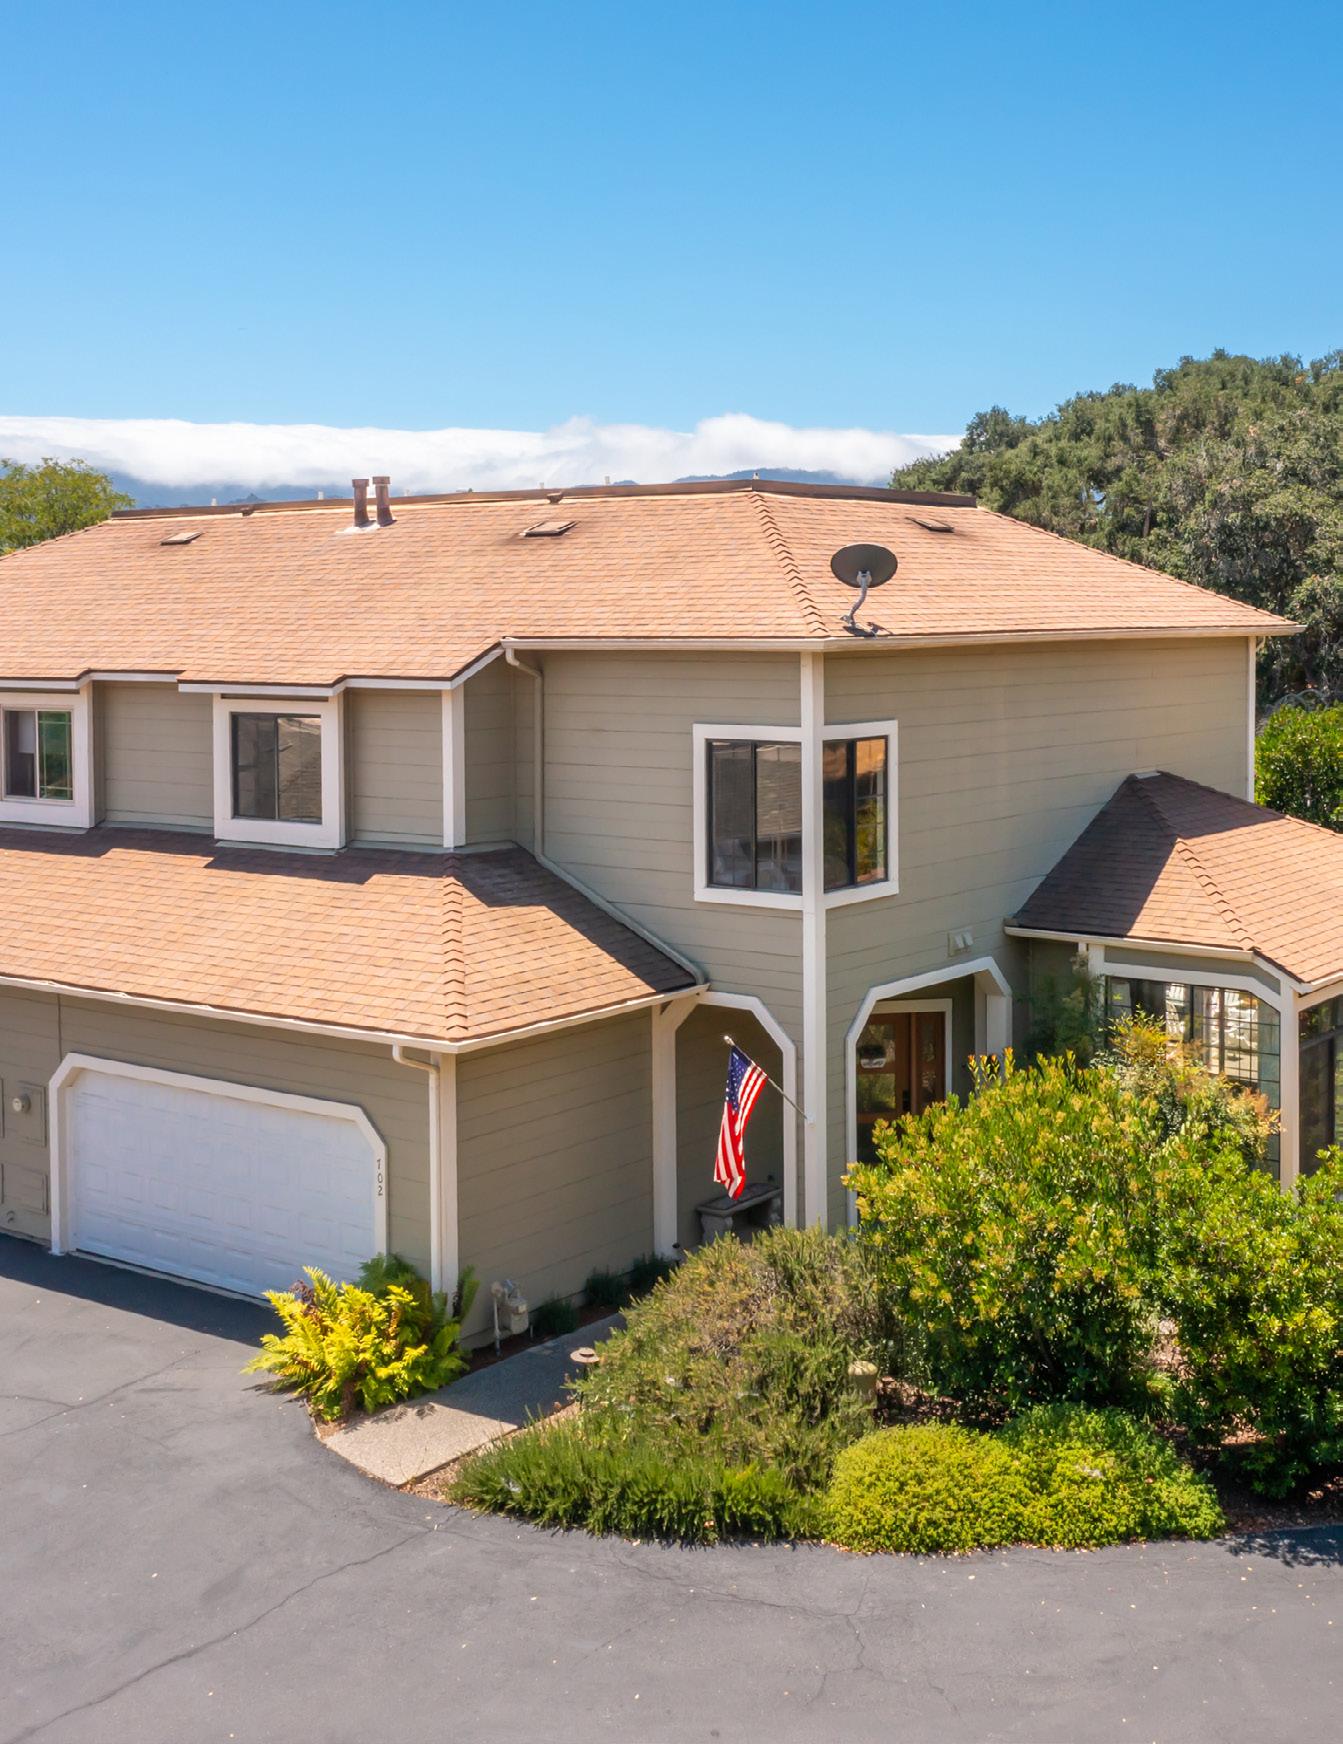
3211 PADARO LANE • click to view
JUNE 2026
15

4,546,003
SALES PRICE · YTD $ 2,025,000
$1,660,000 +34% change from 2025
$924,167
Carpinteria
Carpinteria was the story of the quarter. There were 47 closed sales, up 42% year-over-year (33 in Q2 2025) and the highest quarterly total for the submarket since Q4 2021. Median Price came in at $1.45MM, a 23% increase compared to Q2 2025 ($1.175MM) and up 7% from Q1. With both volume and pricing rising, Carp was the clear outperformer in the South County this quarter. And for the second consecutive quarter, the Padaro/Toro Canyon corridor produced blockbuster results: an estate at 3191 Padaro Lane closed at $33.3MM, joined by 338 Toro Canyon Road ($17.45MM) and 4535 Avenue Del Mar ($11.2MM).
3055 PADARO LANE

Summerland
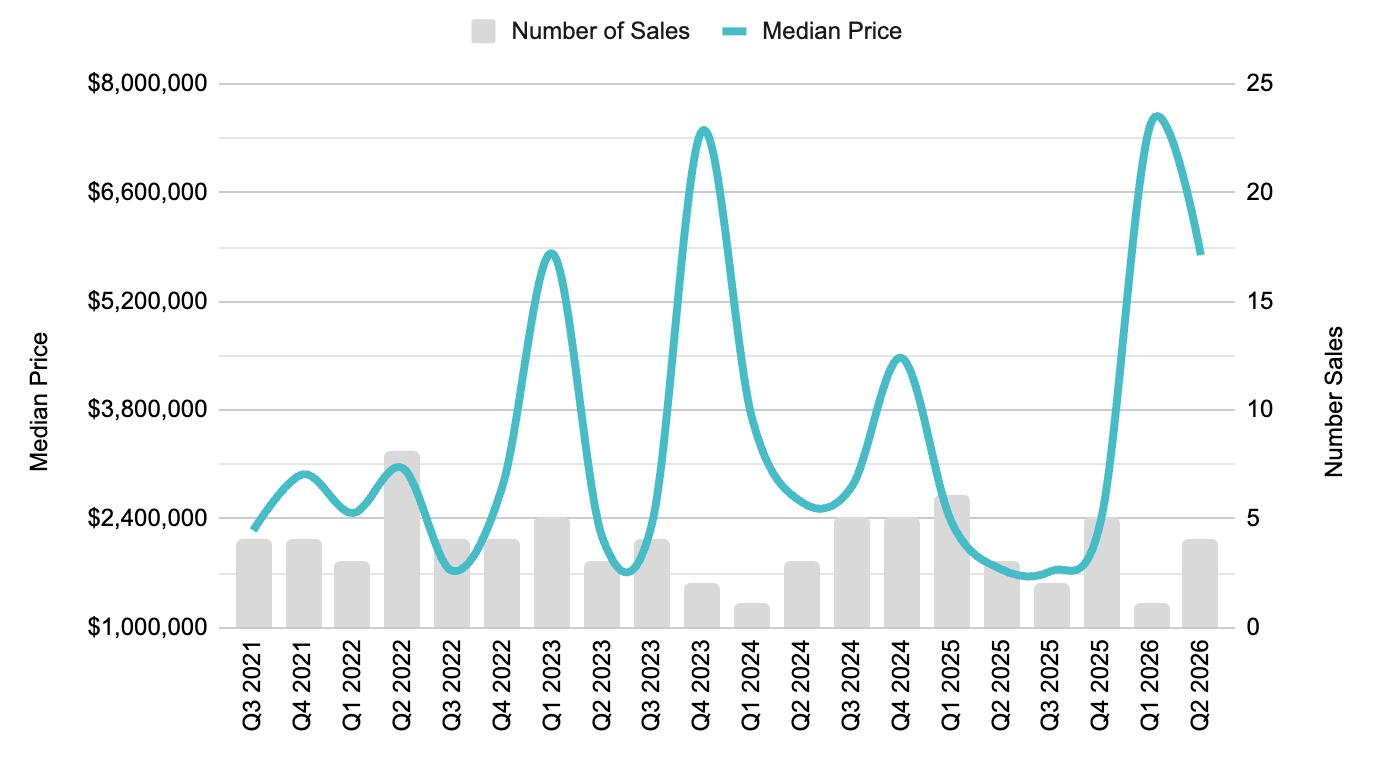
Summerland is another submarket with typically few sales per quarter, which makes it tougher to compare. There were four sales in the second quarter, up from just one in Q1. The standout was 2720 Montecito Ranch Place at $13.96MM; the other three transactions—2631 Freesia Drive ($3.9MM), 2525 Emerson Street ($3.2MM), and 2328 Whitney Avenue ($2.15MM)—clustered in a more typical range.
Summerland
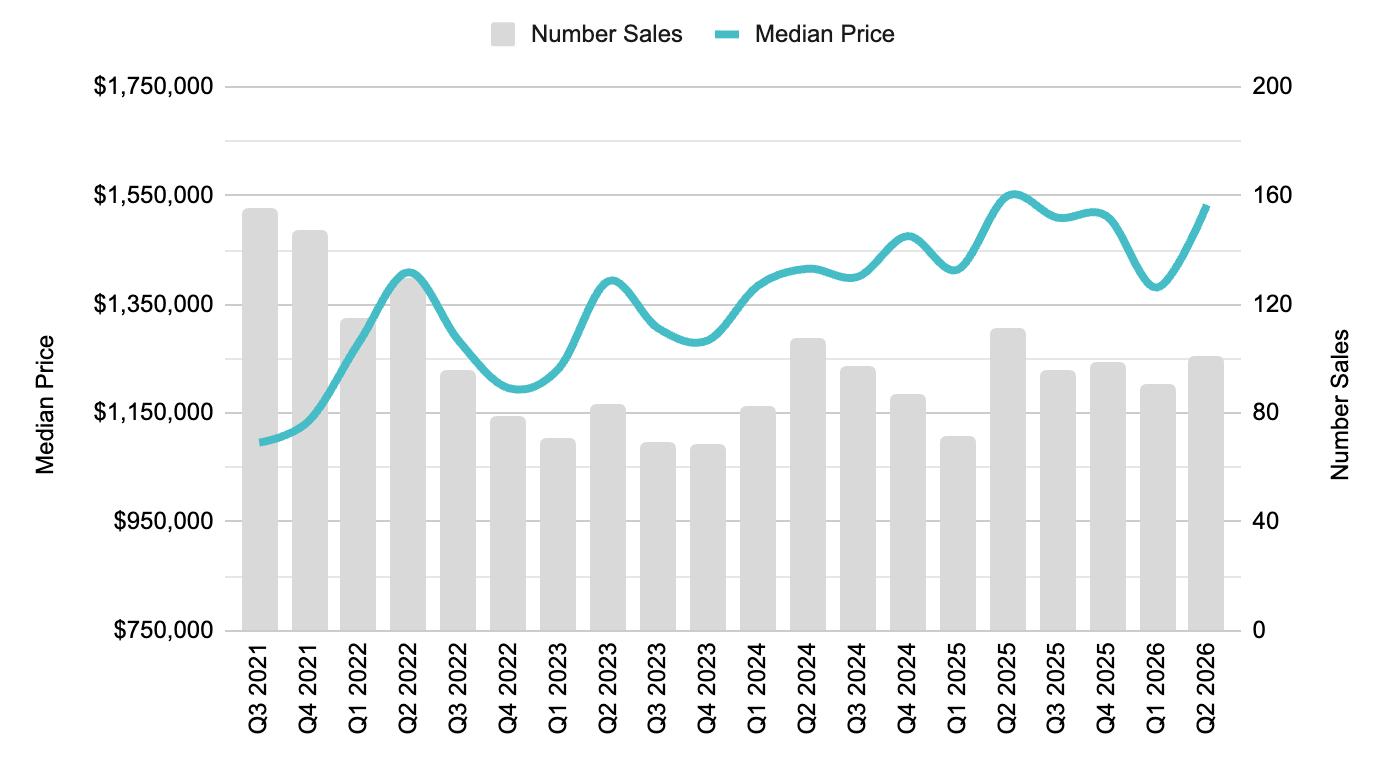
Median Price v Sales over the past 5 years

JUNE 2026
5
1
$3,195,000 +78% change from 2025
SALES PRICE · YTD
$6,139,000
SALES PRICE · YTD $3,900,000
0
$3,195,000 +78% change from 2025
SALES · YEAR TO DATE
SALES PRICE · YTD
0

Montecito
JUNE 2026

$3,295,071
$2,787,500
Montecito
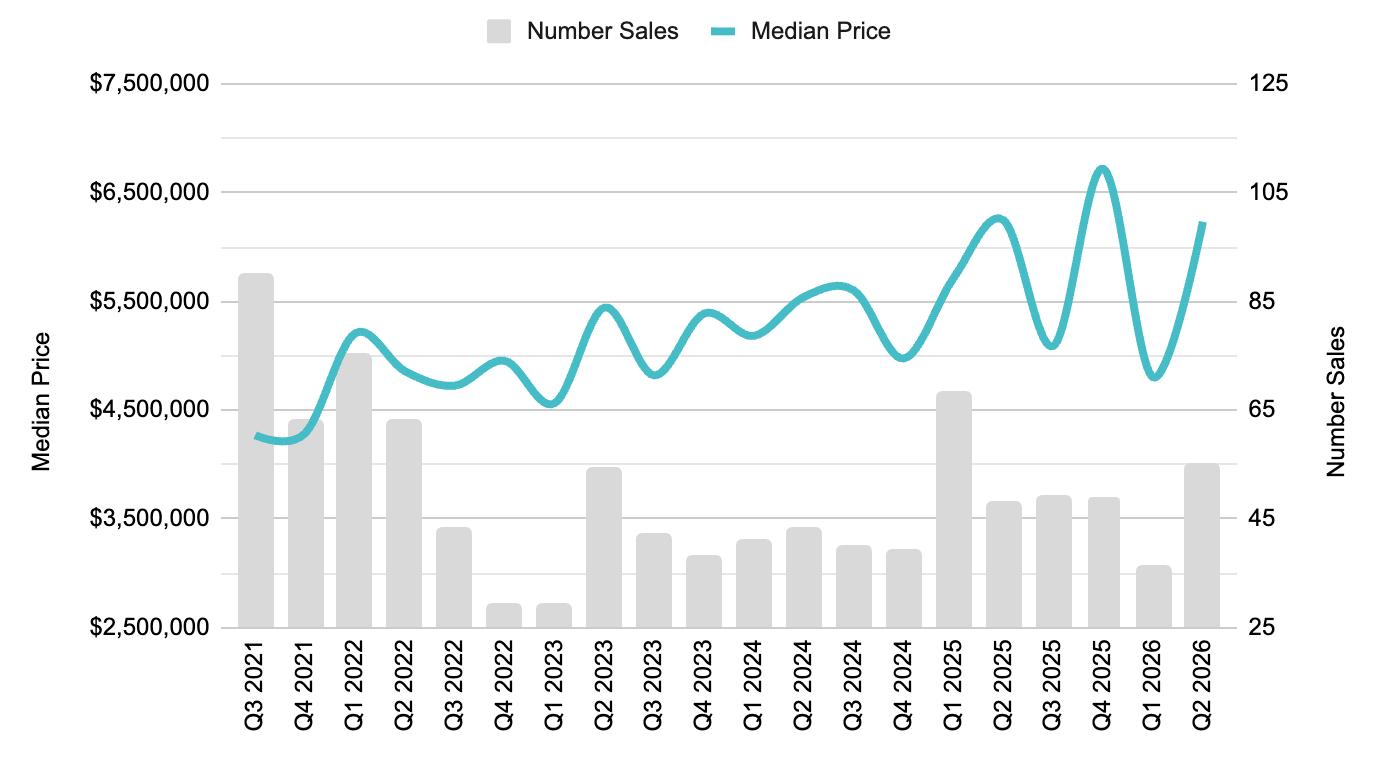
After taking a statistical breather in Q1, Montecito came roaring back this quarter. There were 55 closed sales, up 15% compared to Q2 2025 (48 sales) and up more than 50% from Q1’s 36. Median Price landed at $6.23MM—essentially flat year-over-year versus Q2 2025 ($6.25MM), but a 30% recovery from Q1’s $4.8MM.
The real story was at the top of the market. Whereas Q1 saw no sales above $20MM, Q2 produced four: 2910 Sycamore Canyon Road ($59.9MM), 1465 Edgecliff Lane ($30MM), 888 Lilac Drive ($26MM), and 1850 Jelinda Drive ($25.5MM). In total, 17 Montecito transactions closed at $10MM or above this quarter. The ultra-luxury segment that sat on the sidelines to start the year is unmistakably back.

Santa Barbara
Sales in Santa Barbara rose 15% compared to a year ago, from 160 in Q2 2025 to 184 in Q2 2026—the submarket’s highest quarterly sales count since Q4 2021. Median Price, however, declined 4% year-over-year to $1.78MM (vs. $1.85MM in Q2 2025), and was down 10% from Q1. As with the broader South County, buyers are showing up in force, but at price points below last year’s levels. This quarter there were five sales over $5MM, though none crossed $7MM (versus three in Q1); most notably 825 Roble Lane ($5.77MM), 1710 Mira Vista Avenue ($5.5MM), 125 W Mountain Drive ($5.43MM), 50 Rincon Vista Road ($5.35MM), and 2932 Cliff Drive ($5.25MM).
Barbara
JUNE 2026
57

247
2,423,346
$1,645,000 +2% change from 2025
SALES · YEAR TO DATE 99
$1,298,328
$1,099,000

Hope Ranch
JUNE 2026
2

Hope Ranch
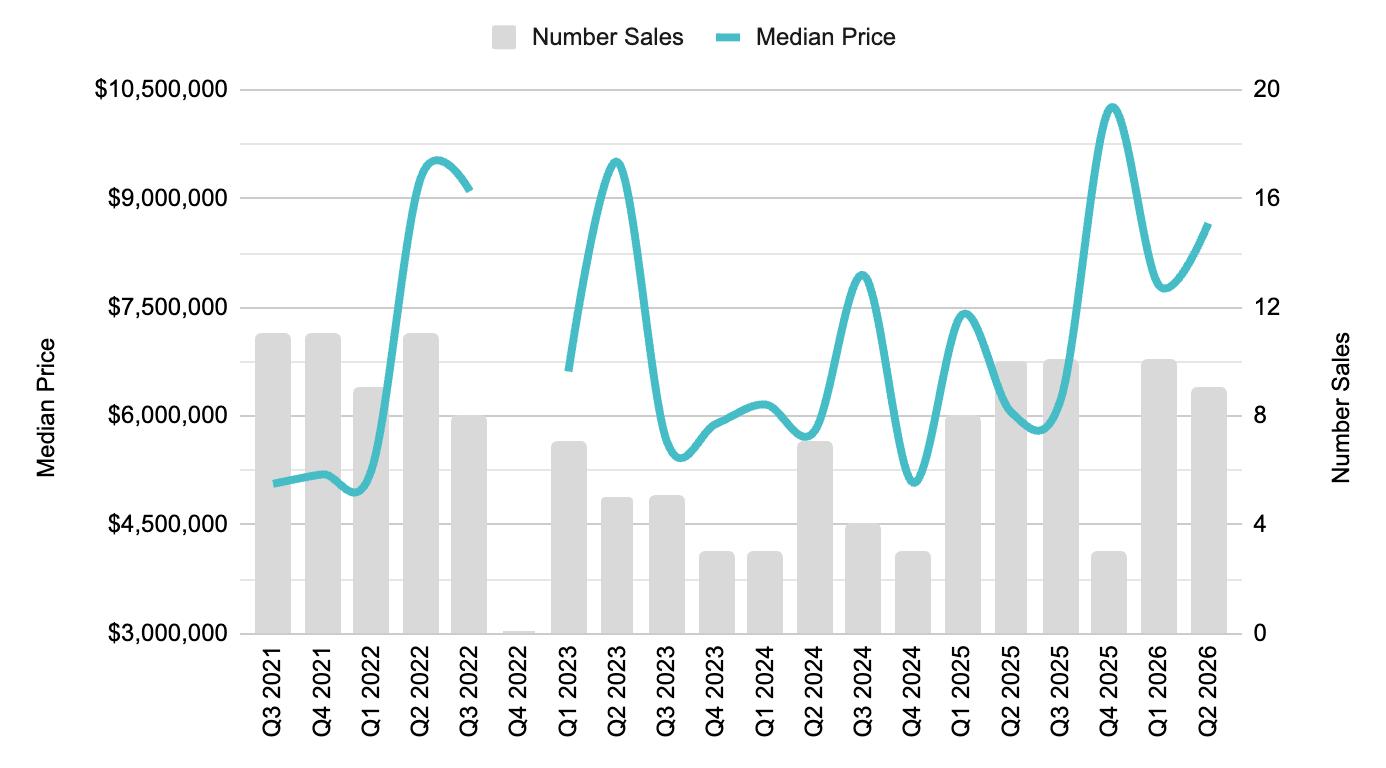
Month-to-month and quarter-to-quarter comparisons in Hope Ranch are typically difficult as there are so few transactions to analyze, which creates “skew” in key metrics. That said, Hope Ranch continued its strong 2026 with 9 sales in Q2 at a Median Price of $8.66MM, up 43% from Q2 2025 ($6.05MM) and up 11% from Q1. The headline transaction was 4160 La Ladera Road ($16.7MM), followed by 4260 Cresta Ave ($9.98MM), 1486 Cantera Avenue ($9.15MM), 4654 Via Bendita ($8.5MM), and 4450 Via Alegre ($8.38MM).
Goleta
There were 100 sales in Goleta this quarter, down 10% yearover-year (111 in Q2 2025) but up from 90 in Q1. Median Price of $1.53MM was down 1% compared to Q2 2025 and up 11% from last quarter. Its market share eased to 25% this quarter after running at 28% for the prior three quarters. Echoing last quarter, the Foothills once again produced the top results: 930 San Antonio Creek Road ($5.77MM), 4586 Serenity Lane ($5.5MM), and 1367 Via Veneto ($5.45MM)— all closing in May—along with 4701 Via Los Santos ($4.35MM) and 4594 Camino Molinero ($4MM).
Goleta
7561 PADOVA DRIVE • click to view
JUNE 2026

Santa Ynez Valley Review in Numbers
SANTA YNEZ VALLEY
JUNE 2026 YTD
TOTAL SALES
94 (-4% over 2025)
SINGLE FAMILY RESIDENCE SALES
83 (+1% over 2025)
CONDOMINIUM SALES
11 (-31% over 2025)
S ingle Family
SANTA YNEZ VALLEY
JUNE 2026 YTD
AVERAGE SALES PRICE • YTD
$1,948,637 -16% change from 2025
MEDIAN SALES PRICE • YTD
$1,625,000 -13% change from 2025


SANTA YNEZ VALLEY JUNE 2026 YTD
AVERAGE SALES PRICE • YTD
$731,172 -10% change from 2025
MEDIAN SALES PRICE • YTD
$719,000 -1% change from 2025

Buellton, Solvang & Ballard

7
TOTAL SALES · YEAR TO DATE
27 AVERAGE SALES PRICE · YTD
$1,966,143 MEDIAN SALES PRICE · YTD $1,690,000 TOTAL SALES · YEAR TO DATE
SALES PRICE · YTD $682,000
SALES PRICE · YTD $680,000
19 AVERAGE SALES PRICE · YTD $1,041,719 MEDIAN SALES PRICE · YTD $939,000 TOTAL SALES · YEAR TO DATE
4
$817,225

Los Olivos & Santa Ynez
Santa Ynez
TOTAL SALES · YEAR TO DATE
31
YTD
AVERAGE SALES PRICE · YTD
$2,413,174
MEDIAN SALES PRICE · YTD
$1,791,500

SINGLE
TOTAL SALES · YEAR TO DATE
6
AVERAGE SALES PRICE · YTD $2,341,666
MEDIAN SALES PRICE · YTD $2,257,500
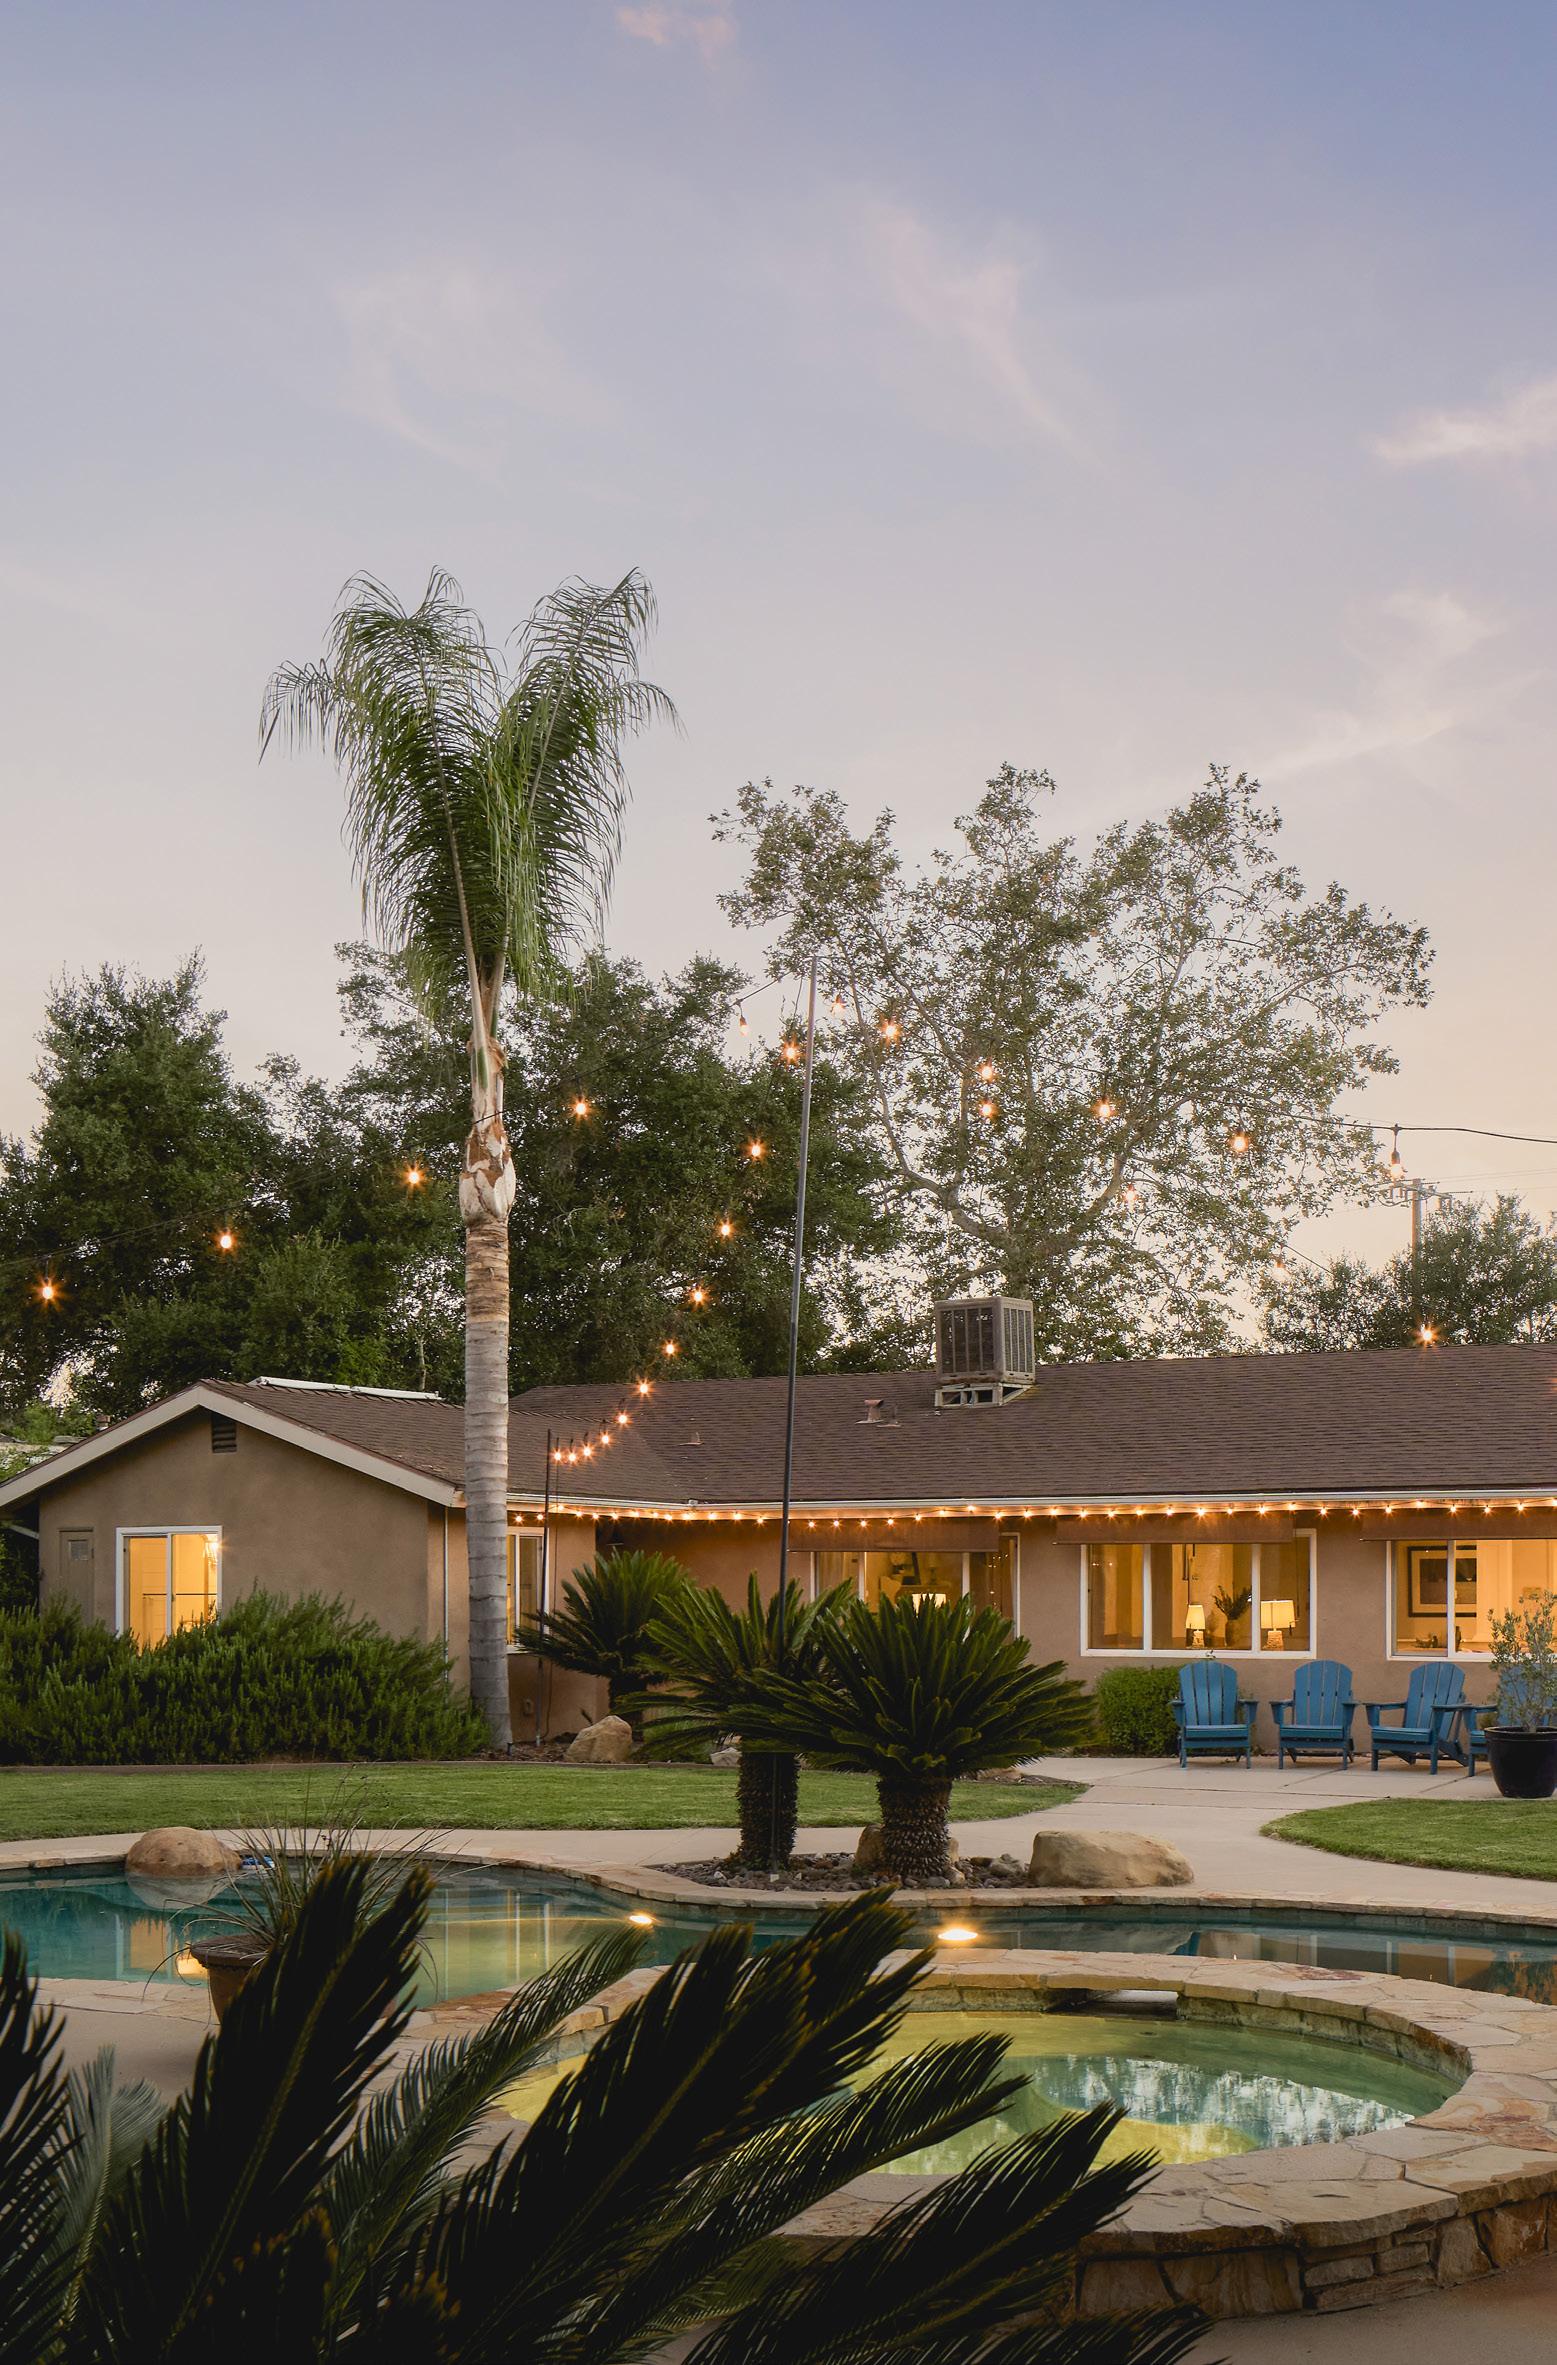
365 ENCINO DRIVE, OAK VIEW • click to view

Global Connections

“Our global partners ensure your home is seen by interested buyers across the world.”
RENEÉ GRUBB Founder & CEO

We are fortunate to be in a place that people all over the world desire to be. We cultivate strategic global relationships that ultimately benefit you by putting your home in front of those people.