Energy in Kaʻū is not an abstract policy issue It is the cost of keeping food cold, the ability to pump catchment water, the reliability of communications during a storm, the viability of a farm or small business, and the question of whether future generations can afford to remain in the district without giving up the land, culture, and rural way of life that define home.
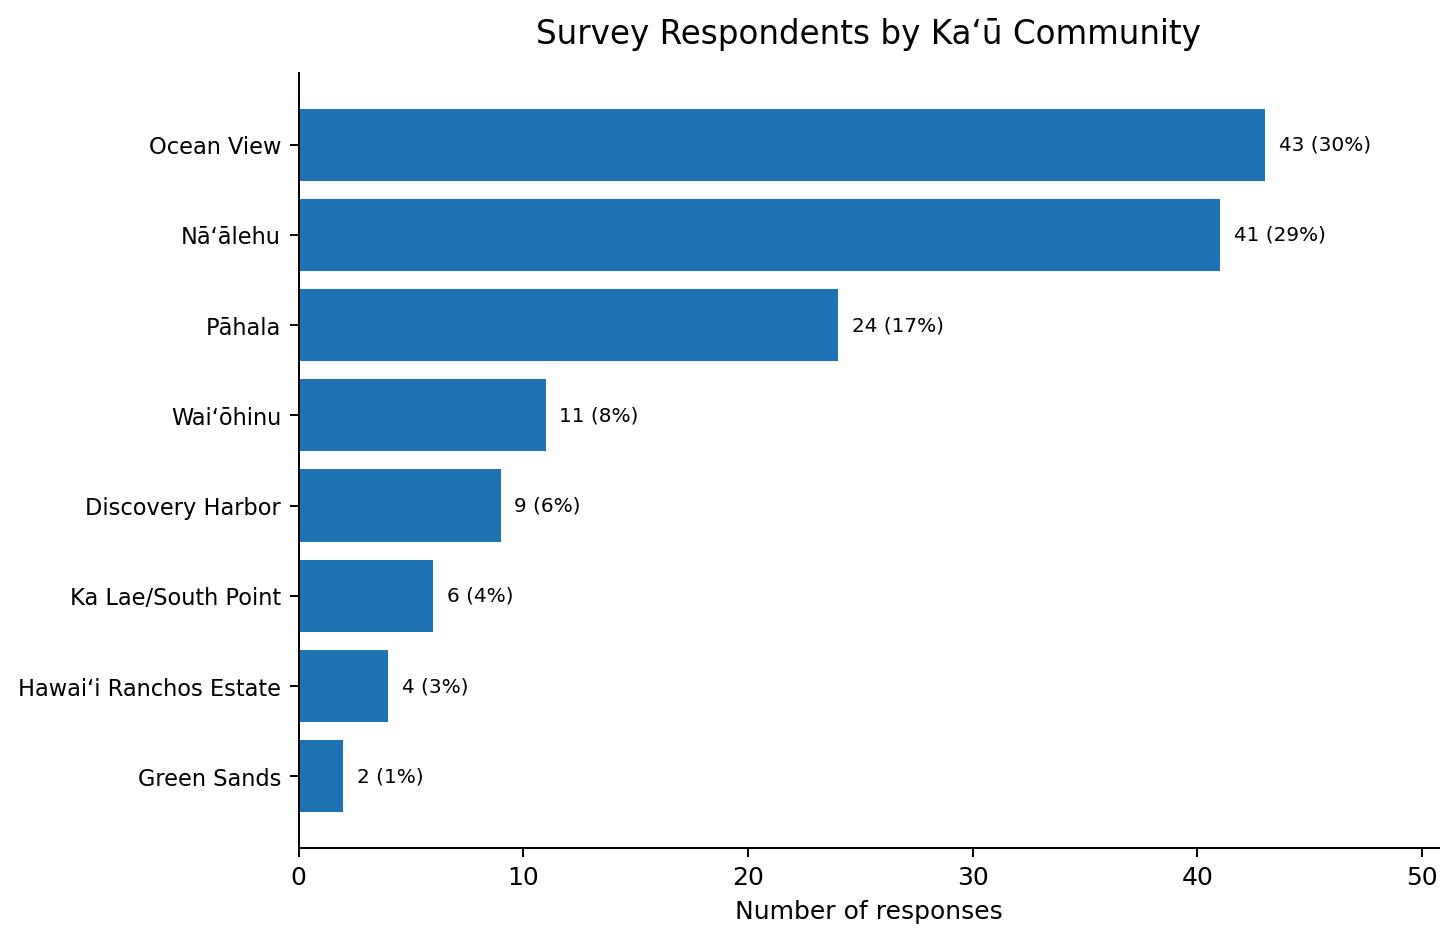
Between May and June 2026, the project received 141 completed survey submissions on renewable energy, household resilience, power outages, community participation, and long-term priorities. Of these, 140 identified one of eight Kaʻū communities; one did not answer the community question. The engagement was led by Kaʻū KōCreate Community Leaders through community events, food distribution outreach, direct resident conversations, and relationship-based survey collection
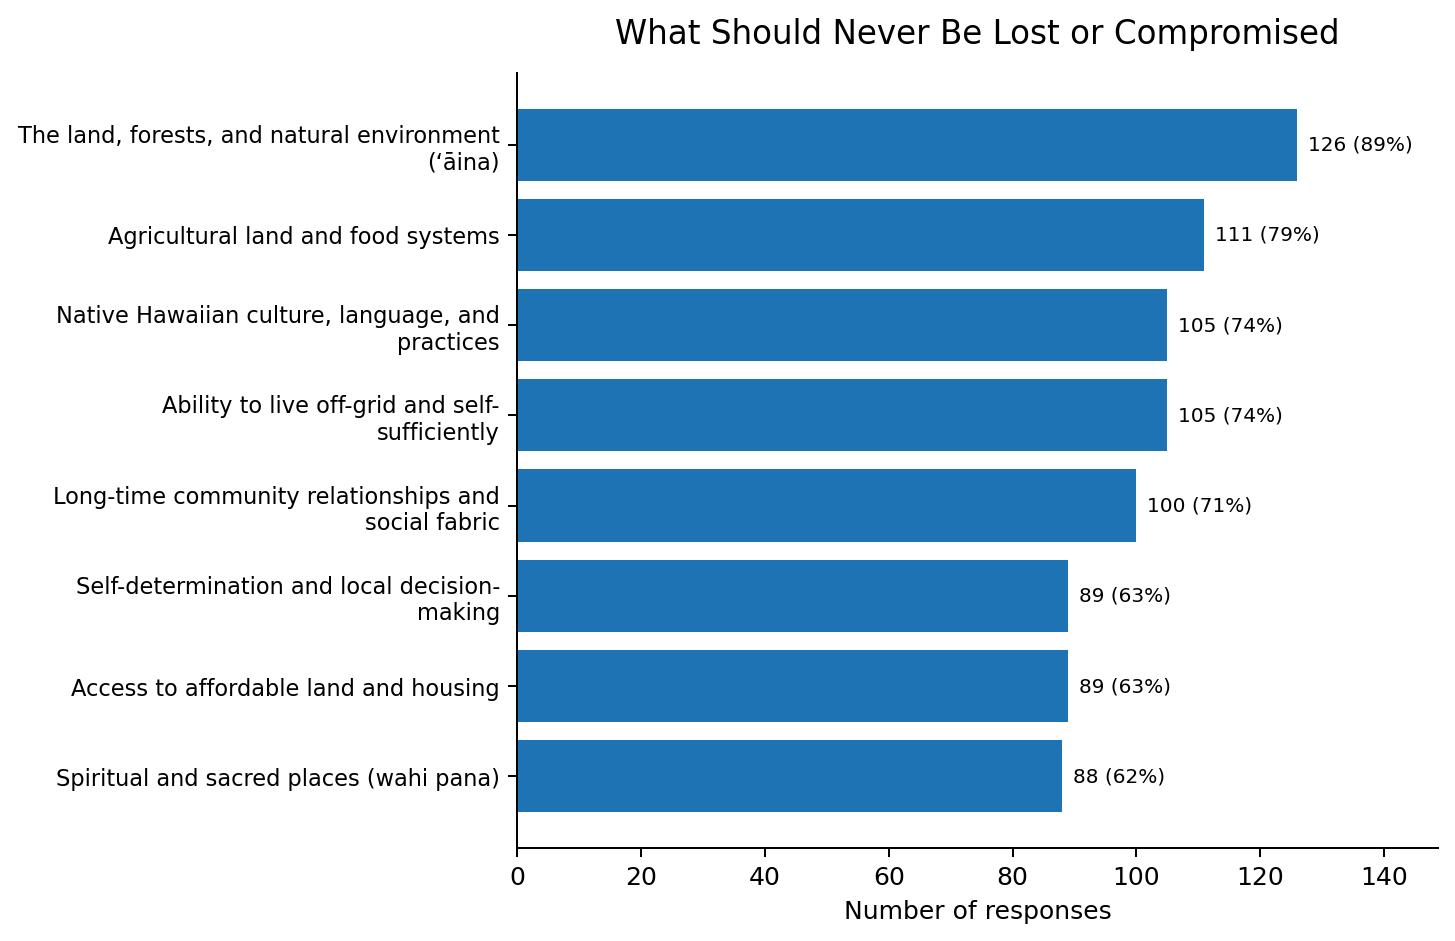
Protection of place is the clearest finding. Eighty-nine percent of participants said the land, forests, and natural environment should never be lost or compromised. Agricultural land and food systems followed at 79% Native Hawaiian culture and practices and the ability to live off-grid and self-sufficiently were each selected by 74%.
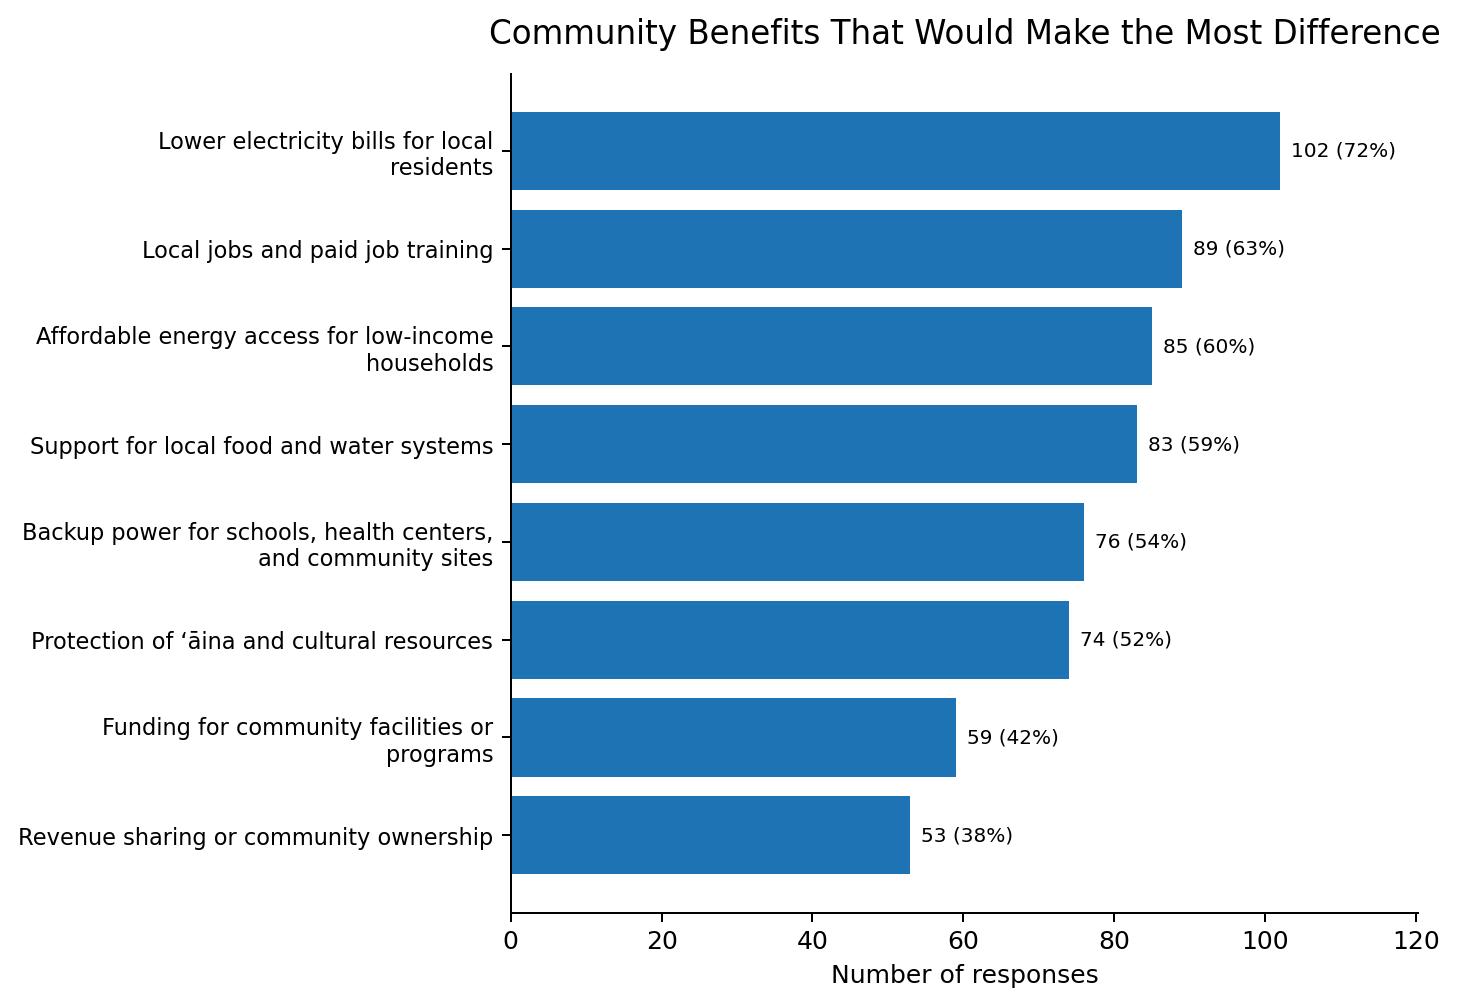
Affordability is the foundation of energy success. Seventy-seven percent said energy success means energy that is affordable for every household If a renewable energy project came to Kaʻū, 72% said lower electricity bills would make the most difference, 63% selected local jobs and paid training, and 60% selected affordable access for low-income households
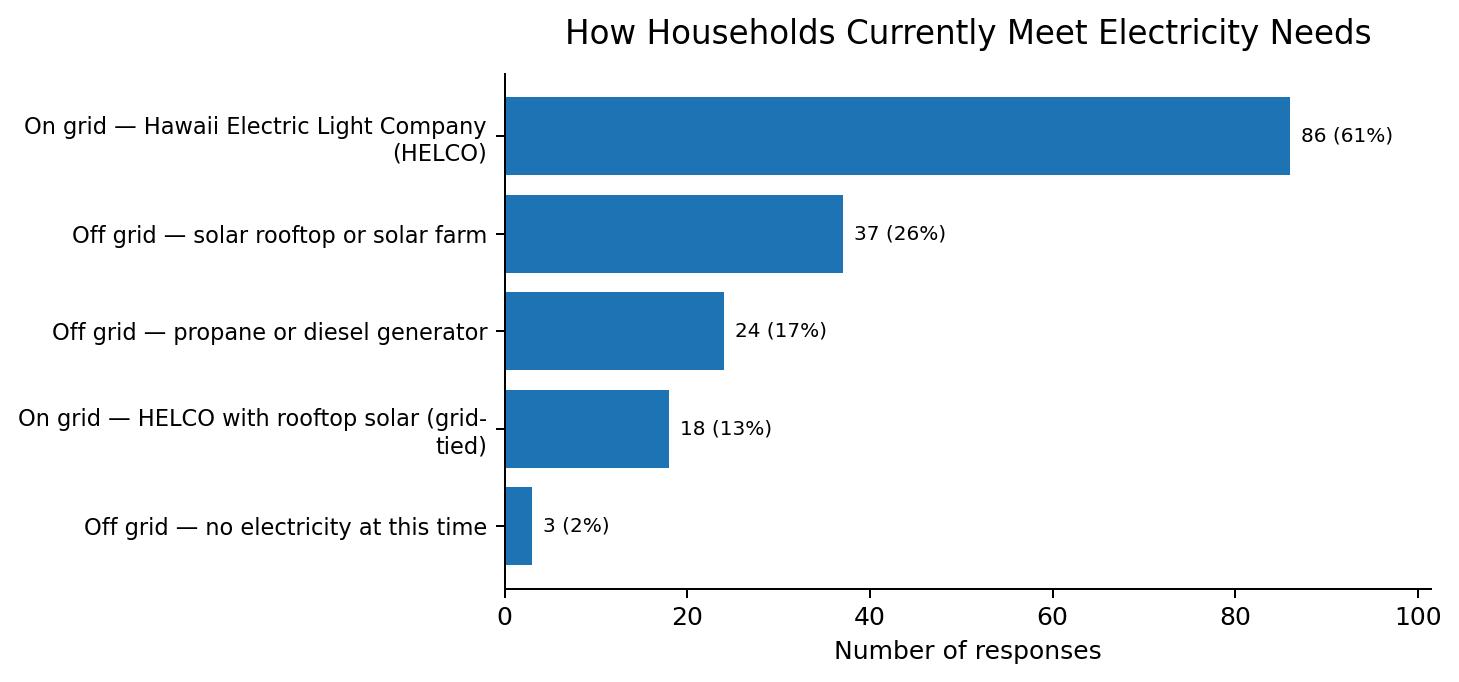
Off-grid living is part of Kaʻū’s existing energy system, not a hypothetical future. Of the 140 participants who answered the electricity-source question, 46 33% selected at least one explicit off-grid category Six selected both a grid-connected and an off-grid category. Among the 41 off-grid respondents who answered the follow-up questions, 30 reported four years or more of off-grid experience and 24 were very or extremely satisfied with their setup.
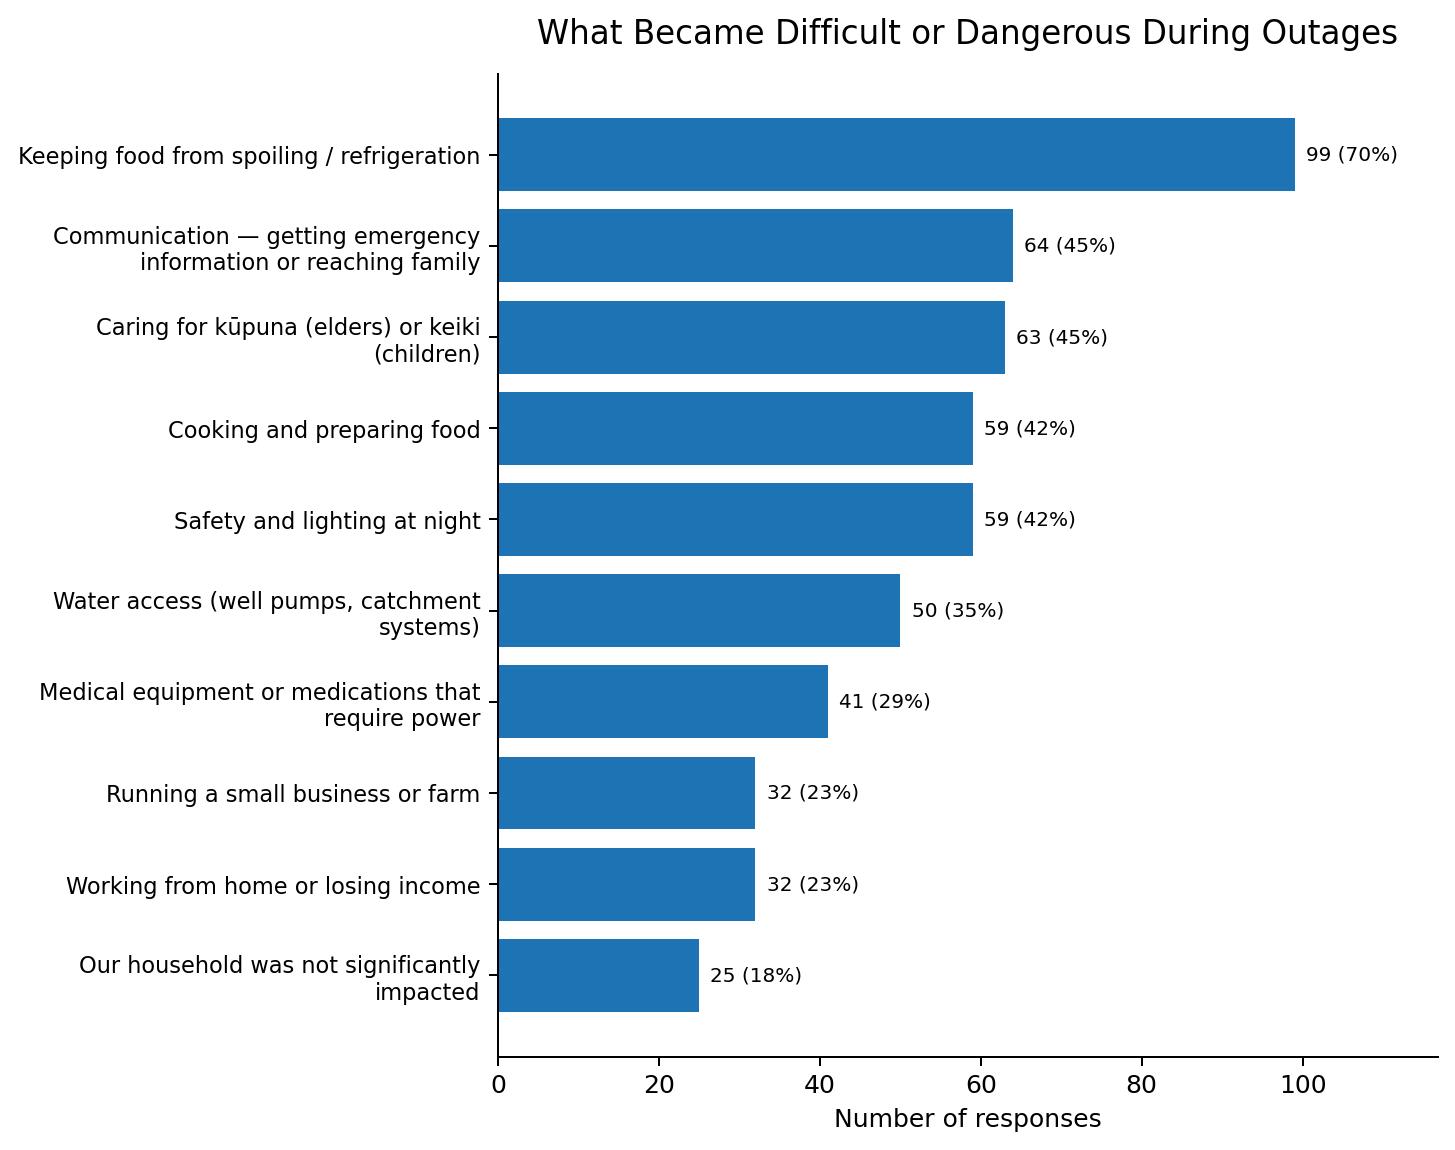
Power outages affect essential household functions. Seventy percent of all participants selected food spoilage or refrigeration as an outage impact Communication, care for kūpuna and keiki, cooking, lighting, water access, and medical needs were also widely reported. Of the 137 participants who rated household preparedness, 110 80% described their household as somewhat prepared or not prepared The community is open to participation, but information and trust are prerequisites. Of 133 participants who answered, 107 80% said yes or maybe to participating in energy planning Across the seven organization-familiarity items, the average share of valid responses marked “Not Familiar” was 74%. Of 134 participants answering the participation-history question, 113 84% selected only “None of the above,” and 53 of 128 41% did not know whether their priorities were represented
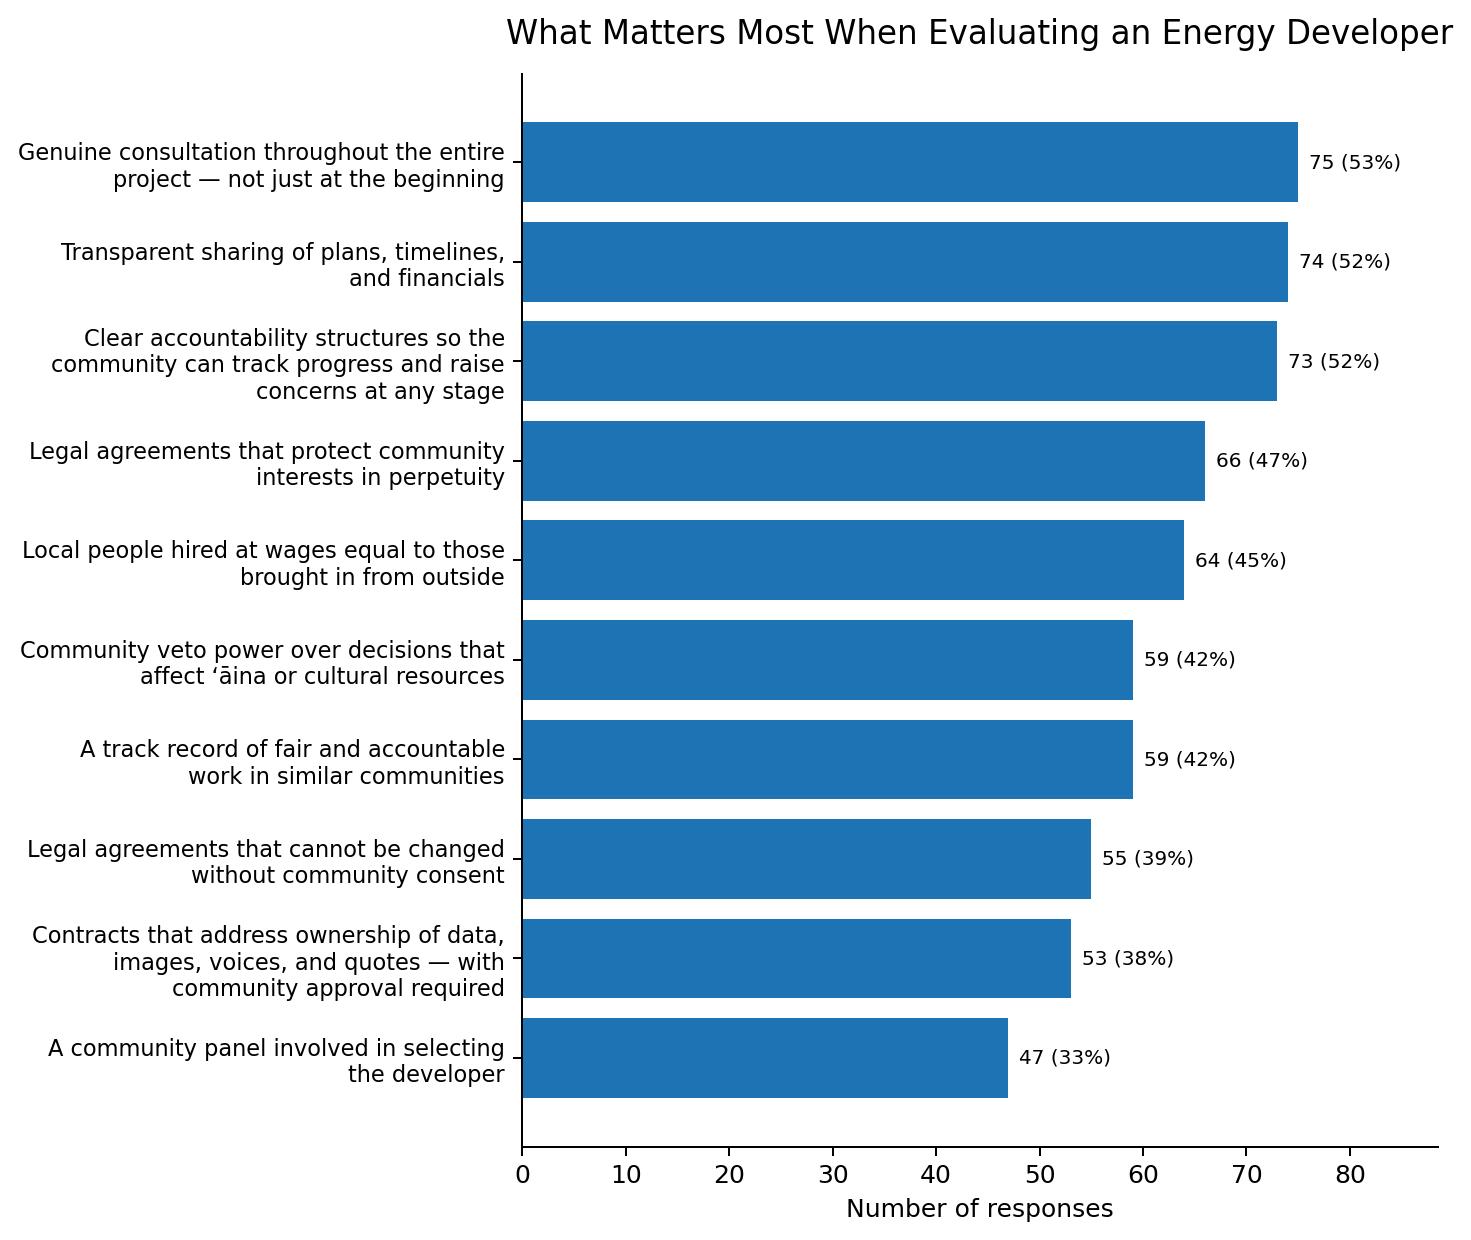
Participants selected enforceable community benefit rather than one-time consultation The strongest developer criteria were consultation throughout the project, transparent plans and finances, clear accountability, lasting legal protections, and equitable local hiring Concerns centered on loss of agricultural land, environmental harm, outside control, inadequate community input, impacts to sacred places, and projects that primarily benefit investors.
Survey participants are not asking only what technology should be built. Their responses describe the kind of future energy development should support: one where families can stay, food and water systems are stronger, the ʻāina is protected, local people have decision-making power, and the community can function when the grid goes down
How to Use This Report
This report should be used before a project, proposal, or formal consultation is designed It provides a community-informed starting point for energy education, resilience investment, outreach planning, infrastructure decisions, and the development of Community Benefits Agreements.
The findings should also be shared back with Kaʻū residents. Community members contributed their time, experience, and ideas with the expectation that their input would inform decisions The report therefore serves both as a planning resource for agencies and developers and as a public record of what participants said matters
Survey findings are reported in aggregate Percentages for multi-select questions are calculated against all 141 submissions unless otherwise noted; percentages for single-select questions use the valid-response denominator shown in the table Missing responses remain missing and are not treated as negative answers Open-ended responses are summarized thematically, and selected verbatim excerpts are presented without identifying information
II. Introduction
About the Project
The engagement was part of the Energy Resilient Communities initiative conducted through UH Sea Grant with the Hawaiʻi State Energy Office Vibrant Hawaiʻi and KōCreate supported parallel place-based engagement in Puna and Kaʻū through June 2026.
The work was intended to move beyond a simple measure of support or opposition. The survey explored household conditions, preparedness, community values, energy information needs, participation preferences, and the terms under which energy development could provide meaningful local benefit. Our community engagement aimed to achieve the following:
● Listen to residents describe what climate resilience and energy security mean in daily life
● Document community values that should guide energy and land-use decisions.
● Identify practical information residents need to participate confidently.
● Gather community input that can inform a Community Benefits Agreement
About KōCreate
KōCreate is a Vibrant Hawaiʻi leadership program that trains and supports community members to lead place-based work. KōCreate Community Leaders build skills in communication, organizing, planning,
facilitation, resource mobilization, and relational leadership while working on issues that matter in their own communities.
For this project, Kaʻū KōCreate Community Leaders Kassie Shibuya and Uʻilani Kailiwai led or supported outreach in the district. Their local relationships and familiarity with community gathering spaces were central to participation.
About Vibrant Hawaiʻi
Vibrant Hawaiʻi is a community-based leadership organization that works across workforce and economic development, youth leadership, housing, community resilience, education, and health and well-being. Its approach centers the capacity of residents to identify local priorities, build relationships, and design solutions that reflect place.
For this engagement, Vibrant Hawaiʻi served as the organizational backbone, supported the KōCreate Community Leaders, hosted and maintained the survey system, coordinated project resources, and conducted a final review and data analysis for this report
How to Read This Report
The report follows the sequence of the engagement. It begins with methodology and participant information, then moves through community values and vision, existing energy conditions, outage and preparedness impacts, information and participation needs, Community Benefits Agreement priorities, and final recommendations
When the data shows a strong pattern, the report states it directly When responses were mixed or the number of answers was limited, the report says so. The purpose is not to claim that one survey represents every Kaʻū resident It is to present the collected perspectives faithfully and make the findings useful
III. Methodology
How Community Members Were Reached
Community engagement was conducted through structured public events, food distribution outreach, direct one-on-one conversations, and digital survey entry supported by community leaders. The largest concentrations of responses came from the OKK Community Market on May 5–6 and the Ocean View Community Food Distribution on May 20. Additional surveys were gathered through direct resident outreach and community conversations through June 9.
Survey submission timestamps do not always match the date of the original conversation. Some surveys were collected in person and entered into the system later For example, the 35 surveys associated with the May 20 Ocean View Food Distribution appear in the dataset with May 23 submission timestamps.
Two planned outreach dates, May 13 and May 17, were not conducted as intended because incentive cards were unavailable The team adjusted by concentrating on existing community events and relationship-based outreach.
5–6, 2026
May 13, 2026
May 17, 2026
May 20, 2026
May 7–June 9, 2026
Planned outreach not conducted
Planned outreach not conducted
Ocean View Community Food Distribution
Direct resident outreach and community conversations
How the Survey Was Developed
Incentive cards unavailable
Incentive cards unavailable
Responses entered May 23
Relationship-based collection
The Kaʻū instrument was part of a shared survey-development process for the parallel Puna and Kaʻū engagements and included 37 numbered questions across demographics, community values, current energy use, outages, preparedness, energy development, participation, and Vibrant Hawaiʻi indicators.
How Data Was Collected and Analyzed
The survey was hosted in JotForm and completed electronically, including entries made by community leaders after some in-person conversations. The final workbook contains 141 submissions and represents a nonprobability, convenience sample The workbook contained 141 unique submission IDs, and no exact duplicate response rows were identified after excluding the timestamp and submission ID. Because the instrument was anonymous, however, repeat participation by the same individual cannot be ruled out One respondent did not answer the community question, and other questions had additional skipped responses. Each table therefore identifies either the percentage of all 141 submissions or the valid-response denominator.
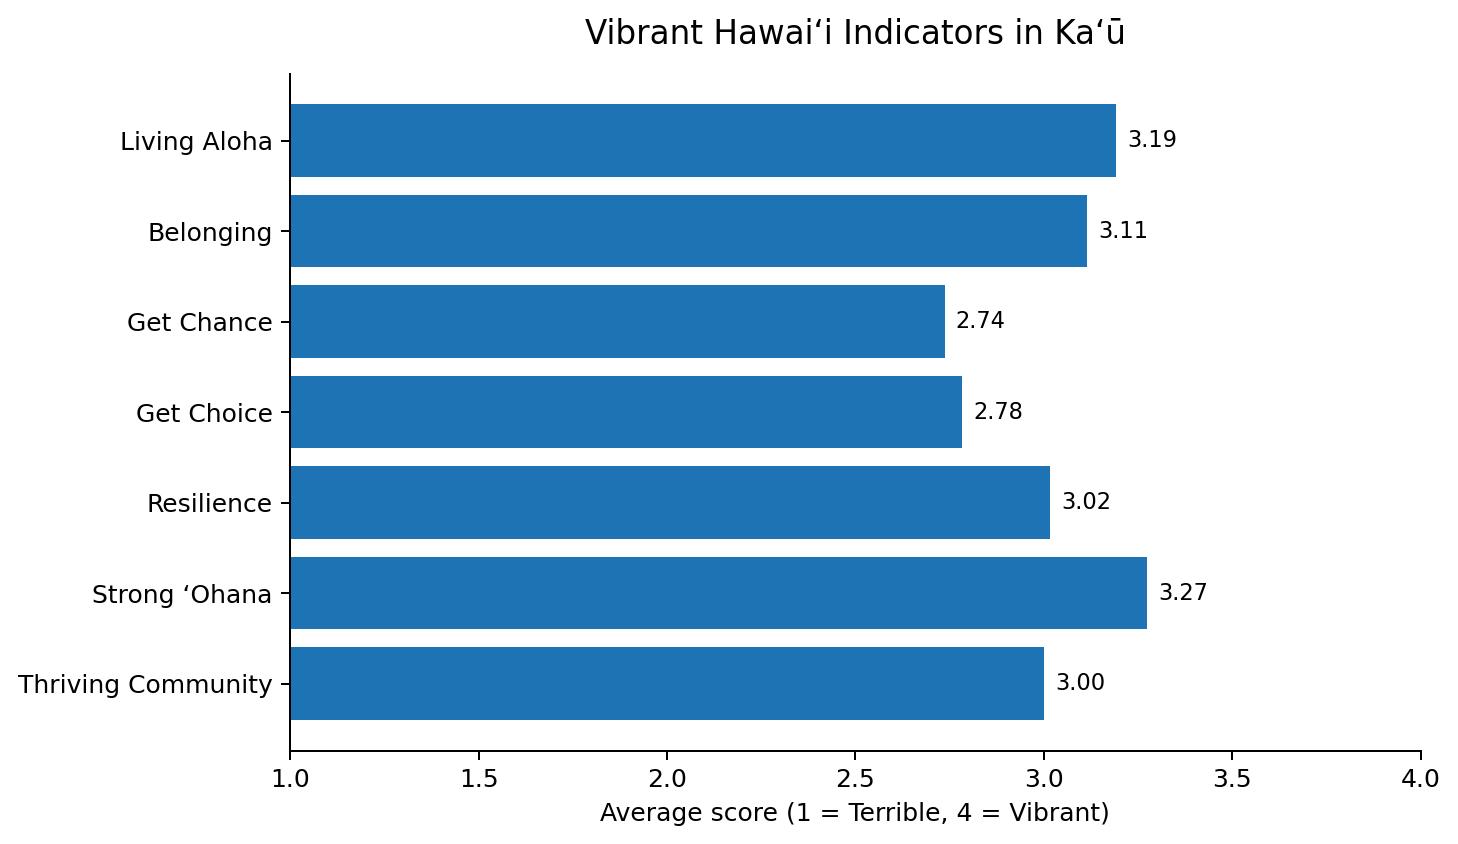
Multiple-choice questions were summarized by frequency and percentage. For “check all that apply” questions, each recorded selection was counted once, so percentages do not add to 100% The form did not consistently prevent respondents from selecting logically conflicting options; those raw combinations were retained rather than reinterpreted. The seven Vibrant Hawaiʻi indicators were scored on a four-point scale: Terrible = 1, Bad = 2, Good = 3, and Vibrant = 4.
Open-ended questions were reviewed for recurring themes The report describes recurring ideas without assigning precise prevalence unless a count is provided. Quotations and excerpted passages are reproduced verbatim from the workbook except that line breaks may be converted to spaces; spelling, capitalization, punctuation, and place-name variants are otherwise retained.
Research Integrity and Data Handling
All quantitative results in this version were recomputed directly from the 141-row survey workbook. Missing answers were not imputed. Write-in responses were not reassigned to predefined categories unless a rule is stated explicitly; no Q10 write-in was used to classify a respondent as off-grid
Some multi-select questions contained options that were conceptually exclusive, but the form permitted respondents to select them together. The report retains those raw selections and identifies consequential inconsistencies in the relevant table notes and Appendix D rather than deciding which answer the respondent intended.
How We Protected Participant Privacy
The survey was analyzed and reported in aggregate Contact information submitted by participants interested in a vegetation and road-clearing task force is not included in this report. No open-ended quotation is linked to a name, email address, household, or exact location
IV. Outreach & Engagement Best Practices
The Kaʻū engagement produced practical lessons about how to reach residents across a large rural district The strongest participation came from approaches that were relational, integrated into existing community activity, and supported by people already known in the community.
What Worked Well
Existing gathering spaces reduced the burden of participation. The OKK Community Market and Ocean View food distribution reached residents who were already present for practical, familiar reasons. Community members did not need to attend a separate energy meeting in order to be heard
Relationship-based outreach extended the geographic reach. Fifty-eight surveys 41% of the total came through direct outreach and community conversations rather than the two major events.
Talk-story created space for more than survey completion. Residents could ask what the project was for, explain why an option mattered, and connect energy to housing, farming, transportation, food, water, and family
In-person support made a long digital survey more accessible Community leaders could assist residents with data entry and procedural questions and provide a trusted point of contact.
Incentives helped participation, but logistics mattered. The cancellation of two planned dates because incentive cards were unavailable shows that incentive procurement should be completed before outreach begins.
Culturally and Geographically Grounded Strategies
The survey named Kaʻū communities directly and invited residents to describe what makes Kaʻū, Kaʻū This created room for place-based priorities mauka and makai access, hunting, fishing, ranching, agriculture, sacred places, intergenerational family ties, and off-grid living to shape the energy discussion
The outreach style was conversational rather than technical Given the low familiarity with formal energy organizations and the strong information needs documented in the survey, future engagement should begin with residents’ lived experience rather than with an agency, technology, or project
The district’s scale and dispersed population require multiple local entry points Ocean View and Nāʻālehu together accounted for 60% of the survey, while smaller communities were represented by fewer participants. Future work should plan dedicated outreach in communities that were less represented.
Lessons Learned
• Procure and track incentives before announcing outreach dates.
• Do not rely on submission timestamps as the sole record of field activity
• Use a short field log that records date, location, outreach lead, estimated contacts, completed surveys, and qualitative observations
• Retain a paper or assisted option for kūpuna and residents with limited internet or device access.
• Review every survey option for place-name consistency before launch.
• Explain clearly how results will be returned to community and used after collection.
• Build time for open-ended conversation; the most useful findings often emerged when residents explained why an answer mattered
Recommendations for Future Engagement
• Use community markets, food distributions, schools, churches, homestead gatherings, and existing community groups as primary outreach locations.
• Conduct dedicated sessions for kūpuna, youth, farmers and ranchers, off-grid households, low-income families, and Native Hawaiian multigenerational ʻohana.
• Provide a plain-language energy primer before asking residents to evaluate specific technologies or developers.
• Offer in-person talk story, paper materials, online information, recorded video, and surveys rather than using a single engagement format.
• Create a public feedback loop that shows what was heard, what changed, and what decisions remain open
• Separate education from project advocacy so residents can ask questions without feeling they are being recruited to support a predetermined proposal.
V. Engagement Activity Log
The following log reconciles the field record with the final dataset. The submission timeline shows two large clusters associated with event outreach and a series of smaller clusters associated with direct engagement and later data entry.
May 05, 2026
May 06, 2026
May 13, 2026
May 14, 2026
May 15, 2026
May 17, 2026
May 18, 2026
May 19, 2026
May 23, 2026
May 28, 2026
Jun
Jun 08, 2026
Jun 09, 2026
Submission dates should be interpreted as data-entry dates, not necessarily the dates on which every conversation occurred The activity log above is the more accurate source for outreach method and event attribution.
VI. Participant Data
The dataset contains 141 completed survey submissions. Of the 140 respondents who identified a community, responses came from eight Kaʻū communities. Ocean View and Nāʻālehu were the largest response groups, followed by Pāhala. Respondents also reported a wide range of tenure, ages, ethnic backgrounds, household sizes, and housing situations.
Years Lived in Kaʻū
Of the 140 participants who answered this question, 71 51% were born and raised in Kaʻū or had lived in the district for more than 20 years. The survey also reached 55 people who had lived in Kaʻū for ten years or less, providing both long-standing and newer-resident perspectives
Generation
Millennials were the largest generational group at 42%, followed by Gen X at 28%. Gen Z participants accounted for 13% Baby Boomers, the Silent Generation, and one Gen Alpha participant were also represented.
Ethnicity
Participants could select more than one ethnicity Forty-eight percent identified as White or Caucasian, 47% as Hawaiian or Part-Hawaiian, and 33% as Asian or Pacific Islander. The multi-select results reflect the multiracial character of many Kaʻū families and should not be interpreted as mutually exclusive groups
Participants could select more than one ethnicity; percentages do not add to 100%.
Household Size
Three in four respondents lived in households of two to six people Fifteen participants reported households of seven or more people, which is relevant when considering outage supplies, backup power capacity, and household energy costs
Housing Situation
Eighty respondents owned their home, 29 rented, and 19 lived with family without housing cost. One respondent identified as houseless or transitional Housing tenure affects the ability to invest in solar, batteries, efficiency upgrades, vegetation management, and structural resilience.
Vibrant Hawai
i Indicators
Participants rated seven community conditions on a four-point scale Strong ʻOhana received the highest average score at 3.27, followed by Living Aloha at 3.19 and Belonging at 3.11. Get Chance received the lowest average at 2 74, followed by Get Choice at 2 78 The pattern suggests that relational and cultural strengths are present while equitable access to opportunity and the ability to shape one’s future remain less secure.
Indicator Definition
VII. Community Context, Values, and Vision
This section reports how survey participants described place, culture, land, family continuity, and the district’s rural character. It is not intended to be a comprehensive history of Kaʻū. The survey asked what should never be lost and what future participants want for their children and grandchildren, placing energy within that broader community context.
The responses show a community that does not define progress solely through additional infrastructure or economic growth Many participants want better jobs, education, healthcare, transportation, stores, and services. At the same time, they want Kaʻū to remain country, retain open space and access to natural resources, protect cultural places, and avoid development that displaces local families or changes the district beyond recognition. Planning must hold both needs at once.
What Makes Kaʻū, Kaʻū?
Participants could select all values and conditions they believe should never be lost or compromised. Agreement was broad. Eight of the listed values were selected by more than 60% of all respondents.
Should Never Be Lost or Compromised
The strongest result protection of the ʻāina was reinforced by the high selection of agricultural land, cultural practices, off-grid living, long-time relationships, local decision-making, affordable land and housing, and sacred places. These are interconnected conditions. For many respondents, the ability to remain in Kaʻū depends on preserving both the physical landscape and the community systems that make life possible
Vision for Children and Grandchildren
A total of 125 participants answered the open-ended question about their vision for the future of Kaʻū The responses were diverse, but several themes repeated across communities and generations.
Keep Kaʻū country and protect access to the ʻāina. Many participants wrote that Kaʻū should remain rural, retain its natural beauty, and preserve access to forests, coastlines, hunting, fishing, farming, and gathering.
“KEEP KA'Ū, KA'Ū! Our aina and resources should be for all the Ohana that has been here for many generations.”
“For my grandchildren to live off the land like I am right now”
Build a self-sustaining community. Food production, off-grid living, catchment water, local energy, mutual aid, and an active ahupuaʻ a approach appeared repeatedly as a practical and cultural vision
“The vision is to create as self sustainable off-grid homestead as possible. Producing food for family and community.”
“To be self sustained, successful in mind and spirit, and have solid family values.”
Create opportunities that allow people to stay. Participants described a need for jobs close to home, strong schools, healthcare, affordable housing and land, small-business opportunities, and pathways for young people to build a life without leaving the district
“My vision for Kaʻū is a future where our keiki and mo ʻ opuna can stay rooted in the land, find good work close to home, and still live the local lifestyle we cherish.”
Maintain safety, ʻohana, and community connection. Respondents wanted a place where neighbors care for one another, kūpuna and keiki are safe, families can remain together, and knowledge is passed between generations
“To have a tight strong community that can rely on each other and fulfill everyone's needs”
Preserve culture and local decision-making. Several responses specifically called for Hawaiian culture, language, history, sacred places, and the authority of long-time Kaʻū families to guide the district’s future
“Our Kanaka here should have a voice, always. And we should be listened to and respected.”
How Renewable Energy Can Support That Future
A total of 117 participants explained in their own words how renewable energy could support the future they described Common themes included affordability, self-sufficiency, protection of the land, and support for local agriculture and jobs.
Lower household costs. Many responses framed renewable energy first as a way to reduce electricity bills and the broader cost of living
“Having Alternative energy would make life so much more financially stable Electric is so expensive”
Increase household and community independence. Participants described solar, wind, batteries, and other local systems as ways to reduce dependence on imported fuel and the grid
“To keep Kaʻū self-sustained, energy must be treated like water: captured locally, respected, and used to nourish the immediate community first.”
Support farms, food systems, and essential infrastructure. Respondents mentioned powering farms, water transmission pumps, schools, community facilities, and off-grid homes.
“Renewable energy can support a thriving, self-sufficient future for Kaʻū by driving down the region’s historically high electricity costs, increasing grid resilience against extreme weather, and supporting local agricultural operations.”
Protect the ʻāina and reduce pollution. Many respondents supported renewable energy only if it is designed without damaging land, water, culture, views, or established homes
“It can help generate energy the community needs without relying on imported resources. But it needs to be done in a way that it doesn't harm the aina or the people.”
Provide information before asking for support A significant number of respondents said they were unsure or needed to know which technologies were being considered. In Q24, 67 of 129 valid respondents 52% selected “I don’t know enough to make an informed decision.” Because Q24 incorrectly referred to Puna, this result should be read as evidence of uncertainty and a need for information, not as a definitive Kaʻū technology preference.
“I have more questions about the type and availability of said energy before I can honestly answer that.”
What Energy Success Looks Like
Q19 asked participants to select all definitions of energy success Two predefined options retained “Puna” in their wording. The table preserves those labels exactly and does not merge the Kaʻū-correcting write-in into the predefined counts
that creates local jobs and keeps money in Puna [survey wording]
decisions made by and for Puna not outside companies [survey wording]
Note: Three additional write-ins were recorded: one endorsed Kaʻū-based decision-making while correcting the Puna wording; one requested more solar companies installing good systems; and one only flagged that the question referred to Puna These write-ins were not added to the predefined counts
Affordability was the leading definition of energy success, followed by resilience during grid outages and protection of ʻāina The two options containing Puna language should be used cautiously in Kaʻū-specific policy interpretation.
What This Means for Planning
For Kaʻū, a technically renewable project is not automatically a community-supported project. The findings indicate that energy planning must be evaluated against a broader set of conditions: whether it protects agricultural and cultural resources, improves household affordability, strengthens food and water systems, expands local opportunity, respects the district’s rural character, and leaves residents with meaningful authority
The central tension is not preservation versus progress Residents described a form of progress that preserves what matters while improving what is missing. That distinction should guide project design, public engagement, and investment
VIII. Current Energy Conditions, Costs, and Health Concerns
Kaʻū respondents reported a mix of grid-connected service, grid-tied rooftop solar, off-grid solar, generators, and small wind systems. The survey documents a material off-grid constituency; it did not collect enough information to determine how energy arrangements vary by income, location, or access to capital.
How Households Currently Meet Electricity Needs
Of 140 respondents, 86 selected HELCO grid service and 18 selected grid service with rooftop solar Forty-six respondents selected at least one explicit off-grid category: off-grid solar, propane or diesel generation, or no electricity at the time of the survey Six respondents selected both a grid-connected and an off-grid category Two additional grid-connected respondents wrote in a backup generator or wind generator; those write-ins were not recoded as off-grid
Note: Q10 categories were multi-select Forty-six of 140 respondents selected at least one explicit off-grid category; six selected both grid and off-grid Two grid-connected respondents wrote in a backup generator or wind generator; those write-ins were not recoded as off-grid.
Off-Grid Experience
Forty-one of the 46 respondents who selected an explicit off-grid category answered the follow-up questions Thirty unique respondents 73% of those 41 selected at least one duration category of four years or more. No respondent selected “not at all satisfied”; 24 were very or extremely satisfied, 14 were somewhat satisfied, and three were slightly satisfied.
Note: Forty-one respondents answered Q10a Two selected two duration categories, producing 43 category selections Thirty unique respondents selected at least one category of four years or more
Average Monthly Electricity Cost
The most common reported monthly cost was $150–$250. Twenty-nine respondents reported $50 or less, and 37 reported $250 or more, including nine at $450 or more. Fifteen did not know their monthly cost. The question did not distinguish a utility bill from total household energy costs such as generator fuel, propane, batteries, maintenance, or equipment replacement.
Knowledge of Electricity Usage
Sixty-four percent of those answering the question did not know their monthly electricity use in kilowatt-hours The survey does not establish why For future education and consultation, presenting information in both household-dollar impacts and kilowatt-hours would make technical information more accessible
Concern About Electric Bill Cost
Among 138 respondents, 72 52% were somewhat, very, or extremely concerned about their electric bill, while 38 were not at all concerned The survey did not ask why respondents selected a particular concern level, so the result should not be attributed to grid or off-grid status without further analysis.
Steps Already Taken to Reduce Electricity Use
Participants reported a wide range of efficiency and conservation actions. Energy-efficient lighting was the most common, followed by using fans instead of air conditioning, taking shorter showers, and purchasing Energy Star appliances. Write-in responses described solar panels, propane appliances, small refrigerators, and fully off-grid systems
Concern About Environmental and Health Impacts
Among 139 respondents, 94 68% were somewhat, very, or extremely concerned about the environmental and health impacts of current electricity production Nineteen did not know The data shows that energy is viewed as both a cost issue and a land, water, wildlife, and health issue.
Concern About Environmental and Health Impacts
Concern About Environmental and Health Impacts
IX. Power Outages, Preparedness, and Neighborhood Resilience
The survey asked residents to describe outage impacts, household preparedness, likely causes of outages, barriers to vegetation maintenance, and community-led actions they would support. The results connect grid reliability to food, water, communications, health, income, and care responsibilities.
What Became Difficult or Dangerous During Outages
Food spoilage was the most common impact, selected by 70% of all participants Communication and care for kūpuna or keiki were each selected by 45%. Cooking, lighting, water access, medical equipment, home-based income, farms, and small businesses were also affected
Note: Ten respondents selected “Our household was not significantly impacted” together with at least one specific outage impact Counts are retained as recorded
How Prepared Households Feel
Nineteen households described themselves as not prepared and 91 as somewhat prepared. Together, 110 respondents 80% of those answering the question were below “well prepared ” Only 27 described their household as well prepared.
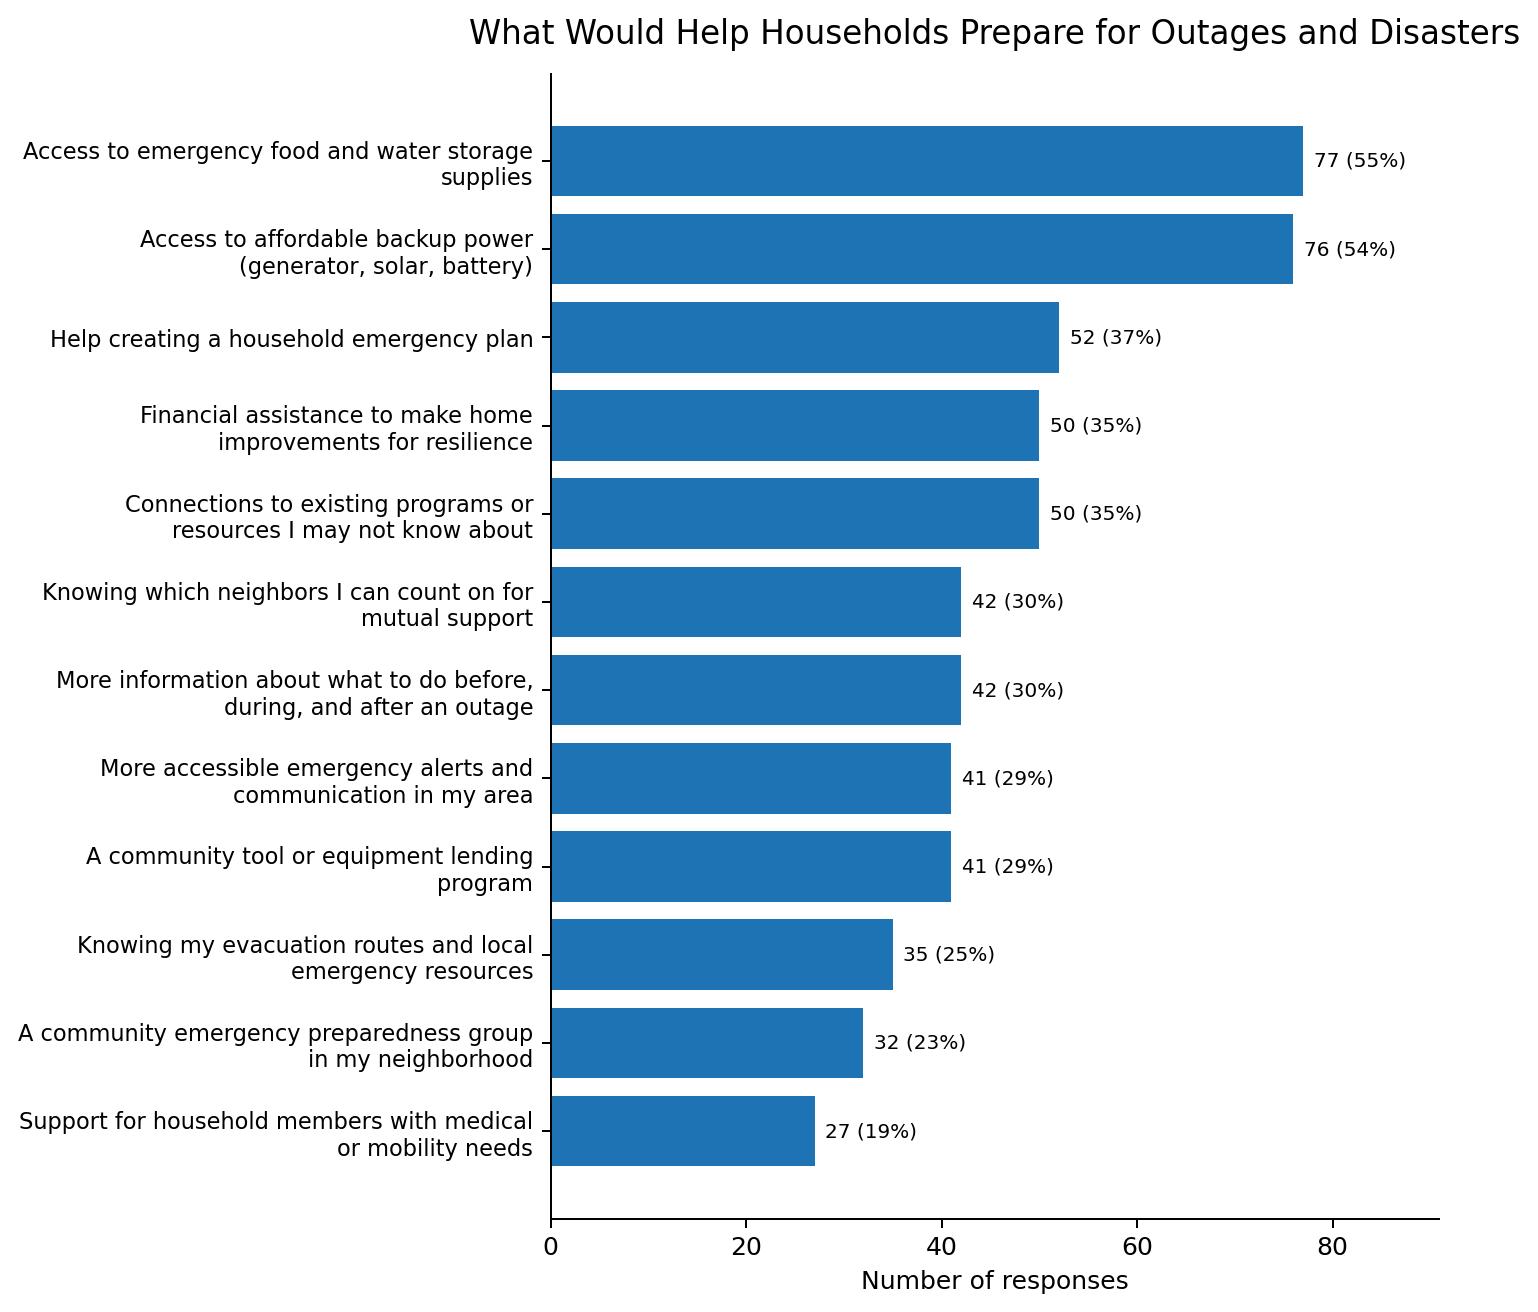
What Would Help Households Prepare
The two strongest needs were emergency food and water supplies and affordable backup power. Planning assistance, financial support for home improvements, connections to existing resources, mutual-support networks, alerts, equipment lending, evacuation information, neighborhood groups, and support for medical or mobility needs were also widely selected.
I feel well prepared at this
Note: Eight of the 21 respondents who selected “I feel well prepared at this time” also selected at least one preparedness need Counts are retained as recorded
Common Causes of Outages
Storm or high-wind damage was selected by 79% of participants, trees or branches by 67%, and vehicle accidents involving utility poles by 52%. Equipment failures and overgrown vegetation were selected less often but remain significant because they may be addressed through maintenance, planning, and local response capacity
Why Hazardous Vegetation May Not Be Addressed
Participants generally described vegetation problems as a capacity and systems issue rather than simply an individual failure. The most common explanations were physical limitations among kūpuna, inability to afford tree work, absentee ownership, unclear ownership, personal or health challenges, lack of awareness, and no clear reporting process.
They are kūpuna (elderly) or have physical limitations
They can't afford the cost of tree trimming or removal
They live off-island or are absent for extended periods
property is abandoned or ownership is
are dealing with health, family, or personal challenges
They don't know their vegetation is a problem
Other write-in responses
Note: Four write-in responses were recorded They are grouped rather than presented as comparable predefined categories
Community-Led Actions Residents Would Support
The most common willingness was checking on kūpuna or vulnerable neighbors after storms Tool sharing, vegetation work days, neighbor-to-neighbor assistance, identifying hazardous properties, mutual aid networks, community funds, and advocacy also received support. Forty-one respondents were interested but wanted more information first Community-Led Action
Vegetation and Road-Clearing Task Force
Twenty-six participants provided unique email addresses in response to the task-force item However, the item referred to “a trained, verified team of Puna residents,” not Kaʻū residents, and it did not provide a yes/no response option. The 26 submissions therefore demonstrate that some respondents were willing to provide contact information, but they are not a valid estimate of support for a Kaʻū task force
Any task force model should include training standards, safety protocols, insurance and liability review, coordination with utilities and government agencies, clear activation authority, equipment access, and safeguards against informal work near energized lines
X.
Community Energy
Information, Participation, and Representation
The survey shows a substantial gap between community interest and access to usable information. Many residents are open to participating but do not know the organizations, processes, technology options, or current proposals well enough to engage confidently.
Information Needed to Make Energy Decisions
Sixty-six participants selected “all of the above” when asked what they needed to know, and 69 specifically selected information about solar, wind, and other renewable options. Grid operations, batteries, community energy systems, costs, rights, water and agriculture, current proposals, energy justice, and participation processes were all selected by at least one quarter of respondents
Familiarity With Energy Organizations
Across the seven organizations listed, an average of 74% of valid responses were “Not Familiar.” The Hawaiʻi State Energy Office, Mayor’s Energy Task Force, Public Utilities Commission, and Department of Consumer Advocacy were unfamiliar to approximately three quarters or more of respondents answering each item.
Prior Participation in Energy Activities
Of the 134 people who answered, 114 selected “None of the above”; one of those respondents also selected attendance at a public hearing Accordingly, 113 84% selected only “None of the above ” Ten selected a public hearing, ten a HELCO meeting, seven a public comment, and five a letter to HELCO, the Public Utilities Commission, or a government representative
Written a letter to HELCO, the Public Utilities Commission (PUC), or a government representative 5
Attended a meeting organized by the Hawaiʻi Clean Energy Initiative, Sustainable Energy Hawaiʻi, or the Mayor's Energy Task Force
Heavily involved in appropriate technology projects
Note: One respondent selected both “None of the above” and “Attended a public hearing about energy ” The narrative therefore reports 113 respondents who selected only “None of the above ”
Satisfaction With Prior Participation
Twenty-four respondents entered a satisfaction rating other than N/A. Nine of those 24 also selected “None of the above” in the preceding participation question, including one person who selected both a public hearing and “None of the above ” Only 15 ratings can therefore be linked unambiguously to a listed activity The satisfaction distribution is reported descriptively but should not be used as a reliable estimate of participant experience
Note: Nine of the 24 substantive satisfaction ratings came from respondents who also selected “None of the above” in Q32 The distribution is descriptive only and is not a valid estimate of satisfaction with prior participation
How Well Residents Feel Represented
Among 128 respondents, 53 did not know whether their priorities were represented Another 47 felt not represented at all or only slightly represented. Only five selected mostly or fully represented.
Interest in Participating in Energy Planning
Of 133 respondents, 107 80% said yes or maybe The “maybe” group was the largest at 81 people Because the response option itself stated “I’d like to learn more first,” the result directly supports providing information before asking residents to commit to participation
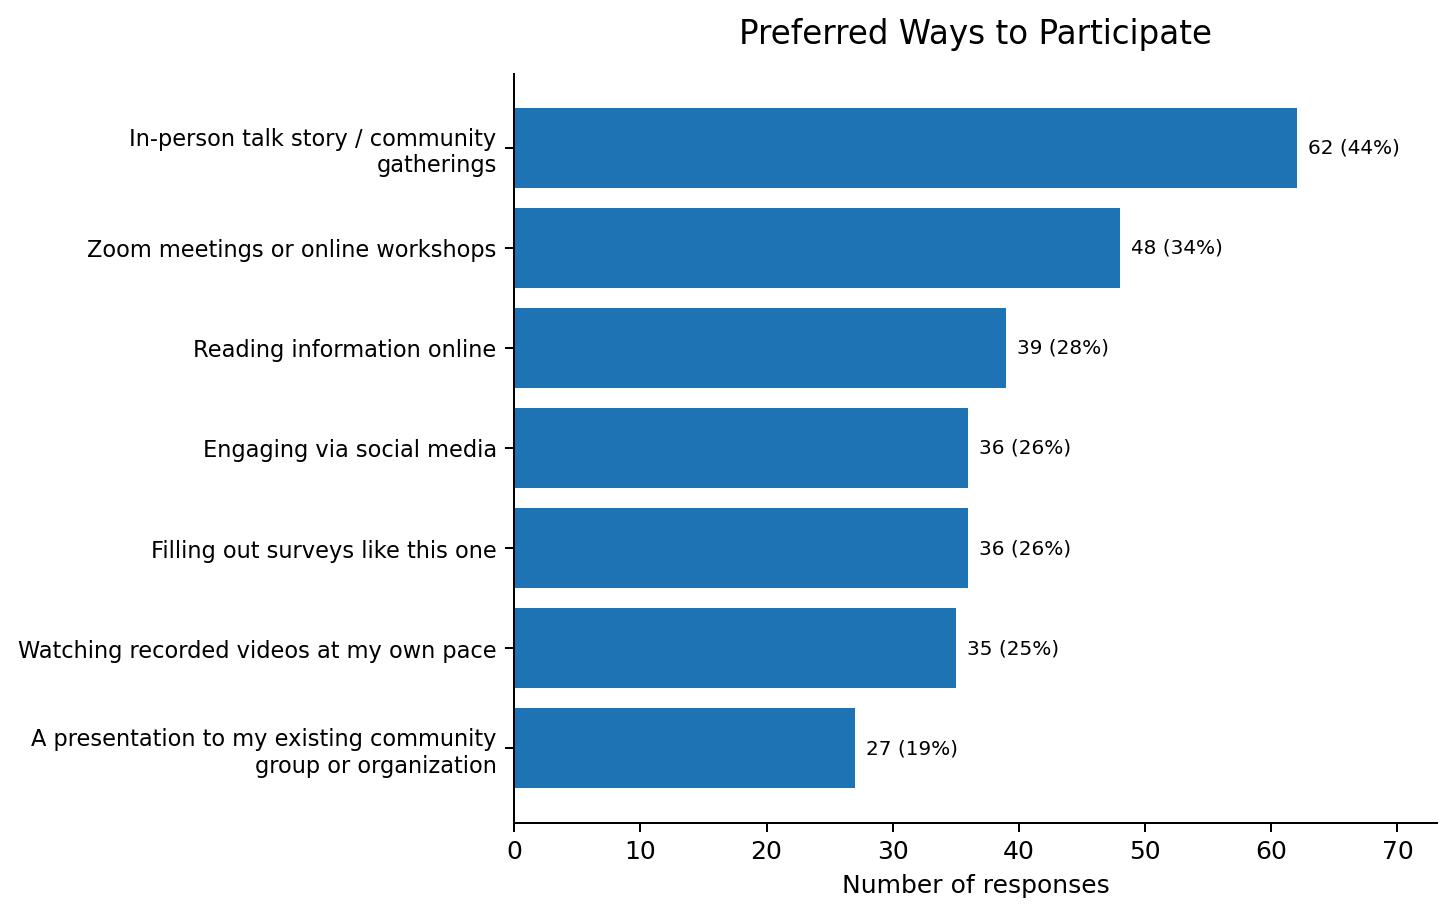
Preferred Ways to Participate
In-person talk story and community gatherings were the top participation method, selected by 44% of all respondents Zoom or online workshops were second The remaining preferences were distributed across online reading, social media, surveys, recorded videos, and presentations to existing groups. A multi-channel strategy is therefore more appropriate than a single meeting format
Whose Voices Residents Fear Will Be Missed
Eighty-three participants answered this open-ended question. Kūpuna and elders were repeatedly named. Participants also named local residents and multigenerational families, keiki and youth, low-income residents, people with disabilities, residents without reliable internet or digital skills, farmers, off-grid households, and Native Hawaiian families.
“Those who do not have access to complete surveys online - or know about them. Those who do not have access to phones/laptops and WiFi.”
“The long time rooted native Hawaiian ‘ohana”
“Kupuna who don’t possibly get out of their home so they’re not up to date with programs like this.”
These responses support supplementing digital notices, formal public hearings, and central meetings with targeted, relationship-based outreach to the groups participants identified
XI. Data to Inform a Community Benefits Agreement
The survey asked participants what energy development feels appropriate, what opportunities and concerns they see, what benefits would matter, and what standards should be used to evaluate a developer. Together, these questions provide a community-informed starting point for a Community Benefits Agreement.
What Kinds of Energy Development Feel Right
Q24 incorrectly asked what kinds of energy development feel right for Puna Among the 129 participants who answered that item, 67 52% of valid respondents, or 48% of all participants selected “I don’t know enough to make an informed decision ” Community-owned solar was the most selected specific option, followed by wind, battery storage and microgrids, ocean or wave energy, biofuel, and energy cooperatives. Geothermal was selected by 13 participants Because of the place-name error, these results are exploratory and should not be treated as a clean measure of Kaʻū technology preference.
Energy Development Type
I don't know enough to make an
of the above feel right for
write-in responses or place-name comments
Caution: Q24 named Puna rather than Kaʻū The response labels are preserved verbatim, and the results should be treated as exploratory “Other write-in responses or place-name comments” includes three place-name/eligibility comments, one “NOT GEOTHERMAL,” one “Need help in Ka’u,” and one “I don’t know ”
Opportunities Residents See
Lower and more stable electricity costs were the leading opportunity, followed by local jobs and economic opportunity and support for food and water systems Local control, reduced fossil-fuel harm, reliability and
resilience, and community ownership were also widely selected Twenty respondents did not see significant opportunities at this time.
I don't see significant opportunities at
Primary Concerns About Energy Development
The leading concern was harm to or removal of agricultural land. Environmental harm, outside control, inadequate community input, disturbance of sacred places, investor-first projects, and displacement of long-time families were each selected by nearly half or more of all participants.
Community Benefits That Would Make the Most Difference
Lower bills were the leading benefit at 72%. Local jobs and paid training, affordable access for low-income households, support for food and water, backup power for essential community sites, and protection of ʻāina and culture all exceeded 50% of participants
What Matters When Evaluating a Developer
Residents placed the strongest emphasis on process and enforceability. Consultation throughout the entire project, transparent plans and finances, and clear accountability were the top three criteria Long-term legal protection, fair local hiring, community authority over impacts to ʻāina and cultural resources, and a proven track record followed closely.
Community veto power over decisions that affect ʻāina or cultural resources
track record of fair and accountable work in similar communities
agreements that cannot be changed without community consent
Contracts that address ownership of data, images, voices, and quotes with community approval required
A community panel involved in selecting the developer
Developer team members living in Puna during the project [survey wording]
I would not trust any outside developer
Other write-in responses (“all of the above” / “I don’t know”)
Note: One predefined option referred to developer team members living in Puna It is shown verbatim Three additional write-ins were grouped rather than treated as predefined standards.
Draft Community Benefits Agreement Principles
The survey does not create a legally binding agreement, and additional legal, technical, and financial analysis would be required before negotiation. Principles 1–9 below synthesize survey response options; the specific implementation mechanisms are policy recommendations rather than separate survey findings Principle 10 decommissioning and restoration is an additional safeguard recommended by the report authors and was not directly tested in the survey
1. Household affordability: measurable bill reductions or equivalent direct benefits for Kaʻū residents, with specific provisions for low-income households
2. Local employment: paid training, apprenticeships, local hiring targets, wage parity, and transparent reporting on who receives jobs and contracts
3. Food, water, and resilience: investment in backup power for schools, health centers, community hubs, farms, water systems, and emergency communications
4. Protection of ʻāina and culture: enforceable avoidance and mitigation standards for agricultural land, water, wildlife, sacred places, and cultural resources
5. Community governance: a Kaʻū community panel with defined authority, access to information, and continuing involvement from selection through decommissioning
6 Transparency and accountability: public project timelines, financial disclosures, progress reporting, and a defined process for raising and resolving concerns. Independent compliance review may be considered during negotiation but was not directly asked in the survey
7. Long-term enforceability: agreements that survive ownership changes and cannot be materially altered without community consent.
8. Data sovereignty: community approval for the use of local data, images, voices, stories, and quotations.
9. Ownership and revenue: meaningful examination of community ownership, revenue sharing, cooperative structures, or other mechanisms that keep value in Kaʻū
10. Additional policy safeguard—not directly surveyed: secured funding and enforceable responsibility for decommissioning and site restoration at the end of project life
XII. Community Observation: DHHL Geothermal Informational Briefing
On May 29, 2026, Kaʻū KōCreate Community Leader Kassie Shibuya attended a public informational briefing hosted by the Department of Hawaiian Home Lands regarding its statewide geothermal resources initiative DHHL described the session as informational and intended to gather beneficiary input before formal consultation.
Geothermal exploration was presented as a potential source of renewable energy, reduced costs, and beneficiary revenue Public testimony observed during the Kaʻū session, however, reflected strong opposition among the participants who spoke.
Recurring themes included protection of ʻāina, cultural stewardship, beneficiary land access, food sustainability, air-quality and health concerns, responsibility to future generations, and prioritization of homesteading and agriculture
This observation is supplemental qualitative evidence, not a survey result It is included because it reinforces patterns visible in the survey: concern about sacred and agricultural land, distrust of outside-controlled development, the need for genuine community input, and the importance of distinguishing information sessions from consent or consultation.
The observation supports beginning technology-specific engagement with history, land relationships, and community-defined priorities. Presenting projected benefits without addressing these conditions may not build trust
XIII. Synthesis, Recommendations, and Planning Implications
What the Survey Shows Overall
Survey participants did not describe energy as a separate policy category Their responses connected energy to the cost of living, food storage, water pumping, agriculture, emergency communication, medical needs, household independence, and the ability of families to remain in the district
The survey also shows that support cannot be inferred from general interest in renewable energy. Participants asked, directly or through selected criteria, what technology is proposed, who owns it, where it will be located, how the ʻāina will be protected, how local households will benefit, and what authority the community will retain.
The ʻĀina and Agricultural Land Come First
Protection of the land and natural environment was the strongest value in the survey. Agricultural land was the most selected development concern These findings establish a clear planning principle: land-use decisions cannot be treated as secondary to energy generation targets.
Projects should first demonstrate avoidance of high-value agricultural, cultural, ecological, and community resources. Mitigation offered after a site has been selected will not substitute for early community participation in site selection
Affordability Is the Minimum Standard
Affordable energy for every household was the top definition of energy success, and lower bills were the top desired community benefit A proposal that does not specify how household affordability will be measured and delivered would not directly address the priority participants identified most clearly.
Potential affordability mechanisms may include bill credits, community-solar subscriptions, low-income protections, direct ownership opportunities, or efficiency investments. These mechanisms were not individually tested in the survey and would require further feasibility and equity analysis
Off-Grid Experience Is an Asset
The survey documents respondents with multiple years of experience using off-grid solar and generators, and several write-ins referenced propane or small wind The survey did not assess technical expertise, but these residents should be included in future discussions about system performance, maintenance, reliability, storage, and cost
Energy planning should not treat off-grid households as outside the system They should be included as technical and community partners in discussions about microgrids, community solar, backup power, equipment lending, and workforce training
Resilience Means Food, Water, Communications, and Care
The outage data shows why resilience investments should be designed around essential functions. Food preservation, water access, emergency communication, cooking, lighting, medical equipment, and the care of kūpuna and keiki are the practical outcomes residents need.
Near-term investments in backup power, storage, emergency supplies, alerts, household planning, and community hubs can produce direct benefit without waiting for a large generation project.
Community Readiness Requires Energy Literacy
Residents are open to participating, but many do not know the organizations, systems, and technology options involved. In the Q24 item that incorrectly referenced Puna, “I do not know enough to make an
informed decision” was the most selected response Together with the Q29 information-needs results, this supports education before technology- or project-specific decision-making.
Energy education should be plain-language, non-promotional, and connected to household experience It should explain bills, grid operation, off-grid options, batteries, microgrids, regulatory roles, developer proposals, community rights, and how public input affects decisions.
Trust Must Be Designed Into the Process
The developer criteria show that a single public meeting or early consultation would not satisfy the highest-ranked standards Participants selected ongoing participation, transparent information, accountability, legal protections, and community authority over impacts.
The process should specify what decisions are open, who decides, how community input will change the project, how disagreements are resolved, and what happens if commitments are not met.
Priority Recommendations
1. Return the findings to Kaʻū through accessible community presentations, a public summary, and materials that can be used by local groups.
2. Create a Kaʻū energy education series before initiating technology- or project-specific consultation
3. Conduct targeted follow-up engagement with kūpuna, youth, Native Hawaiian multigenerational families, farmers and ranchers, off-grid households, low-income residents, renters, and residents with limited internet access.
4. Develop a district-level resilience investment plan focused on backup power, food and water security, emergency communications, household planning, and community hubs.
5. Assess community-owned solar, batteries, microgrids, cooperatives, and revenue-sharing models with equal seriousness to conventional developer-owned projects.
6. Use the survey findings as the baseline for a Kaʻū Community Benefits Agreement framework and require any developer to respond publicly to each priority
7. Establish a community governance body with a defined role in siting, developer selection, benefit negotiation, monitoring, and decommissioning
8. Conduct a corrected Kaʻū-specific interest assessment before designing a vegetation and road-clearing initiative; if pursued, complete utility coordination, legal review, training standards, safety protocols, insurance analysis, and equipment planning.
9. Maintain a transparent engagement record that documents who was reached, what was heard, what changed, and what remains unresolved.
10 Repeat or update the survey after education and deeper outreach so participants can respond with greater information and underrepresented groups can be included more fully.
XIV. Limitations
The survey provides a substantial set of community perspectives but is not a statistically representative sample of every Kaʻū resident Participation depended on event attendance, direct outreach networks, availability, internet or device access, and willingness to complete a long survey.
Ocean View and Nāʻālehu accounted for 60% of responses Smaller communities and residents who are isolated, homebound, houseless, digitally excluded, or disconnected from the outreach networks may be underrepresented
Some survey questions were skipped by participants, and some multi-select write-ins did not fit the predefined categories. Percentages are therefore labeled by denominator. Open-ended themes are qualitative and should not be interpreted as precise prevalence estimates
Several survey items inadvertently retained “Puna” from the shared template This report preserves the original wording in tables and Appendix D. Q24 is treated as exploratory because the question itself named Puna; Q23 is not used to estimate Kaʻū task-force support; and the affected Q19 and Q28 response options are shown verbatim. Place-name correction comments were not merged into predefined option counts.
The DHHL briefing section reflects one observer’s field notes and the testimony heard at that event It is not a quantified measure of all beneficiaries’ views and is intentionally presented separately from survey findings. Finally, attitudes can change as residents receive information, projects become more specific, or household conditions change. This report should be treated as a baseline and a foundation for continued engagement, not as a substitute for future consultation
XV. Appendices
Appendix A: MOA / Deliverable Alignment Crosswalk
Project Requirement
Participant data
Historical and cultural context
Impacts of power outages
Energy information needs
Community Benefits Agreement input
Outreach best practices
Synthesis and recommendations
Supplemental qualitative observation
Limitations and data notes
Appendix B: Survey Instrument
Where Addressed
Section VI: Participant Data
Section VII: Community Context, Values, and Vision
Section IX: Power Outages, Preparedness, and Neighborhood Resilience
Section X: Community Energy Information, Participation, and Representation
Section XI: Data to Inform a Community Benefits Agreement
Sections III–V: Methodology, Best Practices, and Activity Log
The Kaʻū survey included the following questions The full form and raw response dataset are maintained separately by Vibrant Hawaiʻi.
The list below reproduces question titles Appendix D separately reproduces and explains the Puna references that appeared in specific response options
Q1 Where do you live in Kaʻū?
Q2. How many years have you lived in Kaʻū?
Q3. What generation are you?
Q4. What is your ethnicity? (Check all that apply)
Q5. How many people live in your household?
Q6 Do you own or rent your home?
Q7. What makes Kaʻū, Kaʻū? What should never be lost or compromised? (Check all that apply)
Q8 What is your vision for the future of Kaʻū for your children and grandchildren?
Q9. How can renewable energy support the future you want for Kaʻū?
Q10 How do you currently meet your electricity needs? Check all that apply
Q10a. (If off-grid) How long have you been off-grid?
Q10b (If off-grid) Overall, how satisfied are you with your off-grid energy setup?
Q11. What is your average monthly electricity cost?
Q12 What is your average monthly electricity usage?
Q13. How concerned are you about the cost of your electric bill?
Q14. What have you done to reduce your electricity usage?
Q15. How concerned are you about the environmental and health impacts of how electricity is currently produced?
Q16 Thinking about recent power outages (including storm-related outages), what became difficult or dangerous for you or your ʻohana? (Check all that apply)
Q17 How well is your household prepared for disasters?
Q18. What would help you and your household be better prepared for disasters and power outages? (Check all that apply)
Q19. What would energy success look like for Kaʻū? (Check all that apply)
Q20 In your experience, what are the most common causes of power outages in your neighborhood? (Check all that apply)
Q21 If neighbors with overgrown vegetation or unmaintained properties aren't addressing it, what do you think are the main reasons? (Check all that apply this helps us understand barriers, not assign blame)
Q22. What community-led actions would you be willing to support or participate in to improve neighborhood resilience? (Check all that apply)
Q23. Would you be interested in a community-based vegetation and road-clearing task force a trained, verified team of Puna residents authorized to safely clear hazardous trees and restore access after storms? If yes, please provide your email below.
Q24 What kinds of energy development feel right for Puna? (Check all that apply)
Q25. What opportunities do you see in energy development for Kaʻū? (Check all that apply)
Q26 What concerns you most about energy development in Kaʻū? (Check all that apply)
Q27. If a renewable energy project came to Kaʻū, what would make the most difference to your community? (Check all that apply)
Q28. What matters most to you when evaluating whether an energy developer is right for Kaʻū? (Check all that apply)
Q29. What else do you need to know to feel confident making decisions about energy in Kaʻū? (Check all that apply)
Q30. Whose voice, needs, or perspectives are you worried will be missed or left out of energy planning for Kaʻū?
Q31 How familiar are you with the following organizations and their energy work? >> Hawaiʻi Clean Energy Initiative
Q31 How familiar are you with the following organizations and their energy work? >> Sustainable Energy Hawaiʻi
Q31 How familiar are you with the following organizations and their energy work? >> Hawaiʻi Energy
Q31. How familiar are you with the following organizations and their energy work? >> Hawaiʻi State Energy Office
Q31. How familiar are you with the following organizations and their energy work? >> Hawaiʻi County Mayor's Energy Task Force
Q31. How familiar are you with the following organizations and their energy work? >> Hawaii State Public Utilities Commission
Q31. How familiar are you with the following organizations and their energy work? >> Hawaii State Department of Consumer Advocacy (DCA)
Q32 Have you ever participated in energy-related activities? (Check all that apply)
Q33. If you have participated (above), how satisfied were you with the process? (Skip if you selected "None of the above")
Q34. How well do you feel your energy priorities are currently represented by organizations working on energy issues in Hawaiʻi?
Q35. Would you like to participate in energy planning for Kaʻū?
Q36 Which ways of participating work best for you? (Check all that apply)
Q37. How would you rate the current state of each of the following in Kaʻū? >> Living Aloha Being in harmony with our ʻāina, community, and ourselves
Q37. How would you rate the current state of each of the following in Kaʻū? >> Belonging Building relationships to place and people so we can care for and be cared for
Q37. How would you rate the current state of each of the following in Kaʻū? >> Get Chance Access to equitable systems that promote choice and prosperity
Q37 How would you rate the current state of each of the following in Kaʻū? >> Get Choice The ability to take ownership of your future and contribute to collective abundance
Q37 How would you rate the current state of each of the following in Kaʻū? >> Resilience The ability to adapt to change and adversity without being uprooted from what matters
Q37 How would you rate the current state of each of the following in Kaʻū? >> Strong ʻOhana ʻOhana as a pillar of support through aloha, belonging, and resilience
Q37. How would you rate the current state of each of the following in Kaʻū? >> Thriving Community Opportunities for individuals and ʻohana to contribute toward community-driven solutions
Appendix C: Full Survey Dataset and Privacy
The full dataset contains 141 responses across 53 columns, including the submission date, 37 numbered questions, the seven-part Vibrant Hawaiʻi indicator question, and a submission identifier. The raw file is not reproduced in this report because one field contains contact information submitted in response to the task-force item.
Aggregate tables in this report exclude names and email addresses. Any future use of contact information should be limited to the purpose for which it was provided and managed through appropriate organizational privacy practices
Appendix D: Data Quality, Wording, and Interpretation Notes
• Q19 included two predefined options that referred to Puna: “Energy that creates local jobs and keeps money in Puna” and “Energy decisions made by and for Puna not outside companies.” The report preserves those labels verbatim and does not merge Kaʻū-correcting write-ins into the predefined counts
• Q23 referred to “a trained, verified team of Puna residents” and collected email addresses rather than a categorical yes/no response The 26 unique submissions are not treated as a valid estimate of support for a Kaʻū task force.
• Q24 was titled “What kinds of energy development feel right for Puna?” The results are preserved verbatim and treated as exploratory, not as a clean measure of Kaʻū technology preferences
• Q28 included the predefined option “Developer team members living in Puna during the project.” That option is shown verbatim rather than relabeled
• Off-grid status is based only on explicit Q10 categories beginning “Off grid.” Two grid-connected respondents wrote in a backup generator or wind generator; those write-ins were not recoded as off-grid Forty-six respondents selected an explicit off-grid category, and six selected both grid and off-grid categories
• Two Q10a respondents selected more than one duration category. The duration table therefore reports 43 category selections from 41 respondents; 30 unique respondents selected four years or more
• Some nominally exclusive multi-select options were selected together. Examples include “not significantly impacted” with specific outage impacts, “I feel well prepared” with preparedness needs, and “None of the above” with a listed energy activity. Raw selections are retained and consequential cases are disclosed in table notes.
• Q33 satisfaction data do not follow the intended skip logic consistently Nine of 24 substantive ratings came from respondents who also selected “None of the above” in Q32; only 15 ratings can be linked unambiguously to a listed activity
• Percentages for multi-select questions use all 141 submissions unless otherwise stated. Percentages for single-select questions use valid responses Rounding may cause displayed percentages not to sum exactly
Appendix E: Supplemental Data Summary
Additional findings that may be useful for implementation include:
• Forty-six of 140 Q10 respondents selected at least one explicit off-grid category; 40 selected only off-grid categories and six selected both grid and off-grid categories.
• Twenty-nine respondents reported monthly electricity costs of $50 or less, while 37 reported $250 or more.
• Eighty-seven of 136 respondents did not know their monthly kilowatt-hour use
• Seventy-eight respondents identified kūpuna or physical limitations as a barrier to vegetation maintenance, and 74 identified cost.
• Twenty-six unique email addresses were submitted in response to Q23. Because Q23 referred to Puna and did not include a yes/no option, this is not a clean estimate of Kaʻū task-force interest.
• Strong ʻOhana was the highest-rated Vibrant Hawaiʻi indicator; Get Chance and Get Choice were the lowest.
This accuracy-reviewed version supersedes the earlier expanded Kaʻū draft for quantitative reporting and quotation use