
UKRAINE INTERNAL DISPLACEMENT REPORT
GENERAL POPULATION SURVEY
ROUND 19
JANUARY 2025
OVERVIEW
Since the full-scale invasion of Ukraine by the Armed Forces of the Russian Federation, the International Organization for Migration (IOM) has been collecting data on internally displaced persons (IDPs), returnees, and the non-displaced population through a nationwide representative General Population Survey (GPS). The purpose of the assessment is to provide an in-depth, granular understanding of displacement figures and mobility trends, as well as to gather fundamental data on
KEY FINDINGS
the profiles, needs and intentions of IDPs in support of humanitarian efforts to find durable solutions to internal displacement. The GPS, implemented on a quarterly basis, also provides key analysis of trends over time. To this end, the GPS conducts oblast-level, randomized interviews with a representative sample of each population group. This report presents the findings of Round 19 of the GPS, which took place from 22 October to 19 December 2024.
There are an estimated 3,665,000 de facto IDPs and 4,238,000 returnees residing in Ukraine.
The largest number of IDPs reside in Dnipropetrovska (14%) and Kharkivska (12%) Oblasts. The highest proportion of IDPs originate from Donetska Oblast (28%). The largest inter-oblast displacement movements of IDPs were recorded from Donetska Oblast to Dnipropetrovska Oblast (283,000 IDPs), and from Donetska Oblast to Kyiv City (131,000 IDPs).
Ten per cent of the IDPs reside in single-parent households (only one member aged 18+ and all others are 0-17 years old) as of December 2024, while among non-displaced, the share of those comprised 3 per cent.
One-third (31%) of IDP households reported that at least one person in their household was living with a disability, while 44% of IDP households contained at least one person that was chronically ill.
The majority (70%) of de facto IDPs expressed the intention to remain in their current locations beyond the next three months. Only 15 per cent expressed the intention to return to their places of origin, and of those the majority stated they would do so only after the war was over.
New displacement continues to be recorded, with 8 per cent of IDPs reporting they have been displaced for three months or less (compared to 7% in June 2024). However, nearly two thirds of IDPs have been displaced for more than two years, pointing to the increasingly protracted nature of the displacement crisis in Ukraine.
Protracted displacement has contributed to acute financial vulnerabilities among a significant proportion of IDPs, unable to afford basic items such as power banks (48%), medicines (44%), food (36%), and clothes or other NFIs (32%).
Acute needs and access gaps are linked with re-displacement and (potentially unsustainable) return intentions. IDPs who reported an intention to leave their current location were more likely to report lacking adequate access to accommodation (40%), food (43%) and healthcare services (43%) than those intending to remain.
Over one in four IDP households (26%) reported that they had moved to a lower-quality dwelling – reflecting the challenges of sustaining adequate rented accommodation in protracted displacement, and exacerbating winter-related vulnerabilities when utility expenditure is highest.
SECTION 1: POPULATION FIGURES AND MOBILITY TRENDS
1.1 OVERVIEW AND CHANGE OVER TIME
Map 1: Estimated de facto IDPs presence by oblast of displacement
3,665,000
4,238,000 EST. TOTAL RETURNEES
Estimated number of IDPs by oblast of
-
Areas with under-represented population estimates 1
There are an estimated 3.7 million de facto internally displaced persons (IDPs) in Ukraine. The largest number of IDPs resided in Dnipropetrovska (520,000, 14% of the total de facto IDP population) and Kharkivska (447,000, 12%) Oblasts, while the capital Kyiv City
(401,000, 11%) and surrounding Kyivska Oblast (294,000, 8%) hosted the third- and fourth-highest proportions of IDPs, respectively. Close to a third (1,128,000) of the IDPs resided in locations near the frontline.2
Figure 1: Share of IDPs and returnees in the total population in Ukraine and number of IDPs and returnees over time3
The share of IDPs in Ukraine has not changed significantly since Round 14 of the GPS carried out in September 2023, stabilising at 11 per cent of the current population. The majority of IDPs (62%) have been displaced for two and more years, indicating that displacement in Ukraine has become protracted.
New displacement continues to occur at a rate comparable to that recorded during GPS R18: 8 per cent, or 303,000 IDPs, were displaced in the three months prior to data collection during GPS R19, compared to 9 per cent, or 306,000 IDPs, who had been displaced in the three months prior to data collection during R18.
Recent displacement has primarily been driven by an escalation of military operations and subsequent displacement to safer areas from and within frontline oblasts. More than half of all IDPs who displaced in the three months prior to data collection were displaced from or within Donetska Oblast (57%), followed by Sumska (12%) and Kharkivska (10%) Oblasts. For those recently displaced, the more common oblasts of displacement were Dnipropetrovska (25%), Kharkivska (12%) and Kyivska (12%), with an additional 7 per cent displaced in Kyiv city.
1 Estimates in Donetska, Zaporizka, Luhanska, and Khersonska Oblasts are not represented due to their likely under-representation as a result of coverage being limited to government-controlled areas and to the limited number of respondents reached in occupied areas.
2 The list of raions designated as front-line areas for the purposes of analyses is determined based on the Government of Ukraine's Resolution on "Regulations on the approval of the list of territories on which the Russian Federation is (was) or temporarily occupied", updated as of October 30, 2024. This list includes raions that are either bordering, adjacent to or in proximity to active conflict zones, where there is ongoing fighting, hostilities, or a high likelihood of such activities.
3 With each successive round of the General Population Survey,
1.2 AREAS OF DISPLACEMENT AND PLACES OF ORIGIN
Table 1: Top 5 oblasts of origin of IDPs (% of IDPs)
Oblast
Table 2: Top 5 IDP-hosting oblasts (% of IDPs)
Oblast
Dnipropetrovska
Over two-thirds of IDPs (69%) originated from the Eastern macroregion, followed by the Southern macro-region (17%). Consistent with the previous rounds (R17, August 2024 and R18, October), the main oblasts of origin of IDPs were all located along or near the frontline and included areas previously or currently occupied by forces of the Russian Federation. These oblasts are the origin of 77 per cent of the total IDP population, equivalent to 2,829,000 people.
One-third of IDPs (34%) resided in the Eastern macro-region, while 46 per cent of IDPs from the East resided in different oblasts within the same macro-region. The primary oblast of displacement was Dnipropetrovska Oblast, hosting 14 per cent of estimated IDPs, followed by Kharkivska Oblast (12%), Kyiv City (11%), and Kyivska Oblast (8%). Thirty-one per cent of IDPs (1,128,000 individuals) resided in frontline areas, with 38 per cent of these frontline IDPs having resided in Kharkivska Oblast.
2: Displacement from oblasts of origin to oblasts of displacement
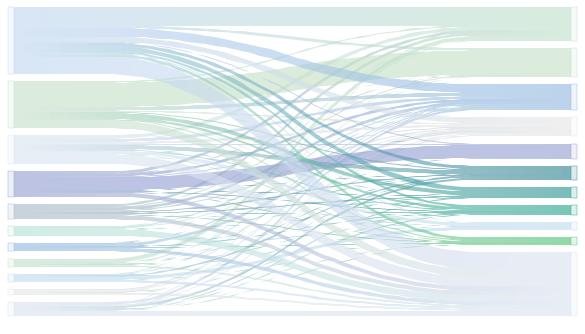
of IDPs were displaced within their oblast of habitual residence.
The majority of IDPs (73%) were displaced to an oblast different from their place of habitual residence, while slightly more than a quarter (27%) were displaced within their oblast of origin. The largest interoblast displacement movements of IDPs were recorded from Donetska Oblast to Dnipropetrovska Oblast — 283,000 IDPs (27%), and from Donetska Oblast to Kyiv City — 131,000 IDPs (13%). Donetska (92%), Zaporizka (86%), and Kharkivska (84%) Oblasts displayed the largest shares of intra-oblast displacement. The high rates of intra-oblast displacement in the frontline Kharkivska (376,000 IDPs) and Zaporizka (199,000 IDPs) Oblasts, along with the high concentrations of IDPs in Kharkivska and Dnipropetrovska Oblasts in the East, indicates a general preference of IDPs to remain in proximity of their regions of origin.
Figure 3: Share of IDPs displaced within their oblast of origin and outside their oblast of origin, by length of displacement (% of IDPs)

The propensity for intra-oblast displacement was found to increase with the age of the respondent, with a 9 percentage point difference difference between the youngest (18-24) and the oldest (60+) age groups. Similarly, respondents in households with at least one elderly member were more likely to have been displaced within their oblasts of habitual residence (30%), compared to respondents in households with no elderly member (23%), which may suggest a reluctance or inability to move older individuals longer distances or to remove them too far from their established social networks. Conversely, respondents in single-parent households and households consisting solely of women and children were more often displaced outside of their oblasts of habitual residence (77% and 74%, respectively). However, IDPs in households with at least one person with disabilities, or chronically ill people, were more likely to be displaced within their oblast (32%, for each category), compared to households without persons with disabilities (24%) or chronically ill people (22%).
There was also a correlation between household income and area of displacement. The highest level of intra-oblast mobility was observed among IDPs with a monthly available household income of UAH 6,317 or less per person, with 32 per cent of them having relocated within their oblasts of origin. In contrast, among IDPs in households with an available household income above UAH 6,318 per person, a larger share (81%) moved to another oblast.
Figure
1.3 DURATION OF DISPLACEMENT 880
days
median duration of displacement among IDPs in Ukraine (as of December 2024)

In December 2024, 62 per cent of IDPs reported having been displaced for two years or more. This prolonged displacement, affecting close to two-thirds of those surveyed, reflects the protracted nature of the crisis in Ukraine. It highlights the pressing need to develop and implement effective strategies for early recovery and durable solutions to internal displacement.
The share of IDPs displaced for over two years was largest in Kyiv City (71%), followed by Lvivska, Zaporizka and Kyivska Oblasts (69%, 68% and 68%, respectively), whereas the oblasts of origin with the highest shares of IDPs displaced for two years or longer were Luhanska (92%) and Zaporizka (73%) Oblasts.
An additional 21 per cent of IDPs were displaced for one year or less, including 8 per cent within three months of the survey. This reflects the more recent waves of displacement from areas along the frontline in Ukraine, over two years after escalation of the war in February 2022. When considering more recent displacements, Dnipropetrovska (15%) and Sumska (13%) Oblasts recorded the largest shares of IDPs displaced for up to three months, while for oblasts of origin, Sumska (25%) and Donetska (16%) Oblasts recorded the highest shares of IDPs displaced within the three months prior to data collection.
1.4 RETURNS FROM ABROAD INTO DISPLACEMENT WITHIN UKRAINE
355,000
IDPs returned to Ukraine from abroad but remained in displacement
of IDPs were abroad since 2022 and returned to Ukraine but remained in displacement
of IDPs who were abroad since 2022, returned to Ukraine and remained in displacement were considering re-displacement in the three months following data collection 14%
Table 4: Top oblasts of origin of IDPs who returned to Ukraine from abroad but remained in displacement
IDPs who had previously been displaced abroad and returned to Ukraine but remained in displacement primarily resided in Kyiv City (17%), Kharkivska (10%), and Kyivska (9%) Oblasts. The main oblasts of origin of IDPs previously displaced abroad, however, were Donetska (21%), Kharkivska (19%), and Khersonska (17%) Oblasts – the oblasts exposed to frontline activities, hostilities and shelling.
Of those IDPs that had returned from abroad but remained in displacement, 77 per cent reported having being displaced for more than one year, which is comparable to the national average (78%) of IDPs in Ukraine.
Fourteen per cent of IDPs previously displaced abroad were considering re-displacement in the three months following data collection. Moreover, 6 per cent of IDPs were intending to move elsewhere beyond the three months following data collection, and another 15 per cent were intending returning to their places of origin in the medium term (beyond the 3 months following data collection). In turn, 60 per cent were intending to remain in their current locations in the short to medium term.
Among IDPs who were previously displaced abroad, when addressing their most pressing needs, power banks or generators were reported most (19%), followed by income-earning opportunities (15%), affordable and adequate accommodation (12%) and food (8%).
To meet their basic needs, IDPs who had previously been displaced abroad, reported their households to have adopted various coping strategies. A substantial percentage (63%) resorted to purchasing cheaper food, while 56 per cent reduced their utility usage. Furthermore, a significant portion of IDPs reported their households to have reduced essential health expenditures, decreased quantity of food intake and spent their savings (52% each) as coping measures with an additional 30 per cent having reported reliance on humanitarian aid.
When asked why such coping strategies were adopted, IDPs who were previously displaced abroad primarily reported access to shelter (67%), food (46%) and healthcare (44%) as their driving reasons.
Figure 4: Share of IDPs by duration of displacement
Table 3: Top oblasts of current displacement of IDPs who returned to Ukraine from abroad but remained in displacement
1.5 MOBILITY INTENTIONS
WITHIN 3 MONTHS
of IDPs were planning to remain in their current locations within the next three months. 87%


BEYOND 3 MONTHS
of IDPs were planning to remain in their current locations beyond the next three months.
When asked about their plans for short-term movement, most IDPs (87%) expressed their intention to remain in their current location within the next three months, while 7 per cent reported considering leaving.
Mobility intentions in the short term were correlated with the length of time already spent in displacement. Among IDPs who had been displaced for more than two years at the time of the interview, 6 per cent expressed their intention to leave their current location in the three months following data collection, a proportion rising to 17 per cent in the case of IDPs who had been displaced recently, for up to three months. Conversely, 50 per cent of IDPs who had been displaced for up to three months indicated their intention to remain in their current location in the medium term. In contrast, nearly three-quarters (74%) of individuals who had experienced displacement for over two years expressed their intention to stay in their current location in the medium term.
The percentage of IDPs who intended to leave their current location within three months was
Among IDPs intending to remain in their current locations beyond the next three months, 46 per cent intended to settle and integrate, which highlights the importance of approaches focusing on durable solutions.
Among IDPs planning to return to their areas of origin after a period of at least three months, more than half (53%) reported that they planned to return only after the conclusion of the war, which highlights the importance of approaches focusing on sustainable and dignified solutions for IDPs until return becomes possible.


small towns or suburbs of large cities and rural areas (9%, 8%, and 10%, respectively). The intention to leave their current location within the three months following data collection was much more prevalent among men (11%) than among women (5%).
The majority of IDPs (70%) expressed their intention to remain in their current location beyond the next three months, consistent with the short-term plans. Fifteen per cent of IDPs intended to return to their oblast of origin beyond the next three months, and 4 per cent intended to move elsewhere. Kyiv City, Odeska and Kyivska Oblasts hosted the highest proportions of IDPs intending to remain in their current locations in the medium term (80%, 75% and 73%, respectively).
Among the top five IDP-hosting oblasts, Kharkivska had one of the lowest percentages of IDPs planning to stay mid-term (64%) and a comparably high percentage planning to return to their areas of origin (20%).
Figure 5: Mobility intentions of IDPs during the 3 months after data collection, in top 5 IDP-hosting oblasts, (% of IDPs in each oblast)
Figure 6: Mobility intentions of IDPs beyond the 3 months after data collection, in top 5 IDP-hosting oblasts, (% of IDPs in each oblast)
Figure 7: % of IDPs by expected timeline to return (% of IDPs in each oblast)
1.6 DEMOGRAPHICS, VULNERABILITIES AND SETTLEMENT TYPE
A detailed disaggregation of IDP profiles and greater insights into the prevalence of vulnerabilities4 and household composition enables an enhanced understanding of mobility and is key to effective, targeted humanitarian response. To this end, IOM’s GPS includes indicators –developed in cooperation with the United Nations Population Fund (UNFPA) – which allows for precise estimated demographic breakdowns of the displaced population. This section specifically outlines the estimates for IDPs in households consisting exclusively of IDPs.
HOUSEHOLD COMPOSITION
AS OF DECEMBER 2024
of IDPs were in households consisting exclusively of IDPs
average number of children per IDP-only household6 86% 10% 2 1
median IDP household size5
IDPs in single-parent households (only one member aged 18+ and all others are 0-17 years old)
DEMOGRAPHIC PROFILE
The majority of IDPs in IDP-only households were female (59%), while 41 per cent were male. Most IDPs in IDP-only households were of working age (51%), and near a quarter were children (23%) or aged 60 or older (26%).
41%
Est. 1,283,000 Male IDPs
59%
Est. 1,869,000 Female IDPs
Figure 10: Estimated number of IDPs in IDP-only households, by sex and age group9
SETTLEMENT TYPE
The majority of IDPs in IDP-only households (45%) resided in a large city, while over a quarter (26%) lived in a small town and 20 per cent were staying in a rural area or village.
HOUSEHOLD CHARACTERISTICS
This section presents the share of IDPs in IDPs-only households who reported that at least one of their current household members10 possessed at least one of the following characteristics; these traits may contribute to household vulnerability, given: 1. a presumed cost related to the characteristic; 2. a presumed need to access assistance; and 3. potential limitations in getting to or accessing assistance. These characteristics are not mutually exclusive, and individuals and households may live with one or multiple of the following characteristics.11
4 To identify household members with disabilities and chronic illnesses, respondents were asked if anyone in their household had a disability or chronic illness based on the World Health Organization's definitions.
Please note in the report that the survey used a modified Washington scale methodology for shorter and simpler questions. The original approach was not used in this study.

5,6 As reported by respondents in households consisting exclusively of IDPs (86%).
7 The estimated total number of children in IDP-only households is 736,000 children.
8 The estimated total number of IDPs in households consisting exclusively of IDPs is 3,152,000 IDPs.
9 The description of the characteristics and demographic profile of IDP household members is based solely on the data for those household members who do not live in their place of habitual residence due to the war.
10 To identify household members with disabilities and chronic illnesses, respondents were asked if anyone in their household had a disability or chronic illness based on the World Health Organization's definitions.
Please note in the report that the survey used a modified Washington scale methodology for shorter and simpler questions. The original approach was not used in this study.
11 Multiple answers possible.
12 To identify household members with disabilities and chronic illnesses, respondents were asked if anyone in their household had a disability or chronic illness based on the World Health Organization's definitions. Please note in the report that the survey used a modified Washington scale methodology for shorter and simpler questions. The original approach was not used in this study.
Figure 9: Share of IDPs by settlement type
Figure 8a: Number of children in IDP households (% of respondents in IDP-only households with children)7
Female Male
SECTION 2: PRIORITY NEEDS AND COPING STRATEGIES
2.1 OVERVIEW
Assistance needs were assessed using a two-step approach. First, respondents were asked whether they had had sufficient access to a list of pre-defined goods and services to meet their basic needs. Second, in case of lack of access to one or multiple goods or services, they were asked to identify which of those reflected their most pressing need.
Results show that access gaps were generally more widespread among IDPs, who reported insufficient access to almost all types of goods and services at higher proportions than the non-displaced. Only 15 per cent of IDPs reported having had sufficient access to all the assessed goods and services, compared to almost a quarter of returnees (21%) and the non-displaced (22%). Most commonly, IDPs reported insufficient access to power banks and generators (48%), medicines (44%) and income-earning opportunities (37%). In addition, IDPs reported at notably higher proportions than the non-displaced insufficient access to food (36%, compared to 24%), clothing and other NFIs (32%, compared to 13%), hygiene items (30%, compared to 12%), and accommodation (29%, compared to 6%).
No significant difference was reported in access gaps among IDPs who had been displaced for a longer or shorter period of time. Almost nine in ten IDPs (89%) who had been displaced within the past year reported insufficient access to at least one type of good or service, compared to eight in ten IDPs who had been displaced for more than a year (84%).
Similar to the reported access gaps among the general population, IDPs most pressing needs also included access to power banks and generators, income-earning opportunities, and medicines. Specifically, 15 per cent of IDPs reported power banks and generators as their most pressing need. This was followed by income-earning opportunities (12%), and both accommodation and medicines (11% each). The proportions of respondents having reported their most pressing needs were largely comparable across population groups. However, a notably higher proportion of IDPs (11%) than returnees or the non-displaced (2%, and 1%, respectively) reported most urgently needing accommodation. In addition, 8 per cent of IDPs reported food as their most urgent need, compared to 4 per cent of returnees and 5 per cent of the non-displaced. These results highlight the greater challenges IDPs continue to face in accessing affordable, safe, and secure housing, as well as meeting other needs.
Reported access gaps, as well as levels of need, remained comparable to GPS Round 18 results. The only notable difference was that the proportion of IDPs who reported having lacked access to power banks and generators dropped from 62 per cent in October 2024 to 48 per cent in December 2024. This may indicate that some successful preparation for winter has taken place since the October round of data collection.
Income-earning opportunities
Figure 11: Top 3 primary
and
Table 5: Share of respondents reporting having had insufficient access to goods and services to be able to meet their basic needs, by displacement status (% of IDP)
2.2 NEEDS BY LOCATION, SOCIO-ECONOMIC CHARACTERISTICS & MOBILITY
LOCATION
Need profiles were often similar across oblasts. Nevertheless, there were differences by location in the types of goods and services IDPs reported needing most urgently. Outside of Kyiv City and the Western oblasts, reported needs reflected the overall results for IDPs (with power banks or generators, income-earning opportunities and medicines most urgently needed). In contrast, in Kyiv City and the Western oblasts, accommodation was most commonly reported as urgently needed (by 24% and 15% of IDPs, respectively, compared to 6% to 9% of IDPs in other parts of the country). Food was often reported as a common need (by 9% to 11% of IDPs), but slightly
less so in Eastern (7%) and Southern (6%) oblasts. Lastly, medicines were reported as urgently needed by 9 per cent to 15 per cent of IDPs across the country, with the exception of those in Kyiv City (3%).
While IDPs not located in frontline raions more commonly reported lacking adequate accommodation (31% compared, to 23%), IDPs in frontline raions more commonly reported insufficient access to power banks or generators (52%, compared to 45%), building or reconstruction materials (36%, compared to 23%), and adequate education (24%, compared to 16%).
12: Share of IDPs in the top 5 IDP-hosting oblasts reporting having had insufficient access to goods and services to be able to meet their basic needs (top 5 items, % of IDP)13
SETTLEMENT TYPE
Building or reconstruction materials more commonly a pressing need in rural areas, and accommodation more commonly a pressing need in cities and towns.
Female IDPs more commonly reported access gaps (87% reported not having had sufficient access to at least one good or service to be able to meet their basic needs) than male IDPs (81%), as did respondents in households that may be particularly vulnerable: e.g. 91 per cent of IDPs in households with at least one person with disabilities reported access gaps, compared to 82 per cent of IDPs in households without persons with disabilities; and 91 per cent of IDPs in households with chronically ill person reported access gaps, compared to 80 per cent of IDPs no chronically ill person in households.
Lastly, IDPs in lower-income households faced more widespread access gaps, with 89 per cent of IDPs in households with an available income per household member below the Minimum Expenditure Basket (MEB) having reported such gaps, compared to 78 per cent of IDPs in households with an income above the MEB.14
13: Share of IDPs reporting building materials or accommodation as their most pressing need, by type of settlement (% of IDP)
/ reconstruction materials Accommodation
/
of female IDPs reported insufficient access to hygiene items, compared to 18 per cent of male IDPs.
of IDPs in single-parent households reported insufficient access to food, compared to 35 per cent of IDPs not in single-parent households.
of IDPs in households with an income below the MEB reported insufficient access to medicines, compared to 31 per cent of IDPs in households with an income above the MEB.
Figure
Figure
Power banks / generators Medicines
Clothes / other NFIs Food Income-earning opportunities
Dnipropetrovska Kharkivska Kyiv City Kyivska Zaporizka
MOBILITY INTENTIONS
IDPs who were considering leaving their current place of residence within the next three months reported insufficient access to most goods and services at higher proportions than those not considering leaving.
90%
of IDPs who were considering leaving their current location within the next three months reported access gaps, compared to 85 per cent of IDPs who were not considering leaving.
Figure 14: Share of IDPs reporting having had insufficient access to goods and services to be able to meet their basic needs (top 10 items), by short-term movement intentions (% of IDP)15
Access gaps were generally more widespread among IDPs who were planning to leave their current location in the short term (i.e. within three months from data collection). Most notably, IDPs who were planning to leave in the short term reported at significantly higher proportions than those not planning to leave insufficient access to adequate accommodation (40%, compared to 27%), food (43%, compared to 35%), and health services (43%, compared to 32%).
Similarly, access gaps were more widespread among IDPs who reportedly planned to return in the medium term (86% of IDPs whose durable solutions pathway preference was return reported access gaps) than among IDPs planning to remain (84%) and / or integrate (81%) in the medium to long term, or those not knowing their preference yet (88%). Most notably, roughly one in five IDPs who planned to return in the medium term (16%) reported medicines as
2.3 COPING STRATEGIES
their
the 30 days prior to data collection to be able to meet their basic needs, by socio-economic characteristics)
of female IDPs reported their households to have switched to cheaper food, compared to 58 per cent of male IDPs.
their most pressing need, compared to 8 per cent to 10 per cent of IDPs with other durable solutions pathway preferences.
Albeit less pronounced than in the previous round, these results continue to highlight a trend of greater gaps in access to goods and services among IDPs who planned to leave their current residence in the short or medium term, as opposed to those who planned to stay temporarily or even permanently.
Figure 15: Share of IDPs reporting having had insufficient access to at least one good or service to be able to meet their basic needs, by durable solutions pathway preference (% of IDP)
61%
60%
of IDPs in households with an income below the MEB reported their households reduced usage of utilities (wood, coal, electricity, gas), compared to 45 per cent of IDPs in households with an income above the MEB.
of IDPs with at least one chronically ill person in households reported their households to have reduced essential health expenditures, compared to 42 per cent of IDPs without chronically ill person in households.
Across population groups, IDPs continued to heavily rely on livelihoodsbased coping strategies to help them meet their basic needs. Out of a list of ten defined livelihoods-based coping strategies, 86 per cent of IDPs reported their households to have adopted at least one of these strategies in the 30 days prior to data collection to be able to meet their basic needs, or to already have exhausted them. In comparison, 78 per cent of returnees and 77 per cent of non-displaced individuals reported the adoption or exhaustion of at least one of the coping strategies to meet their basic needs.
Most commonly, IDP households relied on food-based strategies: 68 per cent of IDPs reported their households had switched to cheaper food, and 52 per cent of IDPs reported their households had reduced the amount of food consumed. Additionally, 51 per cent reported their households to have relied on savings, 55 per cent to have reduced utility usage, and 50 per cent to have cut health expenditures. Moreover, 36 per cent of IDPs reported their households had relied on humanitarian assistance to meet basic needs.
These strategies may allow households to meet their needs in the short term, however, their adoption may not be sustainable. In the long term, household resilience and coping capacity may erode if households are unable to gain access to sufficient sustainable sources of income. Notably, 17 per cent of IDPs reported their households had already exhausted their savings, while 14 per cent of IDPs reported their households could no longer rely on humanitarian assistance.
Figure 16: Primary coping strategies reported by IDPs (% of IDPs reporting
households to have adopted these coping strategies in
Table 6: Severity of livelihoods-based coping (% of respondents reporting their households to have adopted or exhausted livelihoods-based coping strategies to meet basic needs in the 30 days prior to data collection, by severity level and displacement status)16
The level of adoption of the most frequently reported livelihoodsbased coping strategies has largely remained stable since Round 15 in December 2023, although some fluctuations were observed related to the expenditure of savings and health expenditures. There was a noticeable decline in the proportion of IDPs having adopted coping strategies, such as spending saving (by 10 percentage points), reducing utility usage (by 5 percentage points), and skipping debt repayments (4 percentage points) compared to last year. While IDPs continued to be able to rely on coping strategies, an increasing proportion of IDPs indicated that they were not in a position to spend savings (16%, compared to 7% in R16), likely reflecting this strategy to increasingly become less available to people, and a potential exhaustion of coping capacities. This persistent high degree of reliance on livelihoods-based
IDPs not only more commonly reported that their households had adopted or exhausted livelihoods-based coping strategies, but they also more frequently reported the adoption or exhaustion of more severe livelihoods-based coping strategies. These strategies are more extreme in nature, negatively affect a household’s future productivity and / or are extremely difficult to reverse. One-fourth (26%) of IDPs reported that their households had adopted or exhausted emergency-level coping strategies, compared to 16 per cent and 19 per cent of returnees and the non-displaced, respectively. Most notably, a higher proportion of IDPs (10%) than returnees or the non-displaced (6% and 7%, respectively) reported that their households had had to ask strangers for money to cover essential needs. Similarly, 13 per cent of IDPs reported that their households had used degrading income source (illegal or high-risk jobs), compared to 9 per cent of returnees and 11 per cent of non-displaced.
In addition to dependence on humanitarian assistance, shelter-based strategies were comparably commonly reported among IDPs. Sixteen per cent of IDPs reported that their households had skipped rent payments in the 30 days prior to data collection, and 26 per cent reported that they had moved to poorer quality housing, compared to 6 per cent and 4 per cent, respectively, of the non-displaced having reported the same.
copings strategies underscores the continued resilience of IDPs and their households. As noted above, it may prove unsustainable over time, however, in the absence of alternative solutions, with negative repercussions on IDPs' ability to meet their needs in the long term.
The severity of strategies that IDP households had adopted or exhausted has not significantly increased since the last round, when 24 per cent of IDPs had reported their households to have adopted / exhausted emergency-level strategies (26% in the current round), and 38 per cent and 24 per cent, respectively, had reported the adoption / exhaustion of crisis- or stress-level livelihoods-based coping strategies (39% and 21% in the current round, respectively).
16 The classification of strategies into stress-, crisis-, and emergency-level strategies is based on the categories used by REACH and the World Food Programme in Ukraine in 2024. In the aggregate analysis, the proportion of respondents reporting their households to have adopted or exhausted stress-, crisis- or emergency-level livelihoods-based are mutually exclusive. They
17 The percentages shown reflect the proportion of respondents who reported that their households had adopted the mentioned coping strategies in the
needs (they do not include the exhaustion of coping strategies). Multiple answers possible.
18 Questions related to coping strategies were modified in Round 16 to address the reasons as to why respondents did not
1. a lack of need, 2. the exhaustion of this coping strategy, and 3. the unavailability of the
days prior to data collection to be able to
Figure 17: Most commonly adopted or exhausted livelihoods-based coping strategies (top 10), % by displacement status 17
Figure 18: Most commonly adopted livelihoods-based coping strategies over one year (Round 15 (December 2023) to Round 19 (December 2024, % of IDPs))18
2.4 COPING STRATEGIES BY SOCIO-ECONOMIC CHARACTERISTICS & MOBILITY
Table 7: Severity of livelihoods-based coping (% of IDPs reporting their households to have adopted or exhausted livelihoods-based coping strategies to meet basic needs in the 30 days prior to data collection, by severity level and socio-economic characteristics or mobility intentions)
IDPs more commonly reported that they or someone else in their household had adopted either crisis or emergency coping strategies (65%), compared to returnees (51%) and the non-displaced population (57%). Most of all, this concerned socio-economically vulnerable IDP households: households with chronically ill household members, with at least one person with disabilities, and low-income households were more likely than other IDP households to have relied on livelihoods-based coping strategies, often including more severe strategies, to be able to meet their basic needs.
Notably, IDPs in households with chronically ill members were particularly likely to have reported reliance on crisis-level coping strategies (reported by 43 per cent of IDPs in households with chronically ill members, compared to 37 per cent of IDPs in households without such members), mainly driven by a very high proportion of IDPs who reported their households to have reduced essential health expenditures in the 30 days prior to data collection (59%), or to already have exhausted this strategy (6%). Thus, households with chronically ill members may, in particular, face challenges in sustaining these costs and caring for ill household members in the long term.
Moreover, both IDPs in households with chronically ill members and IDPs in households with persons with disabilities, reported high levels of reliance on emergency-level coping strategies. Roughly a third of IDPs in such households reported the adoption or exhaustion of emergency-level coping
strategies, compared to a fifth of IDPs not in such households. This suggests that individuals in households with particularly vulnerable members may often be at a higher risk of resorting to particularly harmful or unsustainable strategies to be able to care for the entire household.
IDPs in low-income households were significantly more likely than IDPs in higher-income households to have reported reliance on crisis- or emergency-level coping strategies. They reported comparably high levels of reduction of health (61%, compared to 42%) and education expenditures (16%, compared to 11%), as well as having resorted to illegal or highrisk jobs (14%, compared to 11%) or having asked strangers for money (12%, compared to 5%). The latter may indicate a high risk of exposure of low-income IDP households to exploitative practices as they search for alternative or additional income sources to help them meet their needs.
Lastly, IDPs who planned to remain in their current locations, both in the short term and in the mid to long term, were less likely than other IDPs to report their households to have adopted or exhausted any of the strategies above. In turn, IDPs who planned to return were particularly likely to have reported reliance on emergency-level strategies, most notably having resorted to illegal or high-risk jobs (20%, compared to 6% to 11% among other IDPs). This may reflect economic pressure those considering return are experiencing.
2.5 REASONS FOR ADOPTING COPING STRATEGIES
Among IDPs who reported their households to have adopted any livelihoods-based coping strategies, the most commonly reported reasons for having done so were in order to access shelter (62%), food (55%) and healthcare (52%). Notably, IDPs living in households that were composed exclusively of IDPs were more likely to report access to shelter as a reason (63%) than those in households consisting of IDPs and non-IDPs (58%).
19: Reasons for adopting coping strategies
Figure
Ternopilska
Zaporizka23
A BRIEF NOTE ON THE METHODOLOGY
Unless noted otherwise, data cited in this report were compiled from Round 19 of the General Population Survey, dated as of 19 December 2024. The data presented in this report was commissioned by the International Organization for Migration (IOM) and collected by 64 enumerators employed by Multicultural Insights through screener phone-based interviews with 40,002 randomly selected respondents and follow-up interviews with 1,445 IDPs, 1,200 returnees, and 1,800 residents, using the computer-assisted telephone interview (CATI) method, and a random digit dial (RDD) approach, with an overall sample error of 0.49% [CL95%]. Round 19 of data collection was completed between 22 October and 19 December 2024. The survey included all of Ukraine, excluding the Crimean Peninsula and occupied areas of Donetska, Luhanska, Khersonska, and Zaporizka Oblasts. All interviews were anonymous, and respondents were asked for consent before starting the interview. IDP and returnee population figures at the national and oblast levels are derived from the July 2024 (updated as of September 27, 2024) total population baseline for Ukraine (excluding the Autonomous Republic of Crimea and Sevastopol as well as the semi-occupied and occupied regions of four oblasts; Donetska, Khersonska, Luhanska, and Zaporizka to ensure the accuracy of population estimates reported and its alignment with the survey sample coverage) defined in the United Nations Population Fund (UNFPA)'s Common Operational Datasets on Population Statistics (COD-PS). All numbers are rounded for ease of use. Estimated figures have been rounded to the nearest 1,000. All numbers are rounded for ease of use. Data collection was facilitated by Multicultural Insights. Additional analysis is available upon request to dtmukraine@iom.int
In this report, Internally Displaced Persons (IDPs) are defined as individuals who have been forced to flee or to leave their homes or who are staying outside their habitual residence in Ukraine due to the full-scale invasion in February 2022, regardless of whether they hold registered IDP status. The terms "return” and "returnee” are used without prejudice to status and refer to all people who have returned to their habitual residence after a period of displacement of minimum two weeks since February 2022, whether from abroad or from internal displacement within Ukraine. This definition excludes individuals who have come back to Ukraine from abroad but who have not returned to their places of habitual residence in the country. Full definitions of population groups may be found in the Methodological Note
Limitations: Those currently residing outside the territory of Ukraine were not interviewed, following active exclusion. Population estimates assume that minors (those under 18 years old) are accompanied by their adult parents or guardians. The sample frame is limited to adults that use mobile phones, in areas where phone networks were fully functional for the entire period of the survey. People residing in the Autonomous Republic of Crimea (ARC) or the occupied areas of Donetska, Zaporizka, Luhanska, and Khersonska Oblasts were not included in the survey. Estimates in Donetska, Zaporizka, and Khersonska Oblasts are likely under-represented as a result of coverage being limited to government-controlled areas and to the limited number of respondents reached in occupied areas. For further details on the methodology and sampling design, please refer to the full Methodological Note


dtmukraine@iom.int


https://dtm.iom.int/ukraine