THEMATIC BRIEF SERIES: LIVELIHOODS AND ECONOMIC RECOVERY
NOVEMBER 2024
Since the full-scale invasion of Ukraine in February 2022, the country has confronted profound economic disruptions alongside widespread displacement. As of 15 October 2024, 3.7 million people remain internally displaced (IDPs), while 4.4 million people who had been displaced have since returned to their primary places of residence.1 According to the World Bank, more than 9 million people in Ukraine are estimated to be living in poverty, an increase of 1.8 million people since February 2022.2 The pace of recovery in Ukraine is also projected to slow to 3.2 per cent in 2024 from 4.8 per cent in 2023, due to a smaller harvest and persistent labour shortages.3 With millions seeking safety and stability, often while remaining in displacement, the challenges of maintaining livelihoods and accessing social protection are paramount, necessitating focused interventions to mitigate economic hardships.
This thematic brief provides an overview of livelihoods in Ukraine, focusing on access to employment and exploring its relationship with displacement, returns, and mobility intentions. It aims to shed light
1 IOM, General Population Survey, Round 18
on how access to sustainable economic opportunities for displaced and conflict-affected populations may correlate with enhanced resilience, self-sufficiency, and autonomy. The brief includes an analysis of employment rates and trends from June 2023 to August 2024, key employment sectors, job security, and the impact of employment on displacement and mobility intentions. Additionally, it addresses unemployment levels, barriers to employment—notably for IDPs who have lost access to the IDP living allowance— and support needed to facilitate job access. The conclusive section provides a thematic focus on the so-called “silver economy”, specifically exploring employment opportunities for individuals approaching retirement age.4 The analysis foregrounds the age and gender dimensions, highlighting that priorities, capacities and needs are unique to different individuals and notably vary based on the intersection of vulnerabilities, exclusion and discrimination.
Key definitions can be found on page 12.
2 World Bank’s projections using the Ukranian national poverty line, based on the actual subsistence level, which was UAH 3,660.9 per month in 2019. Based on IOM estimates, approximately 20 million people live with a monthly household income per person below the minimum threshold defined by the Ministry of Social Protection (UAH 7,065).
3 World Bank, Ukraine Overview, accessed on 8/10/2024, available here
4 Silver Economy is the part of the general economy that are relevant to the needs and demands of older adults
KEY FINDINGS
Employment rate: In August 2024, the estimated employment rate among working age (18-60 years old) respondents was 67 per cent, a decrease of 6 percentage points compared to the situation before February 2022, with IDPs being the most affected by the decline in employment.5 The rate of employment was significantly lower in heavily conflict-affected or previously occupied areas such as Donetska and Mykolaivska Oblasts, where economic activities remain severely disrupted by the war.
Gender-related employment trends: Women of working age were less likely to be employed (63%) compared to men (72%). Gender differences in employment rates were significantly higher among IDPs compared to other groups, with the share of employed IDP men being 23 percentage points higher (71%) compared to IDP women (48%). While data suggest a persisting gender segregation of sectors of employment, the labour market appears to be undergoing a broad, likely war-related transformation in terms of women’s employment options, with only 5 per cent of women looking for a job reporting being interested in the education sector, which currently employs 20 per cent of female workers. Additionally, only 5 per cent of women reported looking for a job in the same sector where they were working or used to work, compared to twice as many men (10%).
Employment as a driver of returns: While insecurity remained the primary driver of displacement, employment played a critical role in influencing movement within Ukraine for both IDPs and returnees. Notably, lack of job opportunities was the most reported reason for returnees to have left their previous location (31%) and was reported by 41 per cent of respondents who returned to Donetska Oblast and 39 per cent of those who returned to Zaporizka Oblast, indicating that livelihoods-driven returns are happening in acutely conflict-affected areas.
Unemployment: Among the current population in Ukraine, 11 per cent of working-age individuals reported being unemployed at the time of data collection, while 22 per cent were outside of the labour force: individuals engaged full-time in housework and caregiving (8%); retirees and pensioners (6%); workers on parental leave (4%); people who are permanently sick or disabled (3%); and students (2%). Approximately 5 per cent of respondents were unemployed and looking for a job (1,100,000 individuals). Unemployment appeared to be higher in rural areas (12%, compared to 8% in large cities) and acutely conflict-affected oblasts, with the highest values being recorded in Khersonska (22%), Kharkivska, Mykolaivska and Sumska (all at 19%), and Donetska (18%) Oblasts.
Displacement-related unemployment trends: Working-age IDPs recorded a higher rate of unemployment (15%), as well as a higher proportion of unemployed individuals looking for a job (61% of the unemployed, compared to 50% of unemployed returnees and 44% of non-displaced). IDPs who had been recently displaced were more likely to be unemployed (24%), compared with those who had been displaced for one year or more (13%). Similarly, individuals who had recently returned to their area of origin were more likely to be unemployed (19%), compared with those who had returned over one year before data collection (7%).
Barriers to employment: The most significant challenges reported by job seekers in Ukraine were the lack of jobs in their area (30%) and low salaries (29%). Women, especially those aged 36-45, faced gender-specific challenges such as balancing work with family responsibilities, lack of childcare support, and age-related discrimination. The limited availability of jobs was reported by 39 per cent of respondents in rural settlements, compared to 28 per cent in large cities, reflecting the limited labour demand in rural areas.
Silver economy: Access to the labour market for older individuals is part of the government strategy for economic resilience during wartime, as individuals of pre-retirement age struggle to find employment, especially when displaced. Individuals aged 55-59 were found to encounter significant age-based discrimination and have lower employment rates than younger age groups (58%, compared to 70% among younger individuals).
5 The official employment rate in Ukraine is 53%, i.e. 12.3 million workers are currently employed. The discrepancy compared to the GPS data can be explained with the use of a different definition of workforce, as official data define the bracket 15-70 years old as working age, compared to 18-60 in the GPS analysis. Additionally, the GPS questionnaire also captures temporary/casual work (which is not necessarily recorded in official statistics and was estimated concerning 876,000 individuals) and informal work (approximately 1,595,000 individuals).
2. EMPLOYMENT
When asked about their employment status prior to the full-scale invasion, 73 per cent of working-age respondents reported having been employed before February 2022.6 In August 2024, this rate had decreased by 6 percentage points, with 56 per cent of respondents aged 18 to 60 being in paid employment and 11 per cent being self-employed or running a family business.7 Eleven per cent of respondents reported being unemployed at the time of data collection, while the remainder fell into categories outside the labour force:
individuals engaged full-time in housework and caregiving (8%); retirees and pensioners (6%); workers on parental leave (4%); people who are permanently sick or disabled (3%); and students (2%).
Working-age IDPs were significantly less likely to be employed (56%, including both paid work and self-employment) compared to returnees (69%) and the non-displaced population (68%).
GENDER AND AGE ANALYSIS
Employment rates varied significantly among the workingage population based on gender, with 72 per cent of working-age men being employed, as opposed to 63 per cent of women. This variation was driven by the important difference in the proportion of men and women who reported being self-employed (15% and 8% respectively), which may point at gender barriers to women’s entrepreneurship.
Gender differences in employment rates were significantly higher among IDPs compared to other groups, with the share of employed IDP men being 23 percentage points higher (71%) compared to IDP women (48%). Conversely, a quarter (25%) of working-age IDP women reported either being on parental leave (10%) or being engaged full-time in housework and care work, including childcare (15%), as opposed to 3 per cent of IDP men. This proportion rose to 39 per cent in the case of IDP women aged 25 to 35 years, i.e. the group with the highest probability of having a child up to 5 years old (50%). The proportion of working-age IDP women engaged in domestic and care work was considerably higher compared to returnees (18%) and the non-displaced population (14%) and contributes to explain the lower rate of employment. As the proportion of women living in single-parent households with children up to 5 years old was also higher among IDPs (21%) compared to returnees (14%) and the nondisplaced population (10%), IDP women appear to be more likely to be the only carers of very young children and, hence, unable to engage in paid work.
6 Based on data collected through the General Population Survey in December 2023.
GEOGRAPHY AND TYPE OF SETTLEMENT
Levels of employment varied significantly across the country, with rural areas recording lower employment rates among the working-age population (53%) compared to large cities (76%). While this variation may be a consequence of the generally older demographic profile of the population in rural areas (including among the working-age population), it also reflects the general lack of jobs in this type of settlements as reported by KIs, who highlighted the need for individuals residing there to move to nearby urban centers to find employment.8 This reflects a broader pattern of internal migration that pre-existed the fullscale invasion and caused the rural population to decrease by 11.6 per cent between 2010 and 2020, primarily due to youth migration.9
The employment rate was found to be lowest in Donetska (48%) and Mykolaivska (51%) Oblasts, where economic activities were severely disrupted by the war: “Almost all enterprises have been destroyed or damaged, and there is no work in the community, except for municipal institutions.” “Agricultural activities were suspended due to mined fields, businesses closed due to destruction” (KIs, Mykolaivska Oblast).
According to the State Statistics Service of Ukraine, in 2020, 28 per cent of the employed population in Mykolaivska Oblast were engaged in agriculture.10 By contrast, the highest employment rate was recorded in Kyiv city, where 80 per cent of working-age individuals were employed.
These findings highlight the importance of promoting inclusive and sustainable livelihoods programming that considers the diverse needs of Ukraine’s population. Notably, given the high rates of domestic and other caring work among IDP women, particularly those in single-parent
7 Henceforth, and unless otherwise indicated, the analysis will use the term “employed” to encompass both individuals in paid work for an employer and those self-employed.
8 For more information on the KI interviews, see the section ‘Methodology’ at page 13.
9 In 2019, the age group of 15–19 years accounted for 43 per cent of the rural population’s negative migration surplus. See IOM, 2021 migration in Ukraine, available here
10 SSSU, 2020 Labour Force of Ukraine, 2021, available here
Figure 1: % of respondents reporting their employment status in the 7 days prior to data collection (top 5 options), by displacement status (respondents aged 18-60)
households, it is paramount to prioritise childcare support and family-friendly workplace policies in programming, while facilitating women’s employment. Additionally, taking into consideration the low levels of employment in rural areas and acutely conflict-affected regions, interventions should support job creation initiatives, as well as reconstruction and investment programs aimed at reviving local businesses, agricultural and economic activities.
2.1 TREND ANALYSIS
At national level, no major changes were recorded since June 2023, which could point at a stabilisation of the employment situation after the steep decline in 2022-2023.
IDP employment increased by 7 percentage points compared to June 2023, although remaining 18 percentage points lower than pre-February 2022 levels (74%). By contrast, the employment rate remained generally stable for returnees and the non-displaced population compared to June 2023.11
GEOGRAPHY AND TYPE OF SETTLEMENT
The Central12 and Western13 macro-regions witnessed a marginal increase in employment rates between June 2023 and August 2024, with a positive variation of 5 and 6 percentage points respectively, while the situation remained largely unchanged in the rest of Ukraine. With only a 1 percentage point increase in the employment rate compared to June 2023, in August 2024, the Eastern macro-region14 had become the area with
2.2 SECTORS OF EMPLOYMENT
The service sector was the primary sector of employment in Ukraine, with approximately one quarter (24%) of employed individuals employed working in it, followed by the educational and academic sector (14%) and the wholesale and retail trade sector (11%).
GENDER AND AGE ANALYSIS
Women appeared to concentrate in certain sectors, with services, trade and education accounting for 58 per cent of the female working population, while in the case of men the top three sectors (services, construction and logistics) employed 45 per cent of male workers. This indicates a limited diversification in the employment options for women which limits their employability, while at the same time contributing to a labour market mismatch (see below). Hence, it is crucial to support women’s access to sectors traditionally occupied by men, by vocational training, career counselling, and community-level discussion on social and gender norms.
Figure 2: % of working-age respondents (18-60) reporting being employed (either as employees or self-employed), by displacement status and time
IDPs Returnees Non-displa
the lowest employment rate (64%). Notably, after a remarkable drop in the employment rate after the full-scale invasion (recorded at 30% in June 2023), Donetska Oblast experienced a recovery between June 2023 and April 2024, when the employment rate peaked at 66 per cent, to then decrease by 27 per cent between April and August 2024, when it reached 48 per cent of the working-age population, the lowest rate observed across Ukraine.15
“People are also leaving state institutions because the salary is 5400 UAH — only two women from the executive committee left to mobilize, and women also left the labour protection service.”
“There are also delays in salaries, since spring, in municipal and state institutions.” (KIs, Dnipropetrovska oblast)
Education, in particular, appeared to be a predominantly female sector, with 21 per cent of female workers being employed in this sector, compared to 6 per cent of male workers. Considering women’s higher engagement in areas with a strong presence of the public sector (such as education and healthcare), they are likely to be disproportionally affected by the low salaries and delays in payments in public institutions highlighted by KIs.
11 Based on data collected through the General Population Survey in December 2023. It should be noted that the estimated variation in the employment compared to the period before the full-scale invasion in February 2022 is indicative only, as the levels of employment were assessed in a different way. To assess the level of employment pre-February 2022, respondents to the GPS Round 15 were asked the question ”Did you do any paid work within the last 30 days before February 24, 2022?”. By contrast, this question was phrased differently to assess current employment, in both Round 15 and Round 17: ” How would you describe your employment status in the last seven days?”.
15 Variations in the employment rate at oblast level should be considered indicative only.
Figure 3: Among respondents employed (in paid work or self-employed), % reporting sector (top 5 sectors), by gender
2.3 INFORMAL EMPLOYMENT AND LABOUR EXPLOITATION
Overall, the population in paid work16 reported high levels of security of employment, with 81 per cent reporting being engaged in permanent employment. Yet, a still notable 18 per cent reported being engaged in either temporary (6%) or informal (12%) employment. Among the sectors mentioned by respondents, prevalence of informal employment was found to be highest in construction (34% of respondents), the food industry, and agriculture (both at 20%).
Despite this relative stability, potential indicators of labour exploitation were found to be prevalent in the country, suggesting that the reduced economic resilience of many Ukrainians due to the war is increasing their susceptibility to exploitative employment practices. Indeed, in Round 16 of the GPS, 42 per cent of respondents in paid work reported having had to work very long hours during the 12 months prior to data collection,17 while 22 per cent reported having worked without a contract or with a contract that did not cover all working hours.
IDPs and returnees reported comparatively lower security of employment, with higher rates of casual (both 10%) and informal (16%
GENDER AND AGE ANALYSIS
Women in paid work were found to enjoy higher security of employment compared to men, especially among IDPs where precariousness of employment was generally higher. IDP men were more likely to be engaged in casual or informal types of employment (35%, as opposed to 20% IDP women), as well as to be employed under exploitative modalities, with 64 per cent of men in paid work having reported potential indicators of labour exploitation compared to 45 per cent of women respondents.21
The youngest age group (18-24) most commonly reported being engaged in informal (28% of those in paid work) and temporary (12%) work, which may reflect a limited availability of stable jobs for workers
of IDPs and 14% of returnees) labour compared to the non-displaced population (5% and 11% respectively). Additionally, in Round 16 of the GPS (April 2024), half of IDPs in paid work reported having worked without a contract during the previous year (49%, as opposed to 38% of returnees and 42% of non-displaced), while approximately one third reported having had to work very long hours (31%, as opposed to 21% for both returnees and non-displaced), suggesting a higher vulnerability of IDPs to exploitative practices.18
Higher proportions of respondents in southern oblasts19 reported experiencing at least one such incident in the 12 months prior to data collection, particularly in Odeska (69%) and Mykolaivska (54%) Oblasts.20 The sectors in which respondents most frequently reported potential indicators of labour exploitation included trade, manufacturing, construction, forestry, and agriculture.
The type of education seemed also to be correlated with security of employment, with graduates from higher education being most likely to report being in a permanent job (89%), and least often reporting being engaged in informal work (5%).
with limited to no experience. Similarly, younger individuals were most likely to report potential indicators of labour exploitation (68% of those in paid work). Displacement status and age intersected to determine a heightened vulnerability of young IDPs and returnees to labour exploitation. Specifically, 76 per cent and 72 per cent, respectively, of 1824 year-old IDPs and returnees in paid work reported having experienced at least one potential indicator of labour exploitation, compared to 66 per cent of 18-24 year-old non-displaced individuals.22 The prevalence of informal and temporary jobs was relatively low in the 60+ age group (9% and 5% of employees) and overall in line with other age groups, indicating that elderly workers likely continue their jobs beyond retirement age, as opposed to engaging in casual work after retirement.
2.4 RELATIONSHIP BETWEEN EMPLOYMENT AND DISPLACEMENT23
Conflict dynamics and insecurity continued to be the main determinants of displacement in Ukraine. However, livelihood, opportunities and lack
DISPLACEMENT
18 per cent of displaced respondents mentioned that they had left their previous location due to the inability to earn money or find a job, making it the second most reported push factor after the security deterioration in the area of origin (86%), while 22 per cent stated that the presence of livelihoods opportunities in their current location had been the main reason to move there. Among IDPs, households with vulnerable members were less likely to report having moved to their current location due to better work opportunities.24
Livelihoods opportunities were most mentioned as the main reason for moving to their current location by IDPs residing in Kyiv city (31%), Dnipropetrovska and Kharkivska Oblasts (both 27%) and in general were more reported by IDPs living in large cities (28%) compared to rural areas (13%).25
16 This only refers to individuals who reported working for an employer, not as self-employed.
17 I.e. more than 8 hours a day and/or more than 40 hours per week.
18 This information was collected in Round 16 of the GPS, February/March 2024.
19 Khersonska, Mykolaivska, Odeska Oblasts.
20 Representative data were not available for all oblasts.
21 IOM, GPS Round 16.
22 IOM, Vulnerability to trafficking in persons and labour exploitation in Ukraine, June 2024, available here
thereof contributed to influence movement within Ukraine for both IDPs and returnees.
RETURNS
Inability to earn money and find adequate employment was the most reported reason for returnees to have left their previous place of residence (31%), indicating the importance of livelihoods considerations as a key driver of returns. Notably, this was reported by 41 per cent of respondents who returned to Donetska Oblast and 39 per cent of those who returned to Zaporizka Oblast, as well as approximately a third of returnees in Khersonska (32%) and Sumska (36%) Oblasts, indicating that livelihoodsdriven returns are happening in acutely conflict-affected areas.
While the availability of better livelihoods opportunities was only the third most reported reason for returning to the place of origin, after sentimental reasons (49%) and proximity to friends and family (44%), it was still reported by more than a third of returnees (39%), confirming
23 The following sections outline the key findings for the subsets of employed and unemployed respondents. To ensure that all individuals who self-reported as employed or unemployed are included, the analysis was conducted for the whole subsets, regardless of working age.
24 Livelihoods opportunities as the main primary reason for moving to the current location were reported to a lower extent by people living in households with elderly (12%), people with disabilities (15%) and chronically ill people (17%), as well as single-parent households (14%) and households only composed of women and children (16%).
25 Representative results were not available for all oblasts.
that economic concerns are influencing returns. This was mostly reported by individuals returning to large cities (41%, as opposed to 25% of returnees in rural areas) and was notably mentioned by approximately half of returnees in Kyivska Oblast (48%), followed by Kyiv City (44%) and Zaporizka Oblast (43%).26
EMPLOYMENT AND MOBILITY INTENTIONS
Unemployed individuals appeared to be less interested in remaining in their current location both in the short and the long period. While the majority of those who were currently unemployed still planned to remain in their location in the following three months (87%) and beyond,27 this proportion was lower compared to respondents in paid work for an employer (95%).
According to UNHCR’s regional intentions report, livelihoods also influence return intentions for refugees (displaced outside of Ukraine). Notably, refugees were found to be more likely to be planning or hoping to return if not participating in the labour force in the host country. In the hypothesis of an end to the full-scale war, access to
3. UNEMPLOYMENT
Among the current population in Ukraine, 11 per cent of working-age respondents were unemployed. Of these, 48 per cent were unemployed and actively looking for a job, while the remaining unemployed respondents were not looking for work at the time of data collection. Among this second subset, the most reported reasons why individuals were not looking for a job were lack of jobs in the area (29%), sickness (21%), household and caring responsibilities (21%), followed by lack of sufficient child or elderly care support (11%) and low salaries (10%).
Working-age IDPs were marginally more likely to be unemployed (15%), compared to the other population groups (11% of returnees and 10% of the non-displaced population). For both IDPs and
Figure 4: % of returnees reporting top 3 reasons for leaving the previous place of residence and for returning to the area of origin
work was found to be the top factor that would positively influence the decisions of refugees and internally displaced people to return. By contrast, concerns about economic opportunities in the areas of return were among the main obstacles reported by those who would not return even if the full-scale war came to an end.28
returnees, unemployment seemed to be higher for recently displaced or returned individuals. Among those who had been displaced or had returned within the previous year, 24 per cent of IDPs and 19 per cent of returnees reported being unemployed. In contrast, only 13 per cent of IDPs and 7 per cent of returnees who had been in their current location (whether an area of displacement or their place of origin) for more than a year were unemployed.
Working age IDPs who were unemployed were significantly more likely be looking for a job (61%) compared to other population groups (50% of returnees and 44% of non-displaced), possibly indicating that a higher percentage of IDPs find themselves unwillingly unemployed, as opposed to being intentionally outside of the labour market.
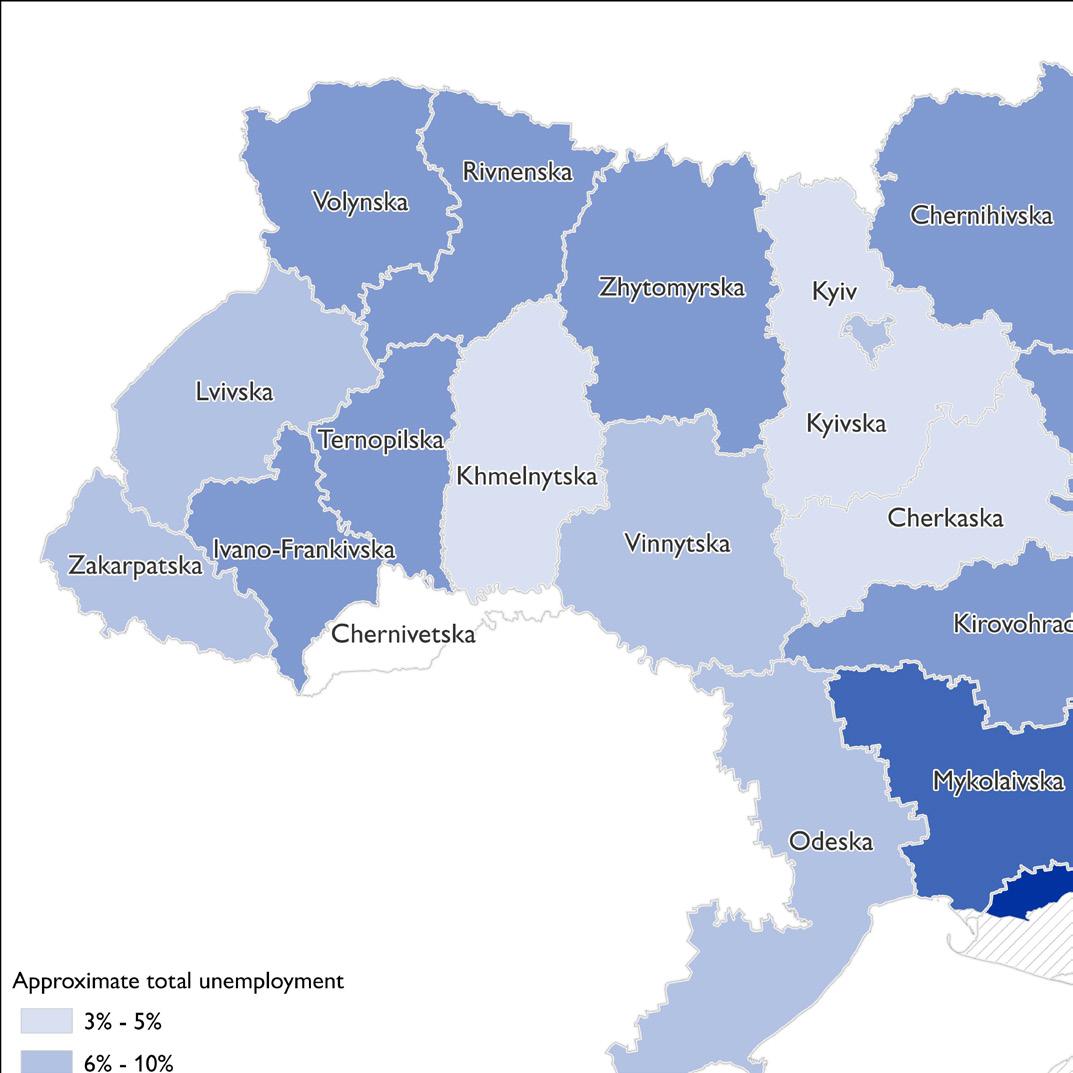
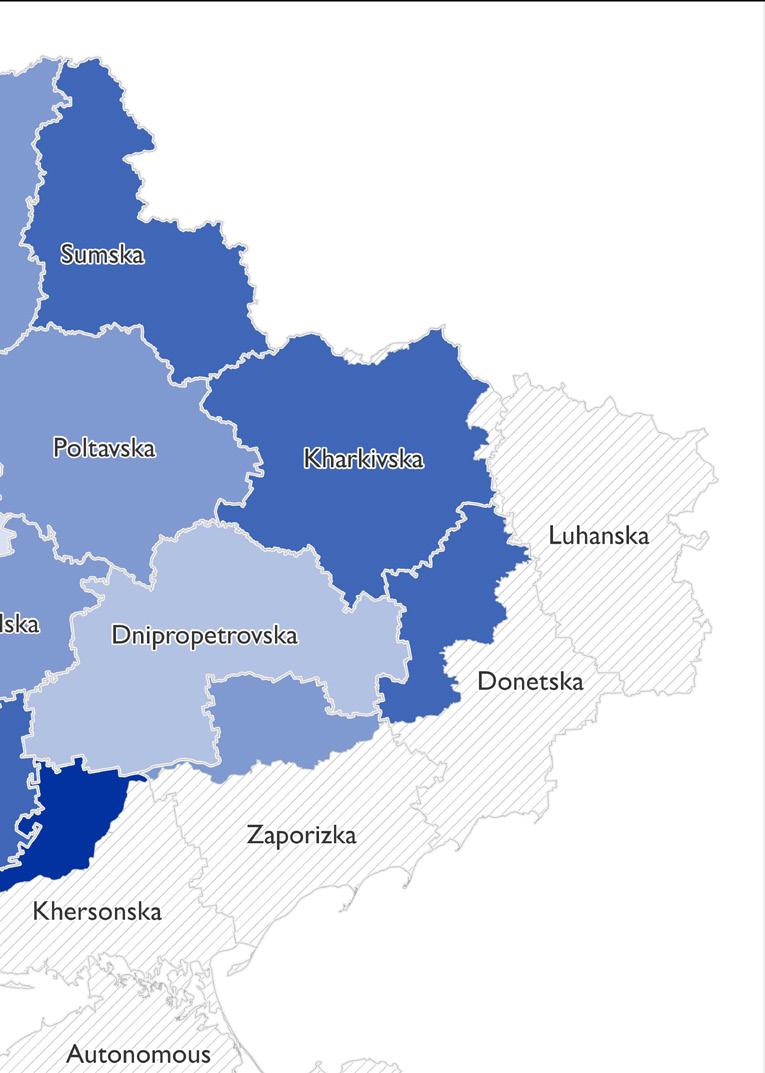
Map 1: Proportion of working-age individuals reporting being unemployed during the 7 days prior to data collection, by oblast
26 Representative data were not available for all oblasts.
27 The question about long-term intentions was only asked to IDPs.
28 UNHCR, Lives on hold: intentions and perspectives of refugees, refugee returnees and IDPs from Ukraine, February 2024, available here
GENDER AND AGE ANALYSIS
The unemployment rate did not vary significantly between working-age men (10%) and women (11%). However, unemployed men were more likely to be actively looking for a job (52%) compared to unemployed women (45%), while the proportion of unemployed individuals actively looking for work decreased with age, from 60 per cent among the 18-25 age group to 45 per cent among respondents above 55 years.
GEOGRAPHY AND TYPE OF SETTLEMENT
Unemployment appeared to be higher in rural areas (12%, compared to 8% in large cities) and acutely conflict-affected oblasts, with the highest values being recorded in Khersonska (22%), Kharkivska, Mykolaivska and Sumska (all at 19%), and Donetska (18%) Oblasts.
4. INDIVIDUALS SEEKING EMPLOYMENT
Overall, 15 per cent of the Ukrainian population, regardless of age and employment status, were actively looking for a job at the time of data collection. This section provides an overview of the information channels, sectoral preferences and barriers reported by this subset of the population. It intentionally expands the analysis to include individuals who did
not report themselves as being unemployed but were nevertheless actively looking for a job, as well as people older than the working-age threshold (60+), with the aim to provide a comprehensive overview of the opportunities and challenges encountered by all individuals currently looking for a job in Ukraine.29
Among the unemployed population (regardless of age), approximately half (49%) reported being actively looking for a job. Interest in re-entering the job market was high also among individuals currently out of it due to childcare (28%) and care for people who are sick or with disabilities (22%), as well as those on parental leave (23%), and was reported by 16 per cent of people permanently sick or disabled and 6 per cent of pensioners. In total, 1,441,000 individuals currently inactive due to the above-mentioned reasons intended to re-enter the labour market, which should be added to the 1,232,000 unemployed individuals actively looking for a job. This is likely to result in a strong pression on the labour market to provide accessible jobs, including for categories such as women re-entering the job market after maternity leave and the elderly.
The services sector (18%) and the trade sector (15%) were the preferred areas where those actively looking for a job planned to look for employment in the following 12 months.30 Interestingly, while the information and communication (ICT) sector was reported as the sector of current employment only by 3 per cent of respondents, it was the third most popular sector among those looking for a job (9%), with this percentage being driven by the high proportion of respondents aged 25-35 who expressed interest in this field (16%).31 In a survey conducted with business owners, information and telecommunications companies reported the highest labour shortages, with 72 per cent of assessed ICT companies reporting lacking skilled workers.32 This highlights a clear need for additional training in this sector.
All
for a job, regardless of their employment
30 This refers to everyone who reported being looking for a job, irrespective of whether they were currently employed.
31 Data for the age group 18-25 is not representative, hence it is not presented here.
32 Employers Survey, Ministry of Economy, April 2024
33 Only employment status options for which representative data at this level are available are included.
29
respondents were asked about whether they were actively looking
status. Hence, both those who were currently working (employed or self-employed), those who were unemployed, and those who were currently out of the labour market (e.g. because busy full-time with child-care, or pensioners) were asked whether they were looking for a job.
Figure 5: % of individuals actively looking for work, by employment status (all age groups)
Figure 6: Among those actively looking for a job, % reporting sector in which they were looking for a job in the 12 months following data collection, by top 5 most reported sectors and employment status33
Overall, the majority of individuals looking for a job reported finding information about vacancies via specialised websites or apps (such as work.ua) (78%) and through personal connections (30%). Among unemployed respondents, only 13 per cent relied on the State Employment Service to find information about available jobs.
Reliance on word of mouth from family and friends was considerably higher for the non-displaced population (32%) compared to IDPs (20%). The low levels of IDPs’ reliance on personal connections to obtain information about jobs were primarily driven by women seldom reporting this channel (16%), which may reflect the lack of this type of information in their social circles, as well as limited social capital and connection to employers.
GENDER AND AGE ANALYSIS
Among the top 3 most reported sectors where job seekers were looking for employment, a higher proportion of women preferred the services (23%) and trade (21%) sectors compared to men (12% and 8% respectively). Among men, the construction sector was the preferred one, mentioned by 19 per cent of male respondents, as opposed to 1 per cent of women, followed by the transport sector (10% of men, compared to 3% of women).
4.1 BARRIERS TO EMPLOYMENT
Figure
While these preferences suggest a persisting gender segregation of sectors of employment, the labour market appears to be undergoing a broad, likely war-related transformation in terms of women’s employment options, with only 5 per cent of women who were looking for a job reporting being interested in the education sector, which currently employs 20 per cent of female workers. Additionally, only 5 per cent of women reported looking for a job in the same sector where they were working or used to work, compared to twice as many men (10%).
Among those actively looking for work, lack of jobs in the area (30%) and low salaries (29%) were the most reported challenges.
Figure 8: Among those actively looking for a job, % reporting 3 main challenges faced (top 5 most reported options), by employment status34
While respondents generally reported similar challenges regardless of displacement status, 9 per cent of IDPs mentioned that their search for a job was hindered by discrimination based on displacement status. This was most reported by IDP women (11%) than men (4%), and more often in large cities (12%) than rural areas (7%).
According to IOM’s brief ‘Social cohesion and public trust’, higher rates of unemployment among IDPs may partly be due to discrimination encountered during the job search, with almost half (42%) of IDPs interviewed who were actively looking for jobs reporting employers were reluctant or unwilling to hire IDPs, a significantly higher proportion compared to the data presented above.35 This seeming
34
discrepancy may indicate that, while this type of discrimination is relatively a less formidable challenge compared to the unavailability of jobs (reported by 28% of IDPs) or the low salaries (25%), it is still perceived as compounding other challenges to further limit IDPs’ access to employment or, if employed, the conditions of work.
GENDER AND AGE ANALYSIS
Age seemed to be correlated differently to different types of barriers. On one hand, the percentage of those reporting low wages as an obstacle to employment increased with age, reaching the highest point at 51 per cent among the age group 46-49, which may indicate the lack of highly qualified jobs
matching the skillset of this age group and their salary expectations, as well as a resistance by employers to hire older adults for this type of positions. On the other hand, 10 per cent of the age group 25-35 reported being offered informal or exploitative employment, which was reported by no more than 4 per cents of individuals belonging to any of the older groups and reflects the higher exposure of younger workers to informal and exploitative work.
Discrimination by age was also reported by 20 per cent of respondents overall, primarily driven by respondents aged 50+, and by 43 per cent
of pensioners specifically, and will be addressed in another section. However, a remarkable proportion of individuals aged 36-45 (10%) also reported facing age-based discrimination. Notably, this was reported by 16 per cent of women but no men in this age group, pointing at an important gender-based discrimination of women based on age. This phenomenon might particularly affect women re-entering the job market after maternity leave, considering that 38 per cent of women from this age group reported having at least one child aged 1-5 in their household and that maternity leave in Ukraine customarily covers the first three years of the child.
While gender discrimination as a barrier to finding a job was virtually never reported, other gender-specific barriers were mentioned. Women most commonly reported obstacles related to the inability to balance work and family responsibilities, such as the lack of sufficient child or elderly care support (reported by 19% of women aged 25-35) and housework (18% of women aged 25-35). KIs stressed that kindergartens are currently either closed or not open full-time, while primary schools are still operating in remote modality, thus leaving women with no possibility to work unless they can rely on someone else for childcare.
Female respondents also reported lack of work schedule flexibility as a key barrier to employment (15%), which reflects the limited proportion of employed women who were working remotely (7%) or in a hybrid modality (18%) at the time of data collection. The fact that rates of hybrid and remote work did not vary meaningfully based on the gender of the worker indicates a lack of accommodation for
GEOGRAPHY AND TYPE OF SETTLEMENT
The limited availability of jobs was reported by 39 per cent of respondents in rural settlements, compared to 28 per cent in large cities, reflecting the limited labour demand in rural areas highlighted by KIs:
“In rural areas, there was no work even before the war” (KI, Zhytomyrska Oblast)
If job opportunities remain limited in smaller communities, irregular public transportation services and the lack of extended childcare prevent many workers from commuting to neighbouring cities:
EMPLOYMENT OF VETERANS37
58 per cent of working-age veterans were employed, compared to 67 per cent of the general population. Veterans more often reported being pensioners (19%), including receiving pensions due to sickness, and being permanently sick or disabled (7%). By contrast, the rate of unemployment of veterans (10%) was virtually the same as for the general population (11%). However, the proportion of working-age veterans who were actively looking for a job (42%) was significantly higher compared to the
36 Results by gender were otherwise not representative for most macro-regions.
the traditionally higher share of care and housework shouldered by women, as reflected in the fact the women more often reported lack of flexible options as an obstacle to finding a job. However, an important difference was observed in the case of IDPs, where 22 per cent of employed women reported working completely remotely, compared to 8 per cent of men.
Men also faced a clearly gendered barrier, in the forms of concerns related to mobilisation, reported by 14 per cent of male respondents. These concerns were commonly expressed in the Eastern macroregion, where 22 per cent of men indicated fear of enlistment as a key barrier to employment.36
“Given that employment takes place through the Civil Defense Center and, accordingly, with certificates from the military commissariat, a significant number of people will not be ready for employment, especially potential recruits” (KI, Ternopilska Oblast)
“There are no jobs in the community. Although there are jobs available in the vicinity of the community, people face many obstacles, such as bus schedules that do not coincide with the end of the working day at most enterprises and no extended day care for schoolchildren in the community schools, so one of the parents needs to be close to home”. (KI, Zhytomyrska).
On the other hand, KIs also reported that men tend to avoid moving outside of their community due to fear of enlistment. Hence, gendered challenges intersect with the limited availability of job opportunities in rural areas to determine higher rates of unemployment.
average (18%). Among those looking forwork (irrespective of age), the most reported barrier to finding employment was low salaries (45%, compared to 29% individuals overall reporting it). Notably, veterans were roughly twice as likely to report sickness (14%) and disabilities (7%) as key barriers to employment compared to the general population (7% and 4% respectively). Finally, 6 per cent of this group reported being offered informal or exploitative employment, compared to 3 per cent overall.38
37 Any individual who reported having been directly involved in the execution of official military tasks since April 2014 was considered a veteran.
38 Data on barriers to employment for veterans are indicative only.
Figure
4.2 LABOUR MARKET DYNAMICS
As highlighted in the September Monthly Macroeconomic and Monetary Review by the Bank of Ukraine, labour supply remains tight due to the impact of the war, resulting in increasing shortages of workers, which in turn are putting upward pressure on wages.39
The seeming contradiction between shortage of workers, on one hand, and lack of jobs being a commonly reported barrier to employment, on the other, seems to point at a mismatch of labour supply and demand. Men’s mobilisation in the armed forces, together with displacement within and without Ukraine, have resulted in shortages in the workforce and a shift in its demographic composition, limiting working age individuals’ and especially workingage men’s participation in the labour market. As women and older workers are not filling the gap in traditionally men-dominated fields, this negatively impacts the businesses’ ability to operate, which may result into their scaling down activities and a consequent reduction in the labour demand.
“The community’s economy has collapsed, the dairy is closed, agriculture and enterprises are operating at a minimum level because they cannot hire men because of the military registration and enlistment office, women do not work there, it is hard work.” (KI, Kharkivska Oblast)
According to KIs, shortage of labour was particularly intense in factories, mining and processing plants, agriculture, utilities (water supply, electricity, gas) and hospitals.
“The jobs used to be mostly at the Mining and Processing Plant (MPP), but [… ] if there are vacancies there, they require both special knowledge and skills and manpower.” (KI, Zhytomyrska Oblast)
By contrast, Kis highlighted that the demand for other specialisations, such as lawyers, economists, and bankers fell, resulting in the inability for these workers to find employment in their sector, while at
4.3
the same time they may be unwilling to accept low-skilled jobs. The mismatch between specialisations in demand and the actual training of the workforce may be related to a decline in popularity of technical professions, with the youngest age group (18-24) being half as likely to have pursued technical or vocational training (14%) compared to the oldest generations.40 As pointed out by one KI, “there are vacancies in the community, but there are no people with the appropriate education. There is a need for technical professions” (KI, Odeska Oblast).
KIs often explicitly referred to ‘male vacancies’, highlighting the clear gender segregation of certain sectors, as well as its impact in terms of labour market dynamics: “Currently, my business is suffering due to active mobilization. There is an urgent need for tractor drivers and other male vacancies” (KI, Zaporizka Oblast). At the time of writing, skilled trades and manufacturing, which is traditionally dominated by men, was the most popular category per number of vacancies published on the specialised job search website work.ua, with approximately 19,000 vacancies across Ukraine. Within this category, the majority of vacancies were for the construction industry and woodworking sector. For reference, only 2 per cent of the female workers interviewed for the GPS were employed in the field of construction.
According to interviews conducted by REACH with business-owners in Chernihivska Oblast, businesses would be increasingly seeking to hire women to replace positions previously held by men.41 This information was mirrored by KIs interviewed for IOM’s MaNA assessment, who mentioned that the current mismatch in the labour market will force women to enter new professional areas. However, persisting gender segregation by sectors of employment, combined with lack of adequate childcare facilities, represent major obstacles that could determine the failure of these expectations. Hence, it is paramount that livelihoods initiatives integrate an in-depth understanding of gendered experiences and barriers in the labour market to ensure effective programming.
LOSS OF IDP LIVING ALLOWANCE AND BARRIERS TO EMPLOYMENT
Changes to Resolution #332, which came into effect in March 2024, introduced new criteria for eligibility to the IDP monthly living allowance, focusing on factors such as income level, employment status, and specific vulnerabilities.
Over one-third (39%) of IDPs reported having lost access to the allowance following the amendments in March 2024. Among working-age IDPs who lost access to the allowance, 15 per cent were unemployed (i.e. approximately 188,000 individuals), with 9 per cent being unemployed and looking for a job and 6 per cent not being looking for a job.
Among unemployed IDPs who lost access to the living allowance, as among the general population, the two most reported barriers to employment were low salaries (31%) and lack of jobs in the area (25%). However, the proportion of IDPs reporting that low salaries prevented them from entering the labour market was significantly higher among
39 Bank of Ukraine, Monthly Macroeconomic and Monetary Review; September 2024, available here
40, 41 34% of respondents aged 46-59 and 33% of respondents aged 60+.
42 IOM, Social cohesion and public trust, December 2023, available here
individuals who had lost access to the IDP allowance compared to those who were still receiving it (15%), indicating a greater concern that the salary scale for jobs available to this sub-group is inadequate to sustain livelihoods. Additionally, IDPs who lost access to the allowance more commonly reported having been offered informal or exploitative work (5%) than those who were still receiving it (1%), which may result from the increased urge to find a job following the loss of the allowance.
Finally, all IDPs who reported receiving the living allowance before March 2024, regardless of whether they had maintained or lost access to it, were more likely to report discrimination based on displacement status as a key barrier to employment (reported by 12% and 10% respectively), as opposed to IDPs who never received it (3%). This finding seems to confirm previous analysis on social cohesion from the GPS (Rounds 13 and 14), which highlighted social tensions over access to assistance and stressed that they may result in increased incidents of discrimination.42
4.4 SUPPORT NEEDED TO FIND EMPLOYMENT
Among those actively looking for a job, one quarter (24%) mentioned not needing any support to find work.43 This varied significantly across population groups, with the non-displaced population being more likely to report not needing any support (28%) compared to IDPs (14%) and returnees (20%). Across the board, learning new skills/qualifications (20%), a foreign language (20%) (primarily English), and computer literacy (16%) were reported as areas where support is needed.
The majority (60%) of those looking for a job reported having considered changing their profession or learning new skills to adapt to the demands of the local market. This willingness to adapt appeared to be negatively correlated with the age of the respondent, as it was reported by 76 per cent of individuals aged 25-35, compared to 52 per cent of the group 46-59.
Overall, information and communication technology was the most popular area in which people who were actively looking for a job would like to receive training (21%), reflecting the above-mentioned preference for the ICT sector by job seekers, followed by the area of business and entrepreneurship44 (10%). While the popularity of ICT was consistent across all displacement-status groups, returnees most often reported construction and infrastructure45 as their second preferred area for training (12%, compared to 8% for both IDPs
and non-displaced respondents), which may reflect the need for reconstruction of buildings and infrastructures in areas of return.
GENDER AND AGE ANALYSIS
Almost twice as many men reported not needing any support (32%) compared to women (17%), which may indicate the perception of a mismatch between women’s skillset and the demands of the labour market that would require support to be addressed. Women most commonly expressed the need for skills training/new qualifications and learning a foreign language (both 23%), computer literacy (21%) and support with online employment (15%).
While ICT and business/entrepreneurship were popular choices for training for both men and women, traditional gender sectoral preferences emerged, with carpentry being an almost-exclusively male choice, reported by 17 per cent of men and 2 per cent of women, and the beauty industry being mentioned only by women (9%).
Interestingly, while the preference for being trained in ICT peaked at 35 per cent among the age group 25-35 and then declined with increasing age, still 14 per cent of elderly (60+) looking for a job expressed interest in being trained in this area.
5. THEMATIC FOCUS: SILVER ECONOMY
Ukraine hosts an aging population, with the group aged 50 and over representing more than half (56%) of the overall population. The proportion of individuals aged 50 or more was higher among the non-displaced population (60%) compared to IDPs (44%) and returnees (43%), while rural areas hosted a generally older population (63% aged 50+) compared to large cities (53%).
This section focuses on one component of the so-called Silver Economy,46 namely the participation of older people in the labour force, and a specific age group, i.e. individuals of pre-retirement age (55 to 59 years old).47
EMPLOYMENT STATUS AND PRECARIOUSNESS OF WORK
The employment rate for individuals of pre-retirement age was 58 per cent, compared to an average of 70 per cent for younger respondents. Such difference did not appear to be driven by higher rates of unemployment, but rather by the considerably higher proportion of older people being retired (17%, as opposed to 3% of respondents below 55 years). This confirms the flexibility of the retirement system in Ukraine, which provides several options to retire before the minimum age of 60 (for men) and 58.5 (for women).
Employment of individuals 55-59 was lowest among IDPs (41%), compared to returnees and non-displaced (55% and 60%). On the other hand, the unemployed rate was highest among returnees, possibly driven by a lower proportion of pensioners among this group.
Among the pre-retirement age group, women more commonly reported being unemployed (14%) compared to their male counterparts (8%) and younger women (11%), which makes this subset the one with the highest unemployment rate after women aged 18-24. On the other hand, among the employed population aged 55-59, men were exposed to higher precariousness of work, with 19 per cent being engaged in temporary or informal work, as opposed to 12 per cent of women.
The distribution of workers aged 55-59 across different sectors reflected the overall trend, with the services (23%), education (20%) and trade (10%) sectors being the primary areas of employment. However, significant differences were observed when looking at the distribution of men and women, as older men more often reported being employed in the transportation (16%) and agricultural (12%)
43 Respondents were presented with a pre-defined list of options for support rather than an open-ended question, hence some support needs may be unreported.
44 Such as accounting, bookkeeping, project management, sales, customer service, and business communication.
45 Such as carpentry, plumbing, electrician, welding, masonry, painting, and civil engineering.
46 European Commission, The Silver Economy, 2018, available here
47 While the concept of Silver Economy generally applies to individuals aged 50 and over, for the purposes of this report, the analysis will focus on the age group 55-59. On one hand, the purpose of this analysis is to look at the specific employment profile of people of pre-retirement age, as this subset was highlighted as facing specific challenges in the labour market by KIs, hence the exclusion of individuals aged 60 and older. On the other hand, this specific age group reported disproportionally high levels of age-based discrimination in the labour market, which were significantly higher compared to the immediately younger age group (50-54).
field, compared to both same-age women and younger men. On the other hand, older women tended to be highly concentrated in the field of education (27%), compared to men (10%) and younger women (18%), indicating a higher exposure of this population group to the minimum salaries provided by the public sector.
OLDER INDIVIDUALS LOOKING FOR EMPLOYMENT
Among respondents of pre-retirement age who were unemployed, 14 per cent reported being actively looking for a job (457,000 individuals), a lower rate compared to the younger population (20%). Notably, 18 per cent of respondents from this age group who were looking for a job did not know in which sector they would be looking for work over the following year.
As it was the case for younger groups, older individuals actively looking for work47 reported lack of jobs (28%) and low salaries (10%) as barriers to employment. However, the single most reported barrier among this age group was age-based discrimination, mentioned by almost half of the people of pre-retirement age currently looking for employment (45%). The importance of age in determining access to employment was also mentioned by KIs:
“The high percentage of unemployed people is due to the fact that a certain proportion of the community’s population is of pre-retirement age, which makes it very difficult for them to find a job” (KI, Dnipropetrovska)
KEY DEFINITIONS
barriers and age group
If economic hardship and the war-induced transformation of the labour market may push elderly individuals to stay longer in employment or re-enter it after retirement, data show that older people, and specifically the population of pre-retirement age, face significant age-related barriers to employment. This not only exacerbates the vulnerability of this segment of the population, but contributes to the scarcity of labour in certain sectors. It is therefore essential to build partnerships with employers to foster age-inclusive hiring practices and reduce age-related biases in recruitment, while introducing targeted skills-development programs to prepare older adults for current labour market demands.
WORKING-AGE: Working-age refers to the 18-60 age cohort within the population. This range defines the typical (although not exclusive) span during which individuals are most likely to engage in the labour market. In this brief, it is used to estimate the employment and unemployment rates.
EMPLOYMENT STATUS: Employment status classifies individuals based on their participation in the labour market within the seven days prior to the data collection, encompassing categories such as engaged in paid work (working for a wage or salary), self-employed, unemployed, and inactive (not engaged in the labour market due to various reasons such as retirement, education, childcare or other personal circumstances).
EMPLOYED INDIVIDUALS: For the purpose of this brief, the category of employed people encompasses both those engaged in paid work and those who are self-employed.
UNEMPLOYED INDIVIDUALS: It refers to individuals who self-reported being unemployed to the question on employment status, regardless of whether they are actively looking for employment or not.
INDIVIDUALS WHO ARE LOOKING FOR WORK: It refers to individuals who reported being actively looking for employment, regardless of whether they are currently employed, unemployed, or inactive in the labour market (e.g. pensioners or people engaged in childcare full-time). When the analysis refers specifically to individuals who are unemployed and looking for work, this is explicitly stated.
47 Regardless of their employment status.
Figure 11: % of respondents reporting barriers to employment, by most reported
BRIEF METHODOLOGY
Data cited in this report were compiled from Round 17 of the General Population Survey (12 August 2024), which was commissioned by the International Organization for Migration (IOM) and collected by Multicultural Insights through screener phonebased interviews with 40,000 randomly selected respondents and follow-up interviews with 1,488 IDPs, 1,188 returnees, and 1,800 residents, using the computer-assisted telephone interview (CATI) method, and a random digit dial (RDD) approach, with an overall sample error of 0.49% [CL95%]. The survey included all of Ukraine, excluding the Crimean Peninsula and occupied areas of Donetska, Luhanska, Khersonska, and Zaporizka Oblasts. Internally Displaced People (IDPs) are defined as individuals who have been forced to flee or to leave their homes or who are staying outside their habitual residence in Ukraine due to the full-scale invasion in February 2022, regardless of whether they hold registered IDP status. The term “returnee” refers to all people who have returned to their habitual residence after a period of displacement of
minimum two weeks since February 2022, whether from abroad or from internal displacement within Ukraine.
Additionally, where specifically indicated, GPS Round 13 (June 2023), 14 (September 2023), 15 (November/December 2023) and 16 (March/April 2024) data was used to complement the findings, as well as narrative feedback from Key Informants (KIs) interviewed for the tenth round of the Mobility and Needs Assessment (MaNA) (July/August 2024).
Limitations: Those currently residing outside the territory of Ukraine were not interviewed, following active exclusion. The sample frame is limited to adults that use mobile phones, in areas where phone networks were fully functional for the entire period of the survey. People residing in the Autonomous Republic of Crimea (ARC) or the occupied areas of Donetska, Zaporizka, Luhanska, and Khersonska Oblasts were not included in the survey.