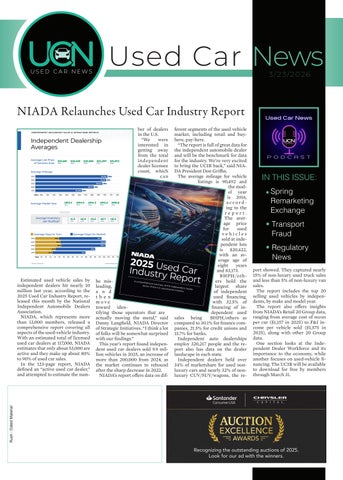
NIADA Relaunches Used Car Industry Report
ber of dealers in the U.S.
“We were interested in getting away from the total independent dealer licensee count, which
ferent segments of the used vehicle market, including retail and buyhere, pay-here.
“The report is full of great data for the independent automobile dealer and will be the benchmark for data for the industry. We’re very excited to bring the UCIR back,” said NIADA President Don Griffin.
Estimated used vehicle sales by independent dealers hit nearly 10 million last year, according to the 2025 Used Car Industry Report, released this month by the National Independent Automobile Dealers Association.
NIADA, which represents more than 13,000 members, released a comprehensive report covering all aspects of the used-vehicle industry. With an estimated total of licensed used car dealers at 117,000, NIADA estimates that only about 53,000 are active and they make up about 80% to 90% of used car sales.
In the 123-page report, NIADA defined an “active used car dealer,” and attempted to estimate the num-

The average mileage for vehicle listings is 90,492 and the model year is 2016, according to the report.
2025 Used Car Industry Report
be misleading, and then move toward iden tifying those operators that are actually moving the metal,” said Danny Langfield, NIADA Director of Strategic Initiatives. “I think a lot of folks will be somewhat surprised with our findings.”
This year’s report found independent used car dealers sold 9.9 million vehicles in 2025, an increase of more than 200,000 from 2024, as the market continues to rebound after the sharp decrease in 2022.
NIADA’s report offers data on dif-
The average price for used vehicles sold at independent lots is $20,422, with an average age of eight years and 83,173.
BHPH/others hold the largest share of independent used financing, with 32.5% of financing of independent used sales being BHPH/others as compared to 30.1% for finance companies, 21.5% for credit unions and 15.7% for banks.
Independent auto dealerships employ 320,217 people and the report also has data on the dealer landscape in each state.
Independent dealers held over 34% of marketshare for used nonluxury cars and nearly 32% of nonluxury CUV/SUV/wagons, the re-
port showed. They captured nearly 15% of non-luxury used truck sales and less than 5% of non-luxury van sales.
The report includes the top 20 selling used vehicles by independents, by make and model year.
The report also offers insights from NIADA’s Retail 20 Group data, ranging from average cost of recon per car ($1,157 in 2025) to F&I income per vehicle sold ($1,575 in 2025), along with other 20 Group data.
One section looks at the Independent Dealer Workforce and its importance to the economy, while another focuses on used-vehicle financing. The UCIR will be available to download for free by members through March 31.

Recognizing the outstanding auctions of 2025. Look for our ad with the winners.

Spring Conference
3/23/2026
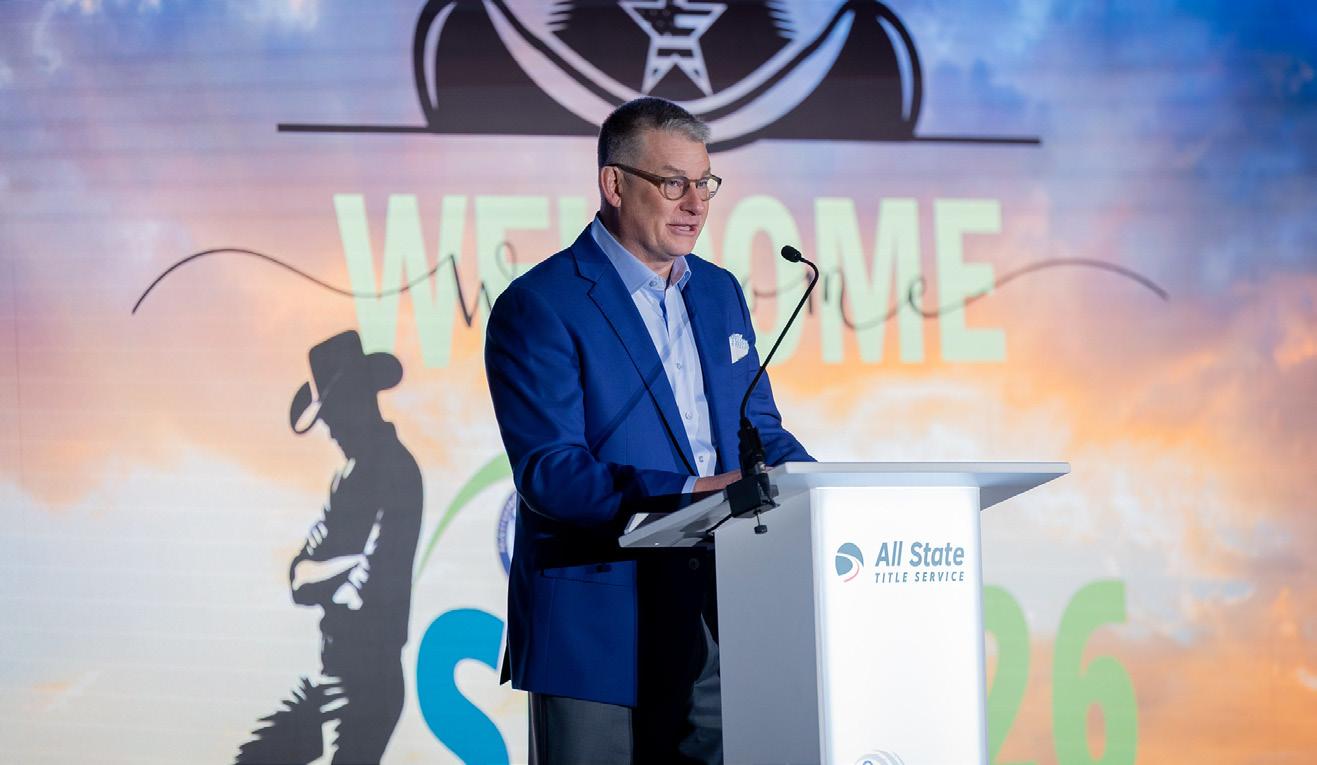
NAAA, ARA Celebrate Inaugural Spring Conference
By Jeffey Bellant
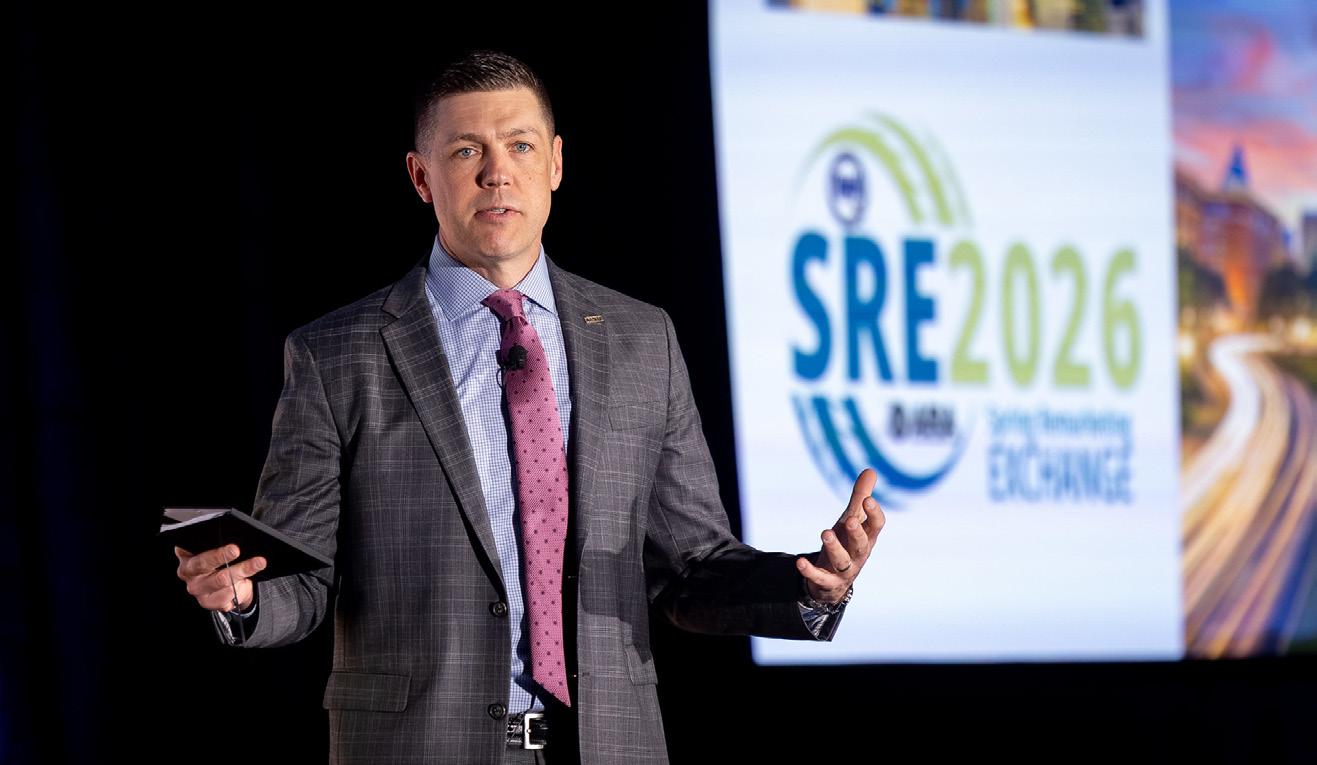
The first ever Spring Remarketing Exchange won’t be the last.
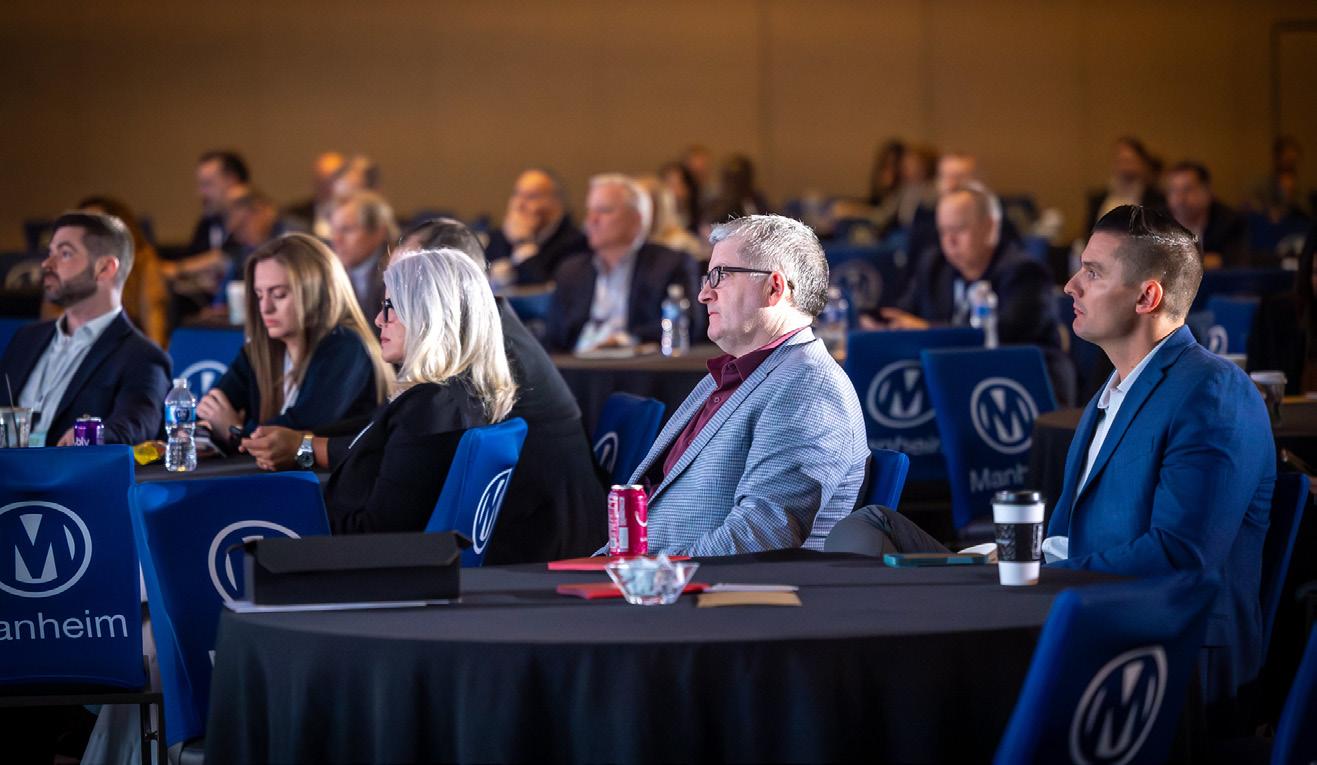
Leaders of the Automotive Remarketing Alliance (ARA) and the National Auto Auction Association (NAAA) agreed that the March event in Texas was a success.
Mark Coleman, ARA executive director, called the event “a home run.”
He said, “The response from the industry is that we had close to 350 registered attendees.
“The response from sponsors and exhibitors who wanted time in the exhibit hall both exceeded my expectations.”
Paul Lips, NAAA executive director, said the success resulted from the strong collaboration between the consignors and the auctions.
Planning the event helped both groups think outside the box, with NAAA hearing suggestions from consignors, ARA hearing suggestions from auction repos and the groups finding a place to meet in the middle and come together.
“We did something new,” said Max Cole, NAAA communications director. “We had joint committee sessions that were set up like an open forum with interaction about topics that are affecting the industry right now, like fraud and cybersecurity issues.”
The interactive sessions included breaking off into small groups, he said. Also, the groups focused on bringing speakers and leaders who have hands-on in the industry for some real world insight.
“ARA’s aim is to make our members more competitive,” Coleman said. “One of the ways we do that is by curating some content and having experts on areas like artificial intelligence, transportation fraud –name your topic.”
ARA wanted experts providing “in-the-trenches advice” with a few actionable items that attendees can bring back to their businesses.
There was also an effort to offer fresh voices and different perspectives, such as opening keynote speaker Jeffrey Butler from AutoNation Finance.
Coleman said Butler represented a company that bridges fields from consumer auto lending and the dealership perspective to auto auctions.
NAAA’s Cole said education was a big theme of the open forums, with both associations getting
together to discuss the training opportunities available to the industry, like NAAA’s training in arbitration, condition reports and damage analysis. On the ARA side, there is audit & compliance training along with the CAR Certification program.
For a session on transportation fraud, the attendees were broken into small groups to work on a problem and report back – an activity that received high marks from participants because of the interaction and problem-solving aspect.
Another part of the event that received praise from exhibitors was the location of the exhibit hall, near the general sessions where the attendees congregated.
“When you came out of the elevator, you walked right into it,” Cole said. “The room, every day from 8 a.m. until 5 p.m. was buzzing. The traffic was consistent with a different type of energy from what we’ve been used to in the past.”
Coleman said the opening reception sponsored by GROW (Global Remarketing Opportunities for Women) was also a success.
Lips seconded Coleman’s comments, adding that the energy and excitement started during the opening reception and carried through the three-day event.
ARA offered some awards and acknowledgements during the event including the ARA Impact award, honoring extraordinary volunteers.
“We were so excited to honor Cynthia Meyer (of Auction Management Solutions),” Coleman said. “Cynthia’s been engaged in all aspects of IARA, now ARA, for years. She’s just so instrumental in helping us plan these events as well as other work that ARA does.”
The conference also offered a special “In Memoriam” presentation, acknowledging the lives of Mike Richardson, Henry Stanley and Mike Antich, who all passed away in recent months.
Coleman praised industry veterans Nick Peluso and Charlie Vogelheim for flying in specifically to offer words about Antich and Richardson, while former NAAA President Charlotte Pyle offered moving memories of Stanley.
Antich, of Bobit Business Media, also became the first posthumous winner of the ARA’s Circle of Excellence award, for his role in the growth of the IARA and ARA.

News Briefs
Florida Dealer Sentenced for Wire Fraud
Tampa resident Mohamad Jihad Fakih, 27, was sentenced by U.S. District Judge Virginia Hernandez Covington to four and a half years in federal prison for conspiracy to commit wire fraud and attempting to export a stolen motor vehicle. As part of his sentence, the court also entered an order of forfeiture in the amount of $378,886.96, the proceeds of the conspiracy to commit wire fraud. Fakih was found guilty on Aug. 21, 2025.
According to court documents, Fakih conspired with others to commit wire fraud by obtaining fraudulent loans from automotive financing companies. Because of Fakih’s role as a car dealer and wholesaler, he had access to a dealership website through which automobile financing applications could be submitted. To facilitate the scheme, Fakih and his co-conspirator would identify straw purchasers and submit falsified loan applications to the victim companies on their behalf, misrepresenting that a vehicle was
being purchased by the straw purchaser. In reality, there was no vehicle for sale.
After the financing loans were approved, the loan amounts would be disbursed to Fakih as the seller of the vehicle, and his co-conspirator, and straw purchasers would receive a cut from the proceeds. It was also part of Fakih’s scheme to file false insurance claims for the vehicles, reporting them as stolen. In other instances, Fakih attempted to export vehicles for which he had fraudulently obtained financing and for which the financing company held a lien. In total, Fakih repeated this scheme for at least six vehicles in the amount of at least $372,000. Additionally, Fakih engaged in more straightforward theft, attempting to export stolen cars overseas. Fakih, using one of the straw purchasers, procured a stolen RollsRoyce Cullinan SUV. He arranged for the Cullinan to be shipped in a container out of the Port of Savannah, the manifest for which had been falsified so as not to alert law enforcement as to its true contents.
U.S. Customs and Border Protection seized the container and assessed that the stolen Cullinan’s MSRP was approximately $460,000.
This case was investigated by the Federal Bureau of Investigation’s Joint Terrorism Task Force. It was prosecuted by Assistant United States Attorney Risha Asokan.
Feds Send Dealer to Prison for Drug Trafficking
David X. Sullivan, U.S. Attorney for the District of Connecticut, announced that Wilfredo Ortiz, 45, of Bristol, was sentenced by U.S. District Judge Michael Shea to 135 months of imprisonment and five years of supervised release for trafficking narcotics from a car dealership in New Britain, Conn.
According to court documents and statements made in court, in 2024 the FBI’s Northern Connecticut Gang Task Force and New Britain Police Department investigated a drug trafficking organization, headed by Ortiz, that was operating out of Supreme Automotive, a car dealership located on Main Street in New Britain. The investigation included the use of court-authorized wiretaps, physical and electronic surveillance, and several controlled purchases of narcotics, primarily cocaine, from Ortiz and other members of the conspiracy. Three controlled purchases from Ortiz involved more than a kilogram of cocaine. Intercepted communications also revealed Oritz’s connection to firearms.
Ortiz and other members of this drug trafficking organization were arrested on Nov. 14, 2024. In association with the arrests, investigators conducted court authorized searches of Supreme Automotive and residences and other locations connected to the drug trafficking organization and seized more than five kilograms of cocaine, more than 200 grams of fentanyl, approximately 30 grams of heroin, a kilogram press, seven firearms, ammunition, approximately $75,000 in cash, and 26 vehicles.
Ortiz has been detained since his arrest. On Nov. 10, 2025, he pleaded guilty to conspiracy to distribute and to possess with intent to distribute five kilograms or more of cocaine.
In 1999, Ortiz was sentenced in New Britain Superior Court to 27 years of imprisonment for murder and robbery offenses stemming from a convenience store robbery in August 1998 during which a co-defendant shot and killed one employee and wounded another employee.
Transportation News
03/23/2026
Industry Leaders Teach How to Combat Transportation Fraud
By Jeffrey Bellant
Fraudsters are everywhere, including the auto transport business, but industry experts are helping dealers and auctions protect themselves.
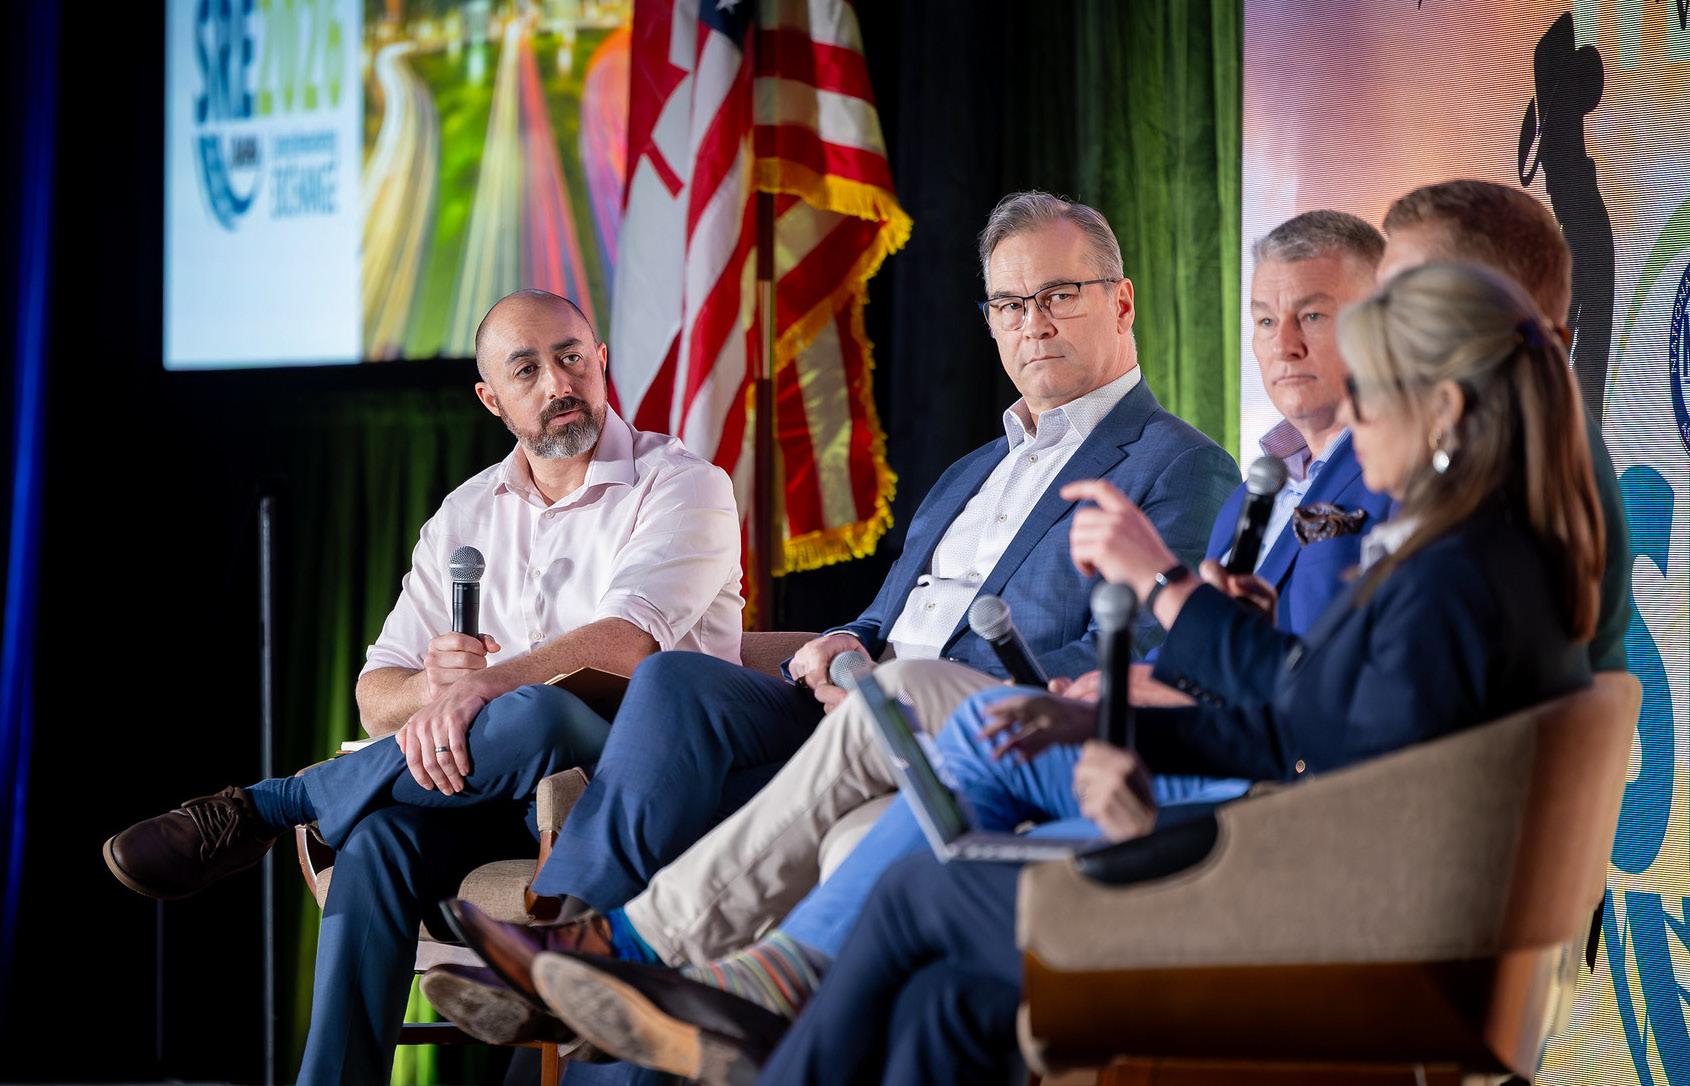
Jeremy Louisos, cofounder of Preowned Auto Logistics (PAL), based in Peabody, Mass., served on a panel about transport fraud during the recent Spring Remarketing Exchange in Texas.
His company focuses on nationwide auto shipping for dealers, fleets, private parties and digital auctions.
On the panel, Louisos wanted to bring awareness to the issue and offer a framework on what’s happening.
There’s some main attack vectors and some main prevention methods, he said.
One of the main attack methods is what Louisos calls the ‘hack and switch,’ where the fraudster uses phishing attacks to hack a shipping board, and pose as a gig carrier to redirect an unassuming carrier to a different location they choose. They might even target a particular vehicle, post it and get an unassuming carrier to go and commit the theft.
hicle and the employee lets him do it because he assumes a car is being shipped.
“There are different areas of vulnerability that bad actors attempt to exploit,” Sibble said, “and one of those is at pickup, because that
them to deliver to a different place and the shipper does it.”
Fraudsters also use double-brokering against the transport business. If a logistics firm contracts with someone, and they subcontract it out, the logistics firm doesn’t know who’s shipping the vehicle.
Sibble said it’s hard to pick out one area of danger.
“To combat fraud, we focus
Louisos said. “We’re monitoring insurance, FMCSA (Federal Motor Carrier Safety Administration) records and safety scores. We’re looking for criminal activity.”
Big data signatures are a problem, where a carrier has only one truck registered to their Department of Transportation number but they’re doing multiple shipments at a time or they have multiple address
“They never go in themselves,” Louisos said. “They’re always subcontracting it out to somebody else by hacking and posing as a gig carrier.”
Lainey Sibble, head of Central Dispatch, said that fraudsters will challenge every weakness in the system.
“There are so many handoffs when we’re talking about shipping a vehicle,” Sibble said.
Transporting involves the shipper, the logistics firm, the carrier and the dealership. Each part of the process is a potential open door. Even the initial pickup location offers crooks an opportunity, whether it’s an auction, dealership or repo lot.
Fraudsters also use pickup deception, where a carrier comes to a lot, says he’s there to pick up a ve-
pickup location is not a party to the transportation transaction in most cases.”
Sophisticated fraudsters are searching load boards, dealer sites and the Internet to see when a vehicle is moving from one place to another, Louisos said.
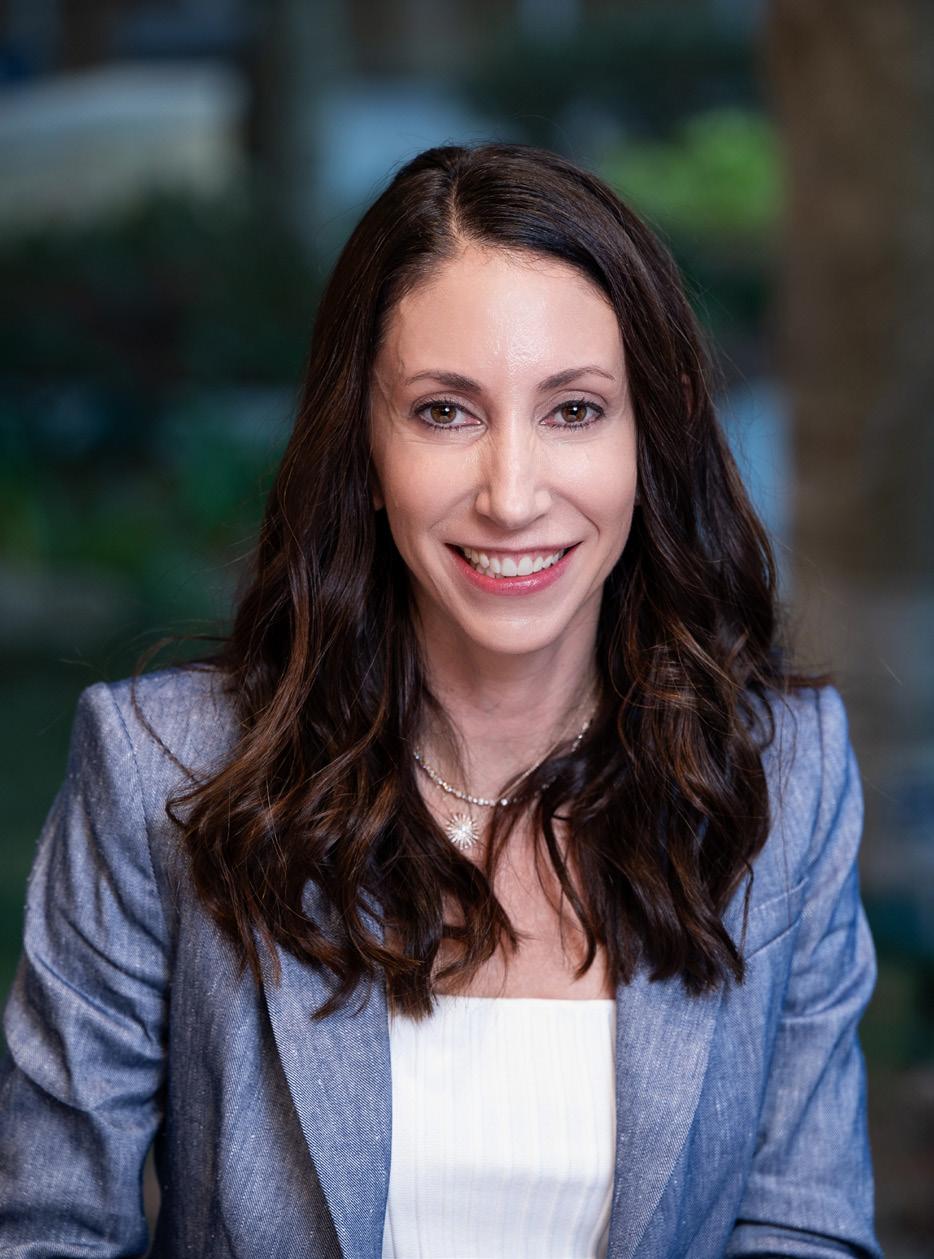
Using that info, they might forge a release document, hire an unknowing carrier – and pay him well -- who then presents it to the dealership to pick up a vehicle.
“That carrier does not know they are committing a theft,” Louisos said. “Then (the fraudster) contacts the shipper, tells them he wants
on the three Vs; vetting, verification and vigilance,” Louisos said.
Vetting is the responsibility of the logistics provider like PAL or Central Dispatch.
“It’s our responsibility to make sure we have pristine carrier networks,”
changes, bad driver’s licenses, etc. Central Dispatch promises strong platform security, vetting all companies and all users before they get on the platform, Sibble said.
The company monitors the behavior on the site and provides customers tools to help them determine the right people to work with.
For a dealer shipping the vehicle, one tool is key.
“We provide a carrier scorecard so that shippers can look at the credentials, performance and key attributes to determine if that’s the right carrier for them,” Sibble said.
For example, a shipper needs to move a car across the country, but a carrier might only be authorized to move cars within a certain state, she said.
Louisos emphasized another step, verification, to the audience at SRE. A logistics firm can do all the vetting in the world, but if a dealer doesn’t check the carrier’s driver’s license or the truck’s DOT number, then everything a logistics firm does breaks down, he said.
“Making sure you’re verifying that the carrier picking up the car is the exact driver and exact truck that
Continued on page 10
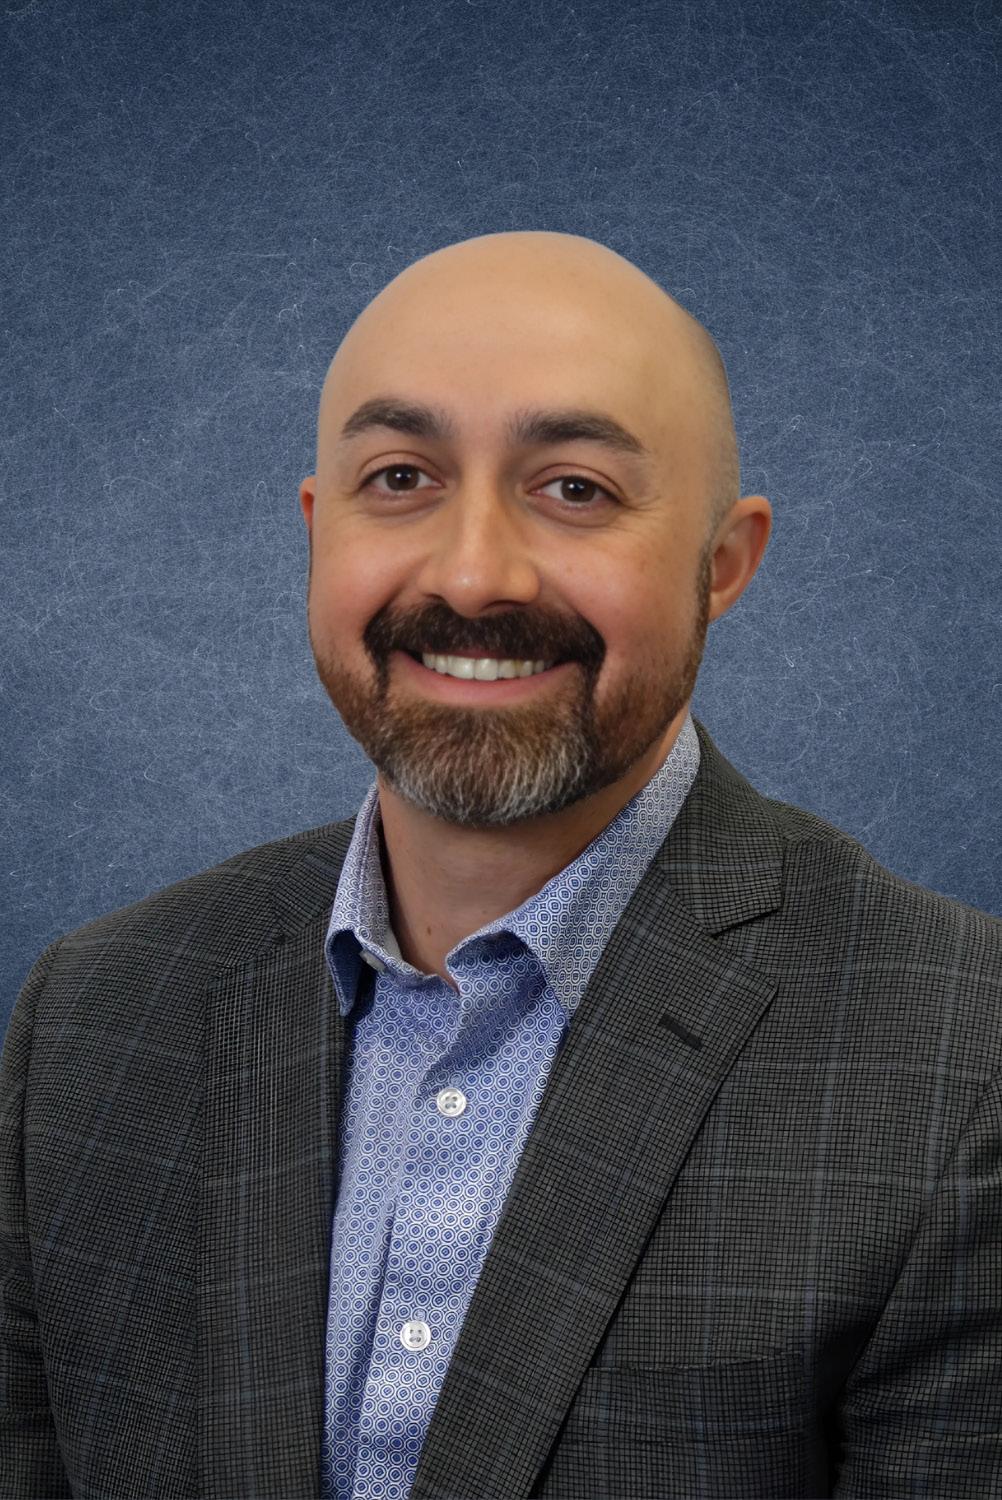
Jeremy Louisos
Lainey Sibble
Regulatory News
3/23/2026
Hudson Cook Attorney Focuses on Federal Developments
By Michael A. Benoit
This article is designed to catch you up on the most recent Washington developments in the auto sales, financing, and leasing world. This month, we’re covering developments from the Federal Reserve Board, the Department of Justice, the Department of the Treasury, the Council of Economic Advisers, Senator Elizabeth Warren, and the Federal Trade Commission.
FRB Proposes Rule to Remove Reputation Risk from Supervisory Programs. On February 26, the FRB issued a proposed rule that would codify the removal of reputation risk from its supervisory programs. The proposal would prohibit the FRB from “encourag[ing] or compel[ling] Board-supervised banking organizations to deny or condition the provision of banking or other financial products or services to an individual or business based on their constitutionally protected political or religious beliefs, associations, speech, or conduct, or based on involvement by the individual or business in politically disfavored but lawful business activities perceived to present reputation risk.
The decision regarding whether or not to make a loan or to open, close, or maintain an account, provide any other financial product or service, or modify the terms of any financial product or service rests with the banking organization, acting in accordance with applicable law.” The FRB has defined “reputation risk” as “the potential that negative publicity regarding an institution’s business practices, whether true or not, will cause a decline in the customer base, costly litigation, or revenue reductions.” Comments on the proposed rule are due by April 27, 2026.
DOJ Settles SCRA Claims Against Used Car Retailer: On February 23, the DOJ announced a settlement with a large retailer of used cars to resolve allegations that it repossessed vehicles in violation of the Servicemembers Civil Relief Act. Specifically, the DOJ alleged that the company repossessed the vehicles of 28 servicemembers without obtaining the required court order.
The DOJ alleged that many of these violations occurred as a result of the company’s policies, which: (1) did not require the company to search the Defense Manpower Data Center website to determine
an owner’s military status prior to repossessing a vehicle that was in a “charge off” status, and (2) did not prohibit the company from repossessing vehicles owned by reservists who had received orders to report for military service at a future date.
In addition, the DOJ alleged that the company repossessed some vehicles even after the borrowers told the company that they were in military service. Under the settlement, the company will provide $15,000 in compensation to each of the 28 affected servicemembers, as well as provide any lost equity in the repossessed vehicle and any interest accrued on this lost equity.
The company will also pay a civil penalty of $79,380. Finally, the company is required to revise its SCRA policies and procedures for vehicle repossessions.
The Treasury has announced an executive oversight group’s development of resources to address financial sector’s use of AI. On February 18, the DOT announced the conclusion of a public-private initiative to strengthen cybersecurity and risk management for artificial intelligence in the financial services sector. The Artificial Intelligence Executive Oversight Group brought together senior executives from financial institutions, federal and state financial regulators, and other stakeholders to address gaps in the financial sector’s use of AI and to develop resources designed to help institutions adopt and implement AI in financial services and manage associated AI risks. The resources developed by the AIEOG will address areas such as governance, data practices, transparency, fraud, and digital identity. Thus far, the DOT has released two such resources to guide AI use in the financial services sector.
Council of Economic Advisers Reports on Impact of CFPB’s Actions on Cost of Credit: On February 17, the CEA, an agency within the Executive Office of the President, released a report that estimates the impact of the Consumer Financial Protection Bureau’s rulemakings, supervision, and enforcement on the cost of credit for consumers from 2011 through 2024.
The CEA provided the following key takeaways from its study:
(1) Since 2011, the CFPB has cost consumers between $237 and $369 billion, including fiscal costs, increased borrowing expenses, and
reduced loan originations;
(2) Of the total above, increased borrowing costs amount to at least $222-$350 billion ($160-253 per borrower) from 2011 through 2024. Broken down by loan type, the CFPB’s rulemaking has cost consumers $116-$183 billion in higher mortgage costs ($1,100-$1,700 per originated loan), $32-$51 billion for auto loans ($91-$143 per loan), and $74-$116 billion for credit cards ($80-$126 per loan). These costs significantly surpass the CFPB’s reported $21 billion returned to consumers (about $15 per borrower);
(3) In 2024 alone, the combined annual cost of credit for mortgages, auto loans, and credit cards is estimated to be between $24 and $38 billion;
(4) The higher borrowing costs from CFPB policies significantly reduced loan originations, resulting in an estimated economic efficiency loss of between $1.5 and $5.7 billion to consumers;
(5) The annual paperwork burden from CFPB rules exceeded 29 million hours or the equivalent of 14,100 full-time employees spending all of their time on documentation and reporting requirements at a cost of just under $2.5 billion. From 2011 to 2024, the CFPB’s paperwork burden cost businesses an estimated $21 billion.
U.S. Senator Elizabeth Warren is seeking information on vehicle repossessions. On February 4, Senator Warren, Ranking Member of the Senate Committee on Banking, Housing, and Urban Affairs, sent a letter to several major auto financing companies and servicers, as well as the American Recovery Association, the National Independent Auto Dealers Association, and the Ameri-
can Financial Services Association, seeking information about vehicle repossession policies, practices, and error rates. In the letter, Warren states: “While the Consumer Financial Protection Bureau has historically engaged in oversight of illegal auto repossessions, the Trump Administration has kneecapped the agency’s ability to protect consumers from auto repossession errors.
“To understand the impact of these actions by the Administration, I write to request information on [the company’s] practices to avoid errors and information on errors from the last four years.”
The letters request the following repossession information, covering the period from January 1, 2022, through December 31, 2025:
(1) whether the company services its own financing contracts or hires a third party to service and the identity of those third-party servicers;
(2) the number of vehicles that the company ordered to be repossessed within the four-year period, what party completed the repossession (e.g., the company itself or a third party), how many repossession events were in error or were thought by the consumer to be in error, and what policies are in place to identify and address repossessions made in error;
(3) how often the company handles a dispute by the consumer about the terms of a financing contract, particularly following a loan modification, and how often such disputes relate to COVID-era modifications;
(4) how many repossessions occur for contracts where a consumer has made a formal or informal complaint that there was a material problem with the underlying transaction;
Continued on page 8













































































Used Car News
(5) how many consumer complaints the company has received concerning the behavior of the initial seller of a vehicle; (6) steps the company takes to ensure that its agents, or agents of its servicers, only tow or attempt to tow the correct vehicle;
(7) use of GPS monitors, kill switches, starter interrupt devices, or other similar electronic devices that allow the company to locate or disable a vehicle in the event of repossession or the use of any other device to remind or encourage consumers to make payments; and (8) policies and practices concerning personal property that is left in a repossessed vehicle.
FTC Submits Draft ANPR on Negative Option Rule for Review: On January 30, the FTC announced that it submitted a draft Advance Notice of Proposed Rulemaking on the
Information and Regulatory Affairs (within the Office of Management and Budget) for review.
The OIRA had determined that the planned ANPRM is a “significant regulatory action” and must undergo review before the FTC issues it.
Once the OIRA completes its review, the FTC can publish the ANPRM in the Federal Register, and interested parties may comment on it. In July 2025, the U.S. Court of Appeals for the Eighth Circuit vacated the FTC’s Negative Option Rule right before the rule’s compliance deadline.
Negative option plans generally involve a seller interpreting a consumer’s silence or inaction as consent to continue to receive a particular product or service; a consumer must actively cancel the product or service to avoid being charged by the
Shortly after the FTC finalized the rule in November 2024, various industry associations and businesses challenged the rule in four circuit courts of appeals.
The rule required sellers to obtain, and maintain records of, unambiguous affirmative consent to a negative option feature and to provide a simple mechanism for cancellation that is as easy to use as the mechanism the consumer used to consent to the subscription. The FTC’s compliance deadline for the rule, which had been extended once, was set to go into effect on July 14, 2025.
The Eighth Circuit vacated the rule based on procedural deficiencies in the rulemaking process. The Eighth Circuit found that the FTC erroneously determined that the national economic effect of the proposed rule would be under $100 million and, on that basis, declined to conduct a



scribing and analyzing the reasonable regulatory alternatives to the proposed rule. In January and February 2024, the FTC held informal hearings before an administrative law judge, who observed that unless each business used fewer than 23 hours of professional services at the lowest end of the spectrum of estimated hourly rates, the rule’s compliance costs would exceed $100 million.
The ALJ found that this estimate was “clearly unrealistically low” and that the rule would have an annual effect on the national economy that exceeded the $100 million threshold.
So, there’s this month’s report. See you next month!
*Michael A. Benoit is a partner in the Washington, D.C., office of Hudson Cook.
This article is from Spot Delivery.
















Discover our growing inventory of late model cars, trucks, and SUVs tailored to meet your business needs.
• Green Light & Yellow Light Vehicles: Enjoy peace of mind with the 21-day Copart Wholesale Arbitration Policy
• Red Light Vehicles: Sold as-is
Why Choose Us?
• Free Condition Reports
• Clean title vehicles brought to you by our partners at Bridgecrest • AI-Powered Damage Highlights • Streamlined Dealer Registration via AuctionACCESS







Used Car News
was sent by your shipping provider is such an important step,” Louisos said. “It’s not a magic bullet and doesn’t stop every theft, but it’s such an important layer it will stop about 95% of what we see.
“If something feels off, it probably is off.”
Central Dispatch offers a tool allowing the carrier to assign a driver, so the pickup location can verify if this is the correct driver, Sibble said.
“The pickup location also plays a big role in this,” she said. “They have to decide is this is the right driver to hand over the keys to the vehicle.
The shipper should provide information to the pickup location about who is coming and when. Companies like Central Dispatch can offer protocols to help shippers do that, Sibble said.
Louisos urged independent dealers to check driver’s licenses, check the DOT numbers on the cabin of the
carriers – paper plates don’t count.
“If something feels wrong, reach out to us and we’ll walk you through it,” he said.
For vigilance, using something like driver’s licenses is a good tool, or even using sophisticated tools like blockchain ledgers.
Louisos said while his focus is on dealers, auctions could benefit from these tools, too.
Central Dispatch is now working on a secure vehicle transfer solution to make sure the person and carrier company is who should be picking up the vehicle.
“It’s really about just adopting and using them,” she said. “It’s no longer about access or do they exist.”
Central Dispatch makes sure people have their own login and password, as well as the right permission level.
Don’t share passwords and don’t blindly click on links. Check to see
how long a carrier has been in business and on the platform. What are their ratings?
Sibble said dealers not only should check the insurance of a carrier but ask to be added on that insurance for added protection. Also, as the pickup location, if there is any doubt or concern, call the shipper.
“Embrace the new technology,” she added. “Some of these steps are going to add a little time but they are worth it. They are going to save headaches and losses down the road.”
Auto theft in the shipping space has always been a thing. But after a big uptick in recent years the top 25 brokers in the country formed a council to find out why, Louisos said. They discovered that organized crime had moved into auto transport theft business.
“It’s safer to steal cars than to move drugs and penalties are less,”
he said. “They’re targeting high value vehicles, typically $125,000+, but we’ve seen as low as $80,000 being targeted in some cases. But typically it’s G-Wagons, McLarens – makes and models like that.”
“Predominantly, we’re seeing this is in the Tri-State area of New York, Pennsylvania and New Jersey, as well as Pennsylvania, but it’s also happening in Texas and Southern California,” he said.
“These are places where once a vehicle is stolen, it can either get put into a storage container and brought to a port or across the border.”
The good news for dealers is there are tools to help safely ship or receive vehicles, Sibble said.
“We have seen a recognition from everyone across the industry that indeed everyone needs to play a role in addressing fraud, ensuring that those in the industry can continue to ship vehicles safely and securely.”









Retail Markets
IDAHO
Kyle Durham, owner, Dale’s Auto Sales, Meridian, Idaho
“I’ve been in this business since 1998. My dad started it in August 1972. We moved to our current location 5 years ago, we sold the dirt to a winery and moved about 8 miles west.
“Our inventory is 20-25, we’re kind of small. I used to carry more before we moved, but I downsized. I probably sell about 10 a month.
“Our sales are pretty even, about one-third each for cars, trucks and SUVs.
“My average is $786 for reconditioning per car. I farm out the work, but I’ve got a really good infrastructure.
“I do not do buy-here, payhere. Never have. It’s not a big market out here in the West, particularly in Idaho. I don’t know why. I’ve been in 20 groups and it’s a huge
deal in other parts. But we’ve got a million people in this metro area and there’s like two BHPH dealers.
“My average retail price is $20,000 for a pickup, $15,000 for a car.
“A dealer just starting out:
Whatever you think it’s going to cost, it’s triple. It’s such a heavy cash burden— don’t get out of trust. I see so many people get out of trust, and that’s just tough.
“I don’t do any print advertising anymore, and I was one of the holdouts, everything’s online.
“I go to auctions in person. In that $20,000 price range you’ve got to touch and feel and smell the cars. I mean every once in a while, I can hit the button if I have somebody check it out for me, not very often.
“The last car I sold was a 2017 Subaru Forester with 17,000 miles, one owner. I
bought it right here in town. I got 18 grand out of that car.”
NEBRASKA
Conrad Neverve, owner, Conrad’s Auto Center, Kearney, Neb.
“We usually keep about 20-25 vehicles on hand. We sell about 10-12 a month, half our inventory.
“SUVs are the most prominent vehicle we sell; cars are almost a thing of the past.
“We buy cars mostly on the Internet. I haven’t been going to auctions since COVID. I hate doing it online, but that’s what you do anymore.
“I’m going to say $500 to $700 on reconditioning -that’s probably a good number.
“We do very little advertising. I’ve got 7,000 customers and you create a lot of sales right out of the shop. Our shop is very busy, we have probably 20 bays. It’s an old
Cadillac dealership.
“Well, we like to keep our cars pretty current. We try to compete against the newcar stores and that’s a tough game right now because they’ve got too many rebates. They’re giving 20% off of MSRP on a pickup. How can you sell a used pickup?
Let’s say it’s $60,000 and you go buy that pickup. I sell a ’23 or ’24 for $50,000 and they can go buy a 2026 right now at list for 60 and 20% off they’re paying $48,000.
I can’t even be in the same game with them.
“I don’t know, the new-car stores are killing themselves, I mean, some of them make a crappy product. I mean, we see that.
“So, what do you do? I should be a buy-here, payhere. I know guys who make millions of dollars, but it’s not for me.
“We don’t take down pay-
Compiled by Ed Fitzgerald
ments, with our financing you can pretty much go full stroke. We use pretty highend financials and we don’t do subprime lending at all.
“Yes and no, as far as COVID changing things. I don’t know how I should say it, but COVID was good for us. We were busy. We had our best years because people had a lot of money.
“My tip to any dealer just starting out is to get a repair shop. That’s the best business you can have right now. That’s our main business. That’s where we started in 1990. The Cadillac store became vacant and we got on the main drag, so we were very visible. We probably have 50,000 cars driving in front of us every day.
“The last car I sold was an old Envoy. I think it had 130,000 miles; it was a 2005. We got $5,500 for it.”
AUGUST 12-13, 2026



Wholesale Markets
3/23/2026
MONTANA
Jake Gertsch, sales manager, Auto Auction of Montana, Billings, Mt.
“This is our 24th year.
“Volumes are down. We’re down about 100 cars a week from where we were last year. We’re running 350 to 400, where last year we were at 500 to 550. We’re just dealing with what’s happened in the past, lower production, not as much fleet, etc.
“Used inventory is just down.
“Our sales percentage in March was 71% or 72%. It was high. Just got to find more cars.
“Our average price in the lane is about $26,000, maybe between $26,000 and $27,000. That’s about the same as this time last year.
“(In terms of volume mix) we run one fleet lane and three dealer lanes. The fleet
lane usually runs 100 to 150 lanes and the rest are dealer vehicles.
“We just switched our operating system (to Edge Pipeline). At our March 11 sale, we had about 300 registered bidders, with about 200 online and the rest were in the lanes.
“Dealers are saying the same thing as everyone else. The prices have gone way up. The market is way up. And the books need to adjust. They’re behind the curve.
“That’s the challenge when they are trying to get things financed. They can’t get banks to buy what they have to even pay for a vehicle at auction right now.
“The books are just being reactive.
“For the past 10 years, Canadian imports made up 40% of our business. That business has dropped sig-
WE HAVE THE
nificantly. Tariffs have been part of it, in general, but the Canadian used market has gone up there and the dollar exchange is not what it was. It’s a lot of factors.
“The dealers in Canada are saying the used stuff is stronger up there.”
OKLAHOMA
Kyle Clopton, general manager, Oklahoma Auto Exchange, Oklahoma City, Okla.
“This is our 21st year in business. We’re running between 650 and 700 cars per week.
“The volume is steady from last year but we’ve seen an elevated conversion rate. The market is really hot.
“We’ve expanded our footprint with some of our commercial/fleet/lease accounts and our average sale price, from a fleet/lease perspective, has jumped at a pretty
decent clip.
“But we have seen a little bit of decrease from the franchise dealer base.
“About 65% of our volume would be franchise trades and 35% commercial.
“We also have some buyhere, pay-here repo accounts.
“Our online presence has picked up recently. We had a big Exeter and Wheels sale and we had about 130 bidders online and about 350 in-lane on March 11.
“We have great partnerships with all of our commercial partners, including Stellantis Financial Services.
“We haven’t strayed from being a service business.
“It doesn’t seem that there has been an influx of tax money from a retail standpoint.
“Our conversion rates have been between 68% and 71%. In fact, earlier this year, we
COMPLIANCE ANSWERS

Compiled by Jeffrey Bellant
had a foot of snow and Oklahoma never gets a foot of snow. But we worked really hard to get cars cleared off and we were able to still sell over 65% that week, which was shocking.
“It’s just been really strong week in and week out.
“The retail market is steady but still needs used cars. Quality used cars are still in demand and still difficult to find, which is why we’re seeing the amount of aggressive buying activity.
“Our average price in the lanes is $8,300.
“Vehicles that are under $20,000 are really hit in this part of the country.
“I’m excited about 2026. We don’t plan for things that are out of our control.
“It’s about taking care of our dealers, betting on their growth and success, understanding that when they’re healthy, we’re healthy.”
3/23/2026


ADESA Boston APRIL 10, 24
508-626-7000
ADESA Charlotte APRIL 2, 16, 30
704-587-7653
ADESA Chicago APRIL 24
847-551-2151
ADESA Cincinnati/Dayton APRIL 28
937-746-4000
ADESA Golden Gate
APRIL 14, 28
209-839-8000
ADESA Indianapolis APRIL 14, 28
317-838-8000
ADESA Kansas City APRIL 14, 28
816-525-1100
ADESA Lexington APRIL 9
859-263-5163
ADESA New Jersey
APRIL 2, 16, 30
908-725-2200
ADESA Salt Lake APRIL 21
801-322-1234
ADESA Tulsa APRIL 10
918-437-9044
Columbus Fair APRIL 1, 8, 29
614-497-2000

Manheim Atlanta
APRIL 16
404-762-9211
Manheim Dallas
APRIL 21
877-860-1651
Manheim Milwaukee
APRIL 22
262-835-4436
Manheim Atlanta APRIL 2, 15, 16, 30
404-762-9211
Manheim Baltimore Washington APRIL 21
410-796-8899
Manheim Dallas
APRIL 8, 21, 22
877-860-1651
Manheim Denver APRIL 22
800-822-1177
Manheim Detroit APRIL 16
734-654-7100
Manheim Fredericksburg
APRIL 23
540-368-3400
Manheim Milwaukee
APRIL 8, 22
262-835-411436
Manheim Minneapolis
APRIL 15
763-425-7653
Manheim Nashville
APRIL 7, 8
615-773-3800
Manheim Nevada
APRIL 3
702-730-1400
Manheim New England
APRIL 28
508-823-6600
Manheim New Jersey
APRIL 8, 22
609-298-3400
Manheim New Orleans
APRIL 8, 22
985-643-2061
Manheim Orlando
APRIL 7, 14, 21, 28
800-822-2886
Manheim Palm Beach
APRIL 8, 14, 15, 16
561-790-1200
Manheim Pennsylvania
APRIL 2, 3, 10, 16, 17, 24, 30
800-822-2886
Manheim Phoenix
APRIL 9, 23
623-907-7000
Manheim Pittsburgh APRIL 22
724-452-5555
Manheim Riverside
APRIL 7, 9, 21, 23
951-689-6000
Manheim Seattle
APRIL 1, 29
206-762-1600
Manheim Southern California
APRIL 2, 16, 30
909-822-2261
Manheim Tampa APRIL 2, 16, 30
800-622-7292
Manheim Texas Hobby APRIL 2, 16, 30 713-649-8233
Manheim Atlanta APRIL 16
404-762-9211
Columbus Fair
APRIL 8 614-497-2000
Manheim Dallas APRIL 21
877-860-1651
Manheim Milwaukee APRIL 22 262-835-4436
Manheim Nashville APRIL 8 615-773-3800
Manheim Nevada APRIL 3, 22
702-730-1400
Manheim Orlando APRIL 14, 18
800-822-2886
Manheim Palm Beach APRIL 8, 15 561-790-1200
Manheim Pennsylvania APRIL 2, 16, 30
800-822-2886
Manheim Phoenix APRIL 9, 23
623-907-7000
Manheim Riverside APRIL 9, 23
951-689-6000
Manheim Seattle APRIL 1, 29 206-762-1600
Manheim Nashville APRIL 8
615-773-3800
Manheim Nevada APRIL 3
702-730-1400
Manheim Palm Beach
APRIL 8, 15 561-790-1200
Manheim Pennsylvania
APRIL 2, 16, 30
800-822-2886
Manheim Riverside APRIL 9, 23
951-689-6000
Manheim Seattle
APRIL 1, 29 206-762-1600
ADESA Boston APRIL 10, 24
508-626-7000
ADESA Charlotte APRIL 2, 16, 30
704-587-7653
ADESA Golden Gate APRIL 28
209-839-8000
ADESA Salt Lake APRIL 21
801-322-1234
Columbus Fair APRIL 1, 29 614-497-2000
Manheim Dallas APRIL 8, 22 877-860-1651
Manheim Fredericksburg APRIL 23 540-368-3400
Manheim Milwaukee APRIL 8 262-835-4436
Manheim New England APRIL 28 508-823-6600
Manheim New Jersey APRIL 8, 22 609-298-3400

Financial Services*
Manheim Atlanta
APRIL 15
404-762-9211
Manheim Dallas APRIL 21
877-860-1651
Manheim Milwaukee APRIL 22 262-835-4436
Manheim Orlando APRIL 14, 28
800-822-2886
Manheim Pennsylvania APRIL 3, 17
800-822-2886
Manheim Pittsburgh APRIL 22
724-452-5555
Manheim Seattle APRIL 1, 29 206-762-1600
Manheim Southern California APRIL 2, 16, 30
909-822-2261
Manheim Palm Beach
APRIL 8, 15
561-790-1200
Manheim Pennsylvania APRIL 2, 16, 30
800-822-2886
Manheim Riverside APRIL 9, 23 951-689-6000
Tony Moorby Disconnected Jottings From
By Jeffrey Bellant
Filling in for the incomparable Mr. Moorby, I’ll try to stick to the “Disconnected Jottings” theme.
I’m sitting at my home desk in the Detroit area on the second floor of my condo and looking down at the great pile of leaves in my driveway. I mean, like, huge.
It’s March, so where are the old leaves coming from, you ask?
Who knows?
Every fall the lawn crew, who is fantastic, meticulously clears the leaves a couple of times before winter.
But my townhouse-style, corner-unit condo sits on some universal leaf vortex. The remaining fall leaves in the complex find their way to my driveway and sit.
I pay the HOA bill and I’m lazy, but last year I still went
out and bagged the leaves, but more returned.
They keep coming from the south, throughout the winter. By now, the leaves in my driveway are probably from Moorby’s neighborhood in the Carolinas.
Even now, unseasonable wind gusts of up to 50 mph swirl around but the pile of leaves remains, growing, pushed and pressed by the wind – stuck there.
I’m going to go out and bag them tomorrow, but as God as my witness, more will pile up in a couple of days.
It’s like the stuff I own.
Did I mention I’m a bit of a cluttery guy.
Ask my wife, she’ll tell you. I’m a kind of a book hoarder, as well as a guy who has a hard time throwing things away.
I went with the wife to her doctor’s appointment

By Myles Mellor
and made the error of mentioning that I have too much stuff and the doctor looked at me and said “I-800-GotJunk?”
“Jerk,” I thought. He says that right there, with my wife in the room. Does he know the problems he’s causing? The fight that’s going to start the minute we leave his office?
Don’t get me wrong, my wife is a sweetheart. A gentle, generous spirit, like the Bible says. Not a nag at all, though when she looks around our cluttery condo, she might start rethinking that strategy.
She mentioned the junk truck later, but gently.
I’m having an issue with tinnitus, so I can blame that for not hearing her.
A few days later I thought I was in the clear, but I hear some industrial sound from my neighbor’s place.
I make the mistake of looking outside and there it is.
A giant blue dump truck with 1-800-GOT-JUNK? painted boldly on its side in my neighbor’s driveway. My jaw dropped.
I’ve been to my neighbor’s condo.
It is SPOTLESS. I could eat off the floor. I could drop a mustard seed in the middle of her living room and be able to spot it in two seconds.
This is not good, I thought.
When I asked her how much it cost, I really started getting nervous. If it cost her that much, I’ll need a second mortgage.
Now to be fair, she was getting new furniture, so that was her “junk.”
They charge more for bulky items and they dismantled it, but still.
I had to tell my wife about
the junk truck and you should have seen the look in her eyes.
She was so excited.
It was like the time she saw me cleaning the bathroom…that one time.
I was getting a little depressed and then I had an idea. Maybe they take leaves, too.
Tony Moorby


Let Auto Assign do the heavy lifting, automatically routing vehicles to the best-fit auctions based on your custom rules. Faster decisions. Better results.
We are proud to announce the winners of the 2025 Auction Excellence Awards, honoring auto auctions for outstanding performance in the areas of operational excellence, strategic planning, customer service, value achievement and residual enhancement. These top performers have excelled across every lane.
The winners of the 2025 Auction Excellence Awards are:
RETAIL CATEGORY
NATIONAL AUCTION OF THE YEAR Manheim DFW
REGIONAL AUCTION OF THE YEAR
CENTRAL REGION Manheim DFW
MIDWEST REGION Manheim Louisville
NORTHEAST REGION America’s Auto Auction Harrisburg
SOUTHEAST REGION Manheim North Carolina
WEST REGION Manheim Phoenix
LEASE CATEGORY
NATIONAL AUCTION OF THE YEAR Manheim DFW

Congratulations to the winners for using our high-quality inventory to achieve exceptional results.