Nonprofits in Focus
IN SAN DIEGO

IN SAN DIEGO
Our work at The Nonprofit Institute (NPI) leads to a more sustainable, impactful, and responsive nonprofit sector that enhances the social, economic, and environmental well-being of the San Diego region. We pursue this impact through three pathways:
1. Transform
We accompany leaders, organizations, and networks to transform and adapt ways of working with communities for greater impact.
2. Know
Together with the community, we conduct research and apply credible knowledge that strengthens shared learning and nonprofit practice.
3. Advocate
We advocate for nonprofits by centering community voice, creating platforms, bridging gaps, and using research to inform policy, philanthropy, and public discourse.
Tessa Tinkler, PhD, Senior Director of Research and Evaluation
Cristina Sanchez-Kerr, PhD Candidate, Assistant Director of Research
Laura Deitrick, PhD, Executive Director
Eo Hanabusa, Research and Communications Coordinator
Bryan Cardenas, MA, Research Assistant
Timothy Nelson, MPA, Doctoral Research Assistant
William Piper, MA, Doctoral Research Assistant
Jon Durnford, MBA, Research Associate; Principal, DataLake, LLC
San Diego Nonprofit Sector Snapshot
Message from our Executive Director
Widening the Lens: Pressures on the Region’s Nonprofit Infrastructure
Federal Policy Changes and Funding Cuts to Nonprofits
Nonprofit Financial Health
When San Diegans Need Help
Why Residents Turn to Nonprofits
Centering the Frame: Service Demand and Community Response
Demand for Nonprofit Services
Leadership Actions Taken to Address Nonprofit Resource Shortfalls
Volunteers: A Vital Resource
Giving: Collective Power in Action
How Individual Giving is Shifting
Centering the Frame: Workforce Capacity Under Strain
Meaningful, Supportive, and Safe Workplaces
Increased Tension and Threats in Mission-Driven Work
Technology Challenges and AI Expansion
Adjusting Focus: Sector Strengths and the Path to Shared Investment
Nonprofit Sector Strengths and Assets
Partnerships and Collaborative Practice
Nonprofit Advocacy
Nonprofit Priorities and Funder Response
Continued Need for Board Engagement and Development
Data Sources and End Notes
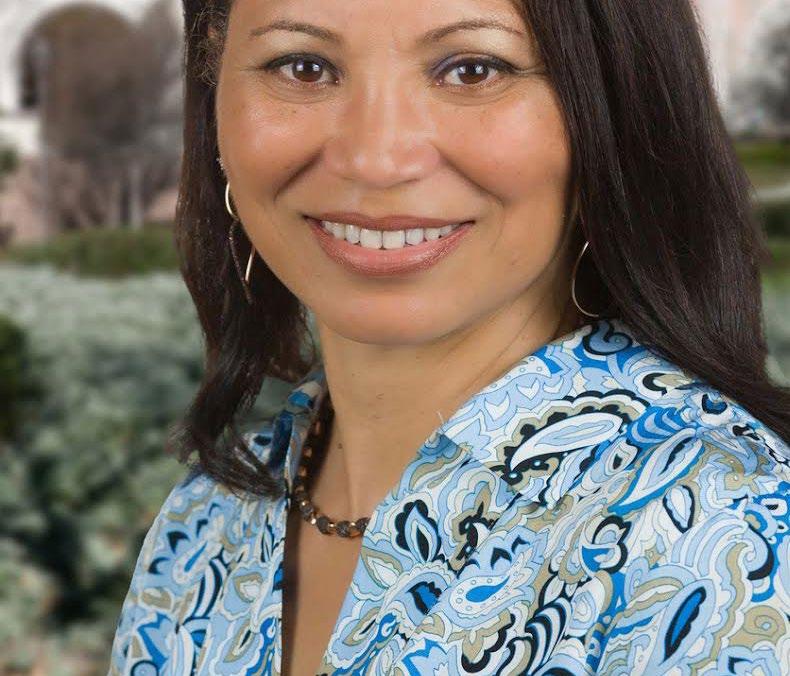
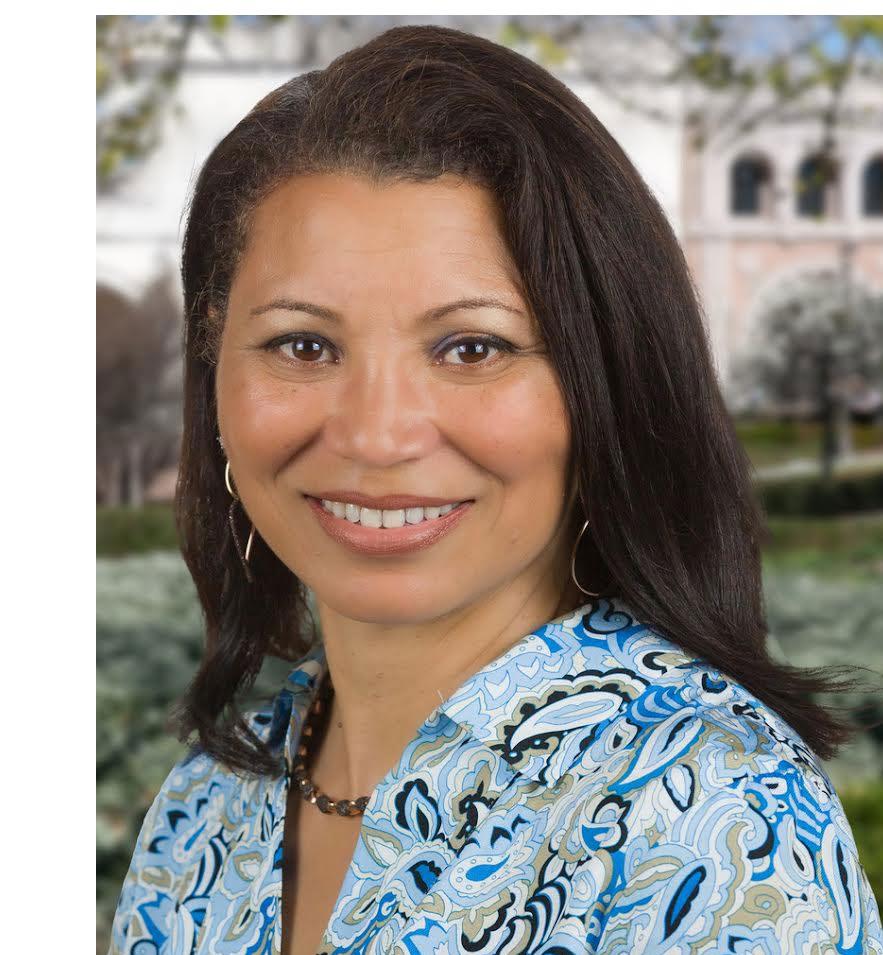
“At the School of Leadership and Education Sciences, we believe leadership and education should serve the common good. The State of Nonprofits and Philanthropy Report reflects that commitment by grounding learning and decision-making in the real conditions facing San Diego’s nonprofit community. Through this work, The Nonprofit Institute advances SOLES’ approach to engaged scholarship, connecting research, practice, and community impact. It is an essential part of how SOLES lives its mission in the community.”
Dr. Kimberly White-Smith DEAN, SCHOOL OF LEADERSHIP AND EDUCATION SCIENCES
13,261 3,193
$10.0B
$0.0B
SUBSECTORS BY NUMBERS AND REVENUE NONPROFIT
$60,000
Dear
Colleagues and Community Partners,
In moments of instability, where we focus matters. The 2025 State of Nonprofits and Philanthropy Report intentionally brings San Diego’s nonprofit sector into focus, not only as a collection of organizations, but as part of the civic infrastructure that supports community well-being. This year’s report follows a consequential period of federal policy shifts and offers an early assessment of how those changes are shaping funding, eligibility, and access to services across the region.
These changes are no longer abstract. They are influencing how communities experience need and how nonprofit organizations sustain the systems residents rely on. High levels of community trust continue to position nonprofits as primary access points for support, even as organizations navigate funding volatility, policy uncertainty, and rising demand.
We are grateful to the nonprofit leaders, staff, board members, funders, and public partners who have come together over the past year in new and constructive ways. Across the sector, many have taken a critical look at long-standing practices, examined assumptions, and worked collaboratively to better align resources and systems with emerging community needs. That willingness to learn, adapt, and work differently remains a defining strength of San Diego’s nonprofit community.
The data presented in this report underscore both the scale and complexity of the sector’s role. Leaders describe navigating increased demand alongside shifting policy conditions and access constraints that shape staffing, planning, and service delivery decisions. These pressures are occurring at the same time nonprofits are being asked, by communities and by systems, to absorb more responsibility with fewer degrees of flexibility.
Taken together, these patterns raise important questions about how well nonprofit civic infrastructure is positioned to absorb continued change. Reduced public sector investment does not eliminate need; it shifts costs into other systems and weakens the frame that holds communities together. Strengthening nonprofit capacity is not a matter of generosity. It is a matter of responsible stewardship of the systems San Diegans depend on.
This year’s State of Nonprofits and Philanthropy Report is offered as a resource for nonprofit leaders, funders, policymakers, and community partners who share responsibility for the region’s well-being. Our intention is that it supports thoughtful dialogue and informs policymaking by clarifying how the nonprofit sector is operating and what communities are asking of it.

Laura Deitrick, PhD Executive Director, The Nonprofit Institute

FEDERAL POLICY CHANGES AND FUNDING CUTS TO NONPROFITS
Since January 2025, federal policy changes affecting nonprofits have been enacted:¹
executive orders and actions have been issued
pieces of legislation have been introduced
state and federal-level legal cases challenging executive orders, grant programs, and impact investment initiatives have been filed
Heavily Impacted Issues and Causes Diversity, Equity, and Inclusion practices
NONPROFIT FINANCIAL HEALTH
Federal policy changes and funding cuts are accelerating revenue losses at a time when many in San Diego County are struggling to survive the high cost of living and rely on nonprofits for support.
share of nonprofit revenue coming from the government²
Although all subsectors rely on government funding, Human Services, Education, and Health receive the largest share of government funding.
of nonprofit leaders have experienced a decrease in funding from at least one major revenue source
of nonprofits reported their financial health as “very strong,” down from last year’s
"We are expecting a 20% decrease in revenue next year. This represents an even worse year than 2025 where we’ve experienced the loss of federal support, longstanding state support, and a significant drop in foundation support.”
San Diegans place high levels of trust in nonprofit organizations, particularly those providing basic human services. That trust shapes where residents turn when they need help meeting essential needs.
In 2025, nearly 500,000 calls were made to 2-1-1 San Diego, a local nonprofit that operates a 24-hour call center connecting residents to community and health services. Call volume reflects real-time requests for assistance related to housing stability, food access, health needs, utilities, and financial hardship.
Patterns in Basic Human Services Housing, food, utilities, health care, and financial assistance remain the most common reasons residents seek help from 2-1-1. Demand for these core services can shift quickly in response to external conditions.
During the federal government shutdown, emergency food assistance calls increased to six times the average weekly level, with four times as many households seeking food support. Demand increased sharply following delays in benefit delivery.
90% 75% 40%
of callers needed immediate housing assistance of callers reported that their utility bill exceeded 25% of their income and 90% had to prioritize needs like housing and utilities over food
of callers experienced food insecurity
In the most recent public opinion survey of San Diego residents, 85 percent reported confidence in nonprofit organizations, compared to 68 percent in businesses and 51 percent in government. This level of trust positions nonprofits as the primary access point when residents seek help meeting essential needs.
of
of
Federal policy changes and legal actions are creating uncertainty across the nonprofit and philanthropic ecosystem, affecting funding flows, planning horizons, and organizational stability.
Reliance on a limited number of funding sources contributes to organizational vulnerability.
Community trust in nonprofits remains high.

DEMAND FOR NONPROFIT SERVICES LEADERSHIP ACTIONS TAKEN TO ADDRESS NONPROFIT RESOURCE SHORTFALLS
The region’s nonprofits face a widening gap: demand for services is increasing, yet fear, funding cuts, and policy changes are reducing access and preventing many community members from seeking help.
of nonprofits reported an increase in demand for their services
Of these, only of nonprofits have a waitlist for their services
of leaders reported increased fear, anxiety, and confusion among their constituents
"Fear is causing increased absenteeism and a decrease in use of health services which impacts both adults and their children.”
of leaders reported decreased community participation due to fear or legal concerns
Leaders are having to consider new revenue sources, painful cuts to programs and staff, and temporary stopgap measures to maintain operations and meet ongoing demand.
Volunteering rates have recovered since the pandemic.
Households
Giving rates have remained stable over the last 5 years.
San Diego households donated an average of
"I think the economy is making it harder to donate to charity and make a difference in the community.”
Residents who can afford to give have tried to fill in where federal dollars left off.
of San Diego Residents reported that current events have changed where they plan to give
• Homelessness
• Immigration/migrants
• Food security
• Animals
Changes in Causes Residents Donated to: per quarter
• Organizations and communities targeted by federal policies of San Diego households donated to nonprofits 47% $546 72% 31% $
"The federal funding for the arts is slashed so I’m giving more.”
"We plan to give due to the government shutdown.”
of residents agree that it is in their power to improve the welfare of others, by personally giving or volunteering


Growing gaps between service demand and nonprofit capacity are shaping how public programs and vital services are experienced at the community level.
Policy uncertainty and enforcement climates are influencing whether and when community members access nonprofit services, independent of underlying need.

The picture of the San Diego nonprofit workforce that has emerged is both clear and complex: a sector deeply committed to its purpose, yet struggling under unprecedented pressures and challenges not seen since the pandemic. The findings that follow come from an annual survey of nonprofit employees and bring into focus both reasons for hope and areas that require our collective attention to support the well-being of the sector and the communities it serves.
Nonprofit employees find their work meaningful and report supportive, psychologically safe workplaces, but express lower satisfaction with pay and opportunities for advancement.
envision a long-term career for themselves in the nonprofit sector are somewhat or very seriously considering leaving their jobs
Of workers that considered leaving the workforce, 67% cited inadequate compensation and 53% cited lack of growth opportunities as their reasons.
Among those who are planning to leave their job, 58% are looking for work at another nonprofit.
INCREASED TENSION AND THREATS IN MISSION-DRIVEN WORK
Although most nonprofit staff (92%) and leaders (81%) reported feeling somewhat or very safe representing their mission, tensions have been rising.
of leaders reported that staff safety influenced their decision-making at least “a little” felt targeted or threatened in the past 12 months because of their organization's mission 2/3 & & 1/3 1/3 1/4 1/3 OF LEADERS OF LEADERS OF STAFF OF STAFF
saw an increase in threats or safety concerns related to their organization’s mission or activities in the past 12 months
Hostility toward services or populations
Verbal hostility or threats in public meetings
Federal targeting and policy retaliation related to immigration, LGBTQIA+, and diversity, equity, and inclusion Online harassment
44%
of leaders were very concerned about staff experiencing burnout, while 40% were concerned about feeling burned out themselves
As a result of federal actions
"We are hearing a number of staff feeling emotionally overwhelmed and needing additional time away from client work. At the same time, morale seems to be pretty strong overall as our team is coming together more to support one another.”
TECHNOLOGY CHALLENGES AND AI EXPANSION
reported worsened emotional well-being among employees reported worsened employee morale of organizations use AI in some capacity
- Human Services nonprofit
Technology and AI offer both opportunities and threats to public trust and the nonprofit workforce.
How Nonprofits are Using AI
76%
29% 18% 39% 37% 91% 83% 88%
for background research and program planning
to automate administrative tasks (e.g., meeting summaries, chatbots, etc.)
for writing and communications for visual design or creative content for fundraising or donor engagement
Barriers and Threats to AI Use
• Lack of staff skills or training are a barrier to AI use
• Data security/privacy and environmental impacts pose a threat
"It's harder than ever to run a nonprofit… it's both exhausting, and daunting to do this work. It's not paid well, and it's emotionally difficult…I feel like I'm constantly twisting myself into knots trying to please funders, clients, and staff. And those entities are always asking for more."
- Human Services nonprofit
Workforce sustainability in the nonprofit sector is increasingly influenced by compensation limits, safety concerns, and emotional strain shaped by current funding and policy environments.
AI adoption in the nonprofit sector is advancing unevenly, shaped by differences in capacity, skills, and perceived risk.

Amid growing pressures, the nonprofit sector’s people, leadership, community trust, and collaborative spirit remain core strengths, underscoring collaboration, advocacy, and shared investment as essential strategies for resilience and impact.
Who makes up the workforce?
of leaders reported that half or more of their leadership team share the life experiences of the communities they serve
Sector Strengths Leaders Identify as Assets to Build On
NONPROFIT SECTOR STRENGTHS AND ASSETS People and Leadership
of leaders reported that half or more of their employees share the life experiences of the communities they serve
How Leaders Describe their Strengths
Adaptable and Strong
Laser-Focused on Purpose and Impact
PARTNERSHIPS AND COLLABORATIVE PRACTICE
As pressures on nonprofit capacity grow, collaboration has emerged as a central strategy. Nonprofit leaders reported a range of collaborative approaches, from informal networks to formal mergers.
of organizations reported being involved in a collaborative or network nonprofit leaders report participating in some form of collaboration
shared service delivery
shared administrative functions
have a legal merger in process
Why collaboration matters:
of those collaborating believe it improves outcomes by a lot or a great deal
In a 2025 needs assessment, nonprofit leaders named collaboration as a key strategy in achieving the future vision of the sector, and many collaborated to address recent federal actions.
And among those that are not collaborating yet:
are interested but lack the bandwidth or knowledge to do so
The government policy and funding changes impacting nonprofits in 2025 highlights the need for nonprofits to engage in advocacy work. Many leaders met the moment in a variety of ways:
of leaders reported having a basic or strong understanding of advocacy nonprofits can do
of nonprofits participated in public meetings or communicated with policymakers on an issue related to their mission 75%
NONPROFIT PRIORITIES AND FUNDER RESPONSE
of nonprofits took a position on a policy issue in the last year
Local foundations also heeded the call to respond to pressures impacting the sector. In a San Diego County survey of local foundations, 83% of respondents reported shifting their giving practices in response to current funding and policy changes.
TOP NONPROFIT PRIORITIES FROM FUNDERS
PERCENT OF FUNDERS WHO TOOK THIS ACTION IN 2025
4 out of 10 48% 45% 69%
CONTINUED NEED FOR BOARD ENGAGEMENT AND DEVELOPMENT
Findings on nonprofit boards extended a four-year trend showing the ongoing need for engaged and skilled board members.
61%
of boards did not change their level of engagement in response to federal policy changes
37%
of leaders felt their board had the financial knowledge needed to navigate current challenges

Other common shifts in grantmaking practices this past year:
6 out of 10
funders reported providing Convenings/ Peer Learning, Communications Training, and Consulting Support reported funding new grantees of nonprofits participated in a coalition to change public policy
Advocacy activity is becoming a more common part of nonprofit operations as organizations engage public systems that shape mission outcomes.
Collaboration is common among nonprofit organizations, while direct collaboration with public agencies and philanthropic institutions occurs less frequently.
Funding structures and grantmaking practices influence whether organizations are able to plan beyond short-term responses.
Data in this report draw from multiple sources and reflect the most recently available year. Data derived from IRS filings are subject to reporting lags and may be incomplete. Due to rounding, some charts and tables may not sum to 100%. Quotes have been lightly edited for readability.
For questions about data or methods, contact The Nonprofit Institute at nonprofit@sandiego.edu.
Data on basic needs are based on a 2025 analysis of call volume and referral activity captured through 2-1-1 San Diego’s 24hour call center and referral database.
California Employment Development Department (EDD)
Labor Market Information Division, Quarterly Census of Employment and Wages (QCEW) (2014-2023), San Diego County.
Candid Demographics
Leadership, staff, and board demographic data from Candid’s publicly available dataset of 1,006 San Diego County nonprofits with profiles updated since 2022. There is significant data missing for particular groups, including LGBTQIA+ and individuals with a disability.
Online survey of 35 funders providing funding in San Diego County, administered in September and October 2025 to capture regional funding practices.
The 2025 California Nonprofit Employee Survey was administered online between September and October 2025 through a partnership with The Nonprofit Institute. Statewide responses totaled 1,408 employees; findings in this report reflect 248 San Diego County respondents. The sample overrepresents arts, human services, and environmental nonprofits and underrepresents education, health, and very small nonprofits (fewer than 10 employees).
DataLake Nonprofit Research (datalake.net)
Nonprofit revenue and foundation asset data from 2023 IRS Forms 990, 990-PF, 990-EZ, and 990-N electronic filings, compiled and analyzed by DataLake, LLC.
The Nonprofit Institute
2025 Annual Nonprofit Leader Survey – The survey was administered online between September and October 2025 and includes a convenience sample of 253 nonprofit executive leaders in San Diego County. The sample overrepresents arts, environmental, and large nonprofits (budgets over $5 million) and underrepresents education and very small nonprofits (budgets under $250K).
2025 State of Nonprofits Quarterly Index - A quarterly online survey administered in partnership with Luth Research to measure San Diegans’ confidence in local institutions and their giving and volunteering behaviors. Each quarterly survey includes 400–550 San Diego County residents and reflects the region’s gender and racial/ethnic composition.
County of San Diego
County of San Diego 2019-2023 DEMOGRAPHIC PROFILES. https://www.sandiegocounty.gov/content/dam/sdc/hhsa/ programs/phs/CHS/2023%20SRA%20Demographic%20Profiles%20FINAL_02.05.25.pdf
County of San Diego Adult LGBQ Dashboard 2018-2022
https://www.sandiegocounty.gov/content/dam/sdc/hhsa/programs/phs/CHS/Adult%20LGBQ%20Population%20in%20 SDC%20Brief%202018-2022.pdf
Tinkler, T., Sanchez-Kerr, C., Deitrick, L., Hanabusa, E., Cardenas, B., Nelson, T., and Piper, W. (2026). 2025 Annual Report: State of Nonprofits and Philanthropy in San Diego. San Diego, CA: The Nonprofit Institute, University of San Diego.

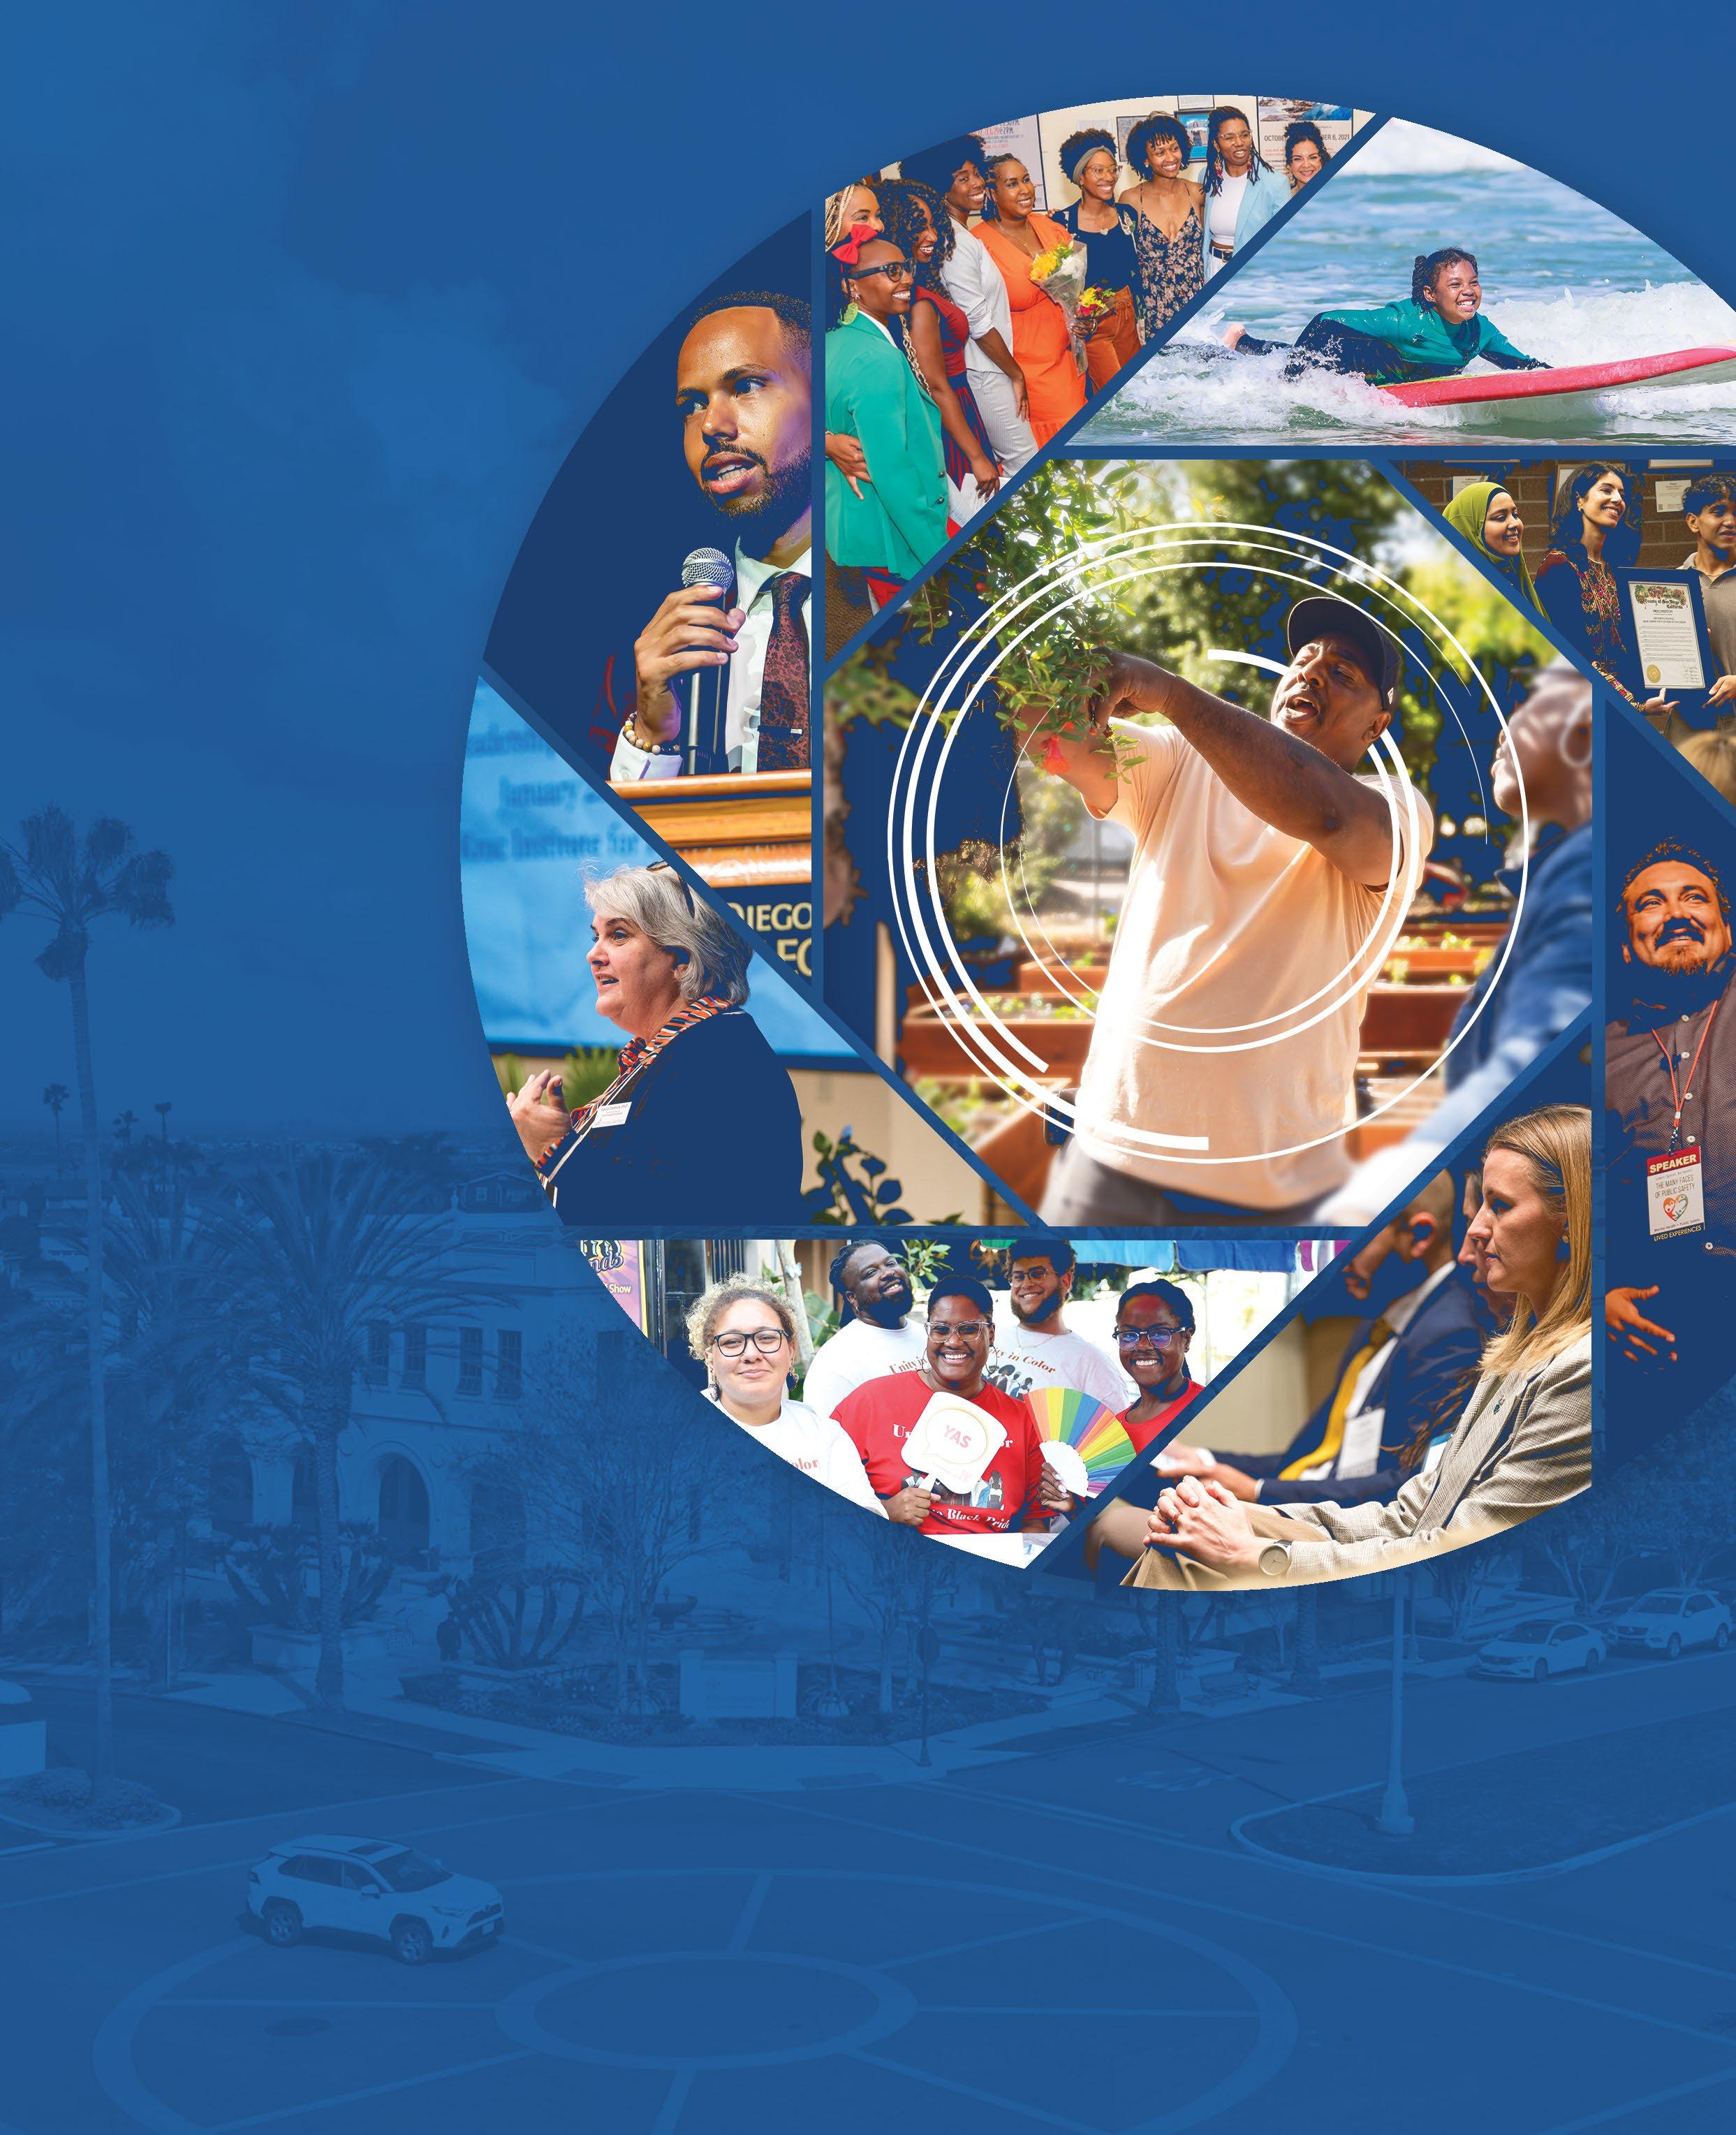
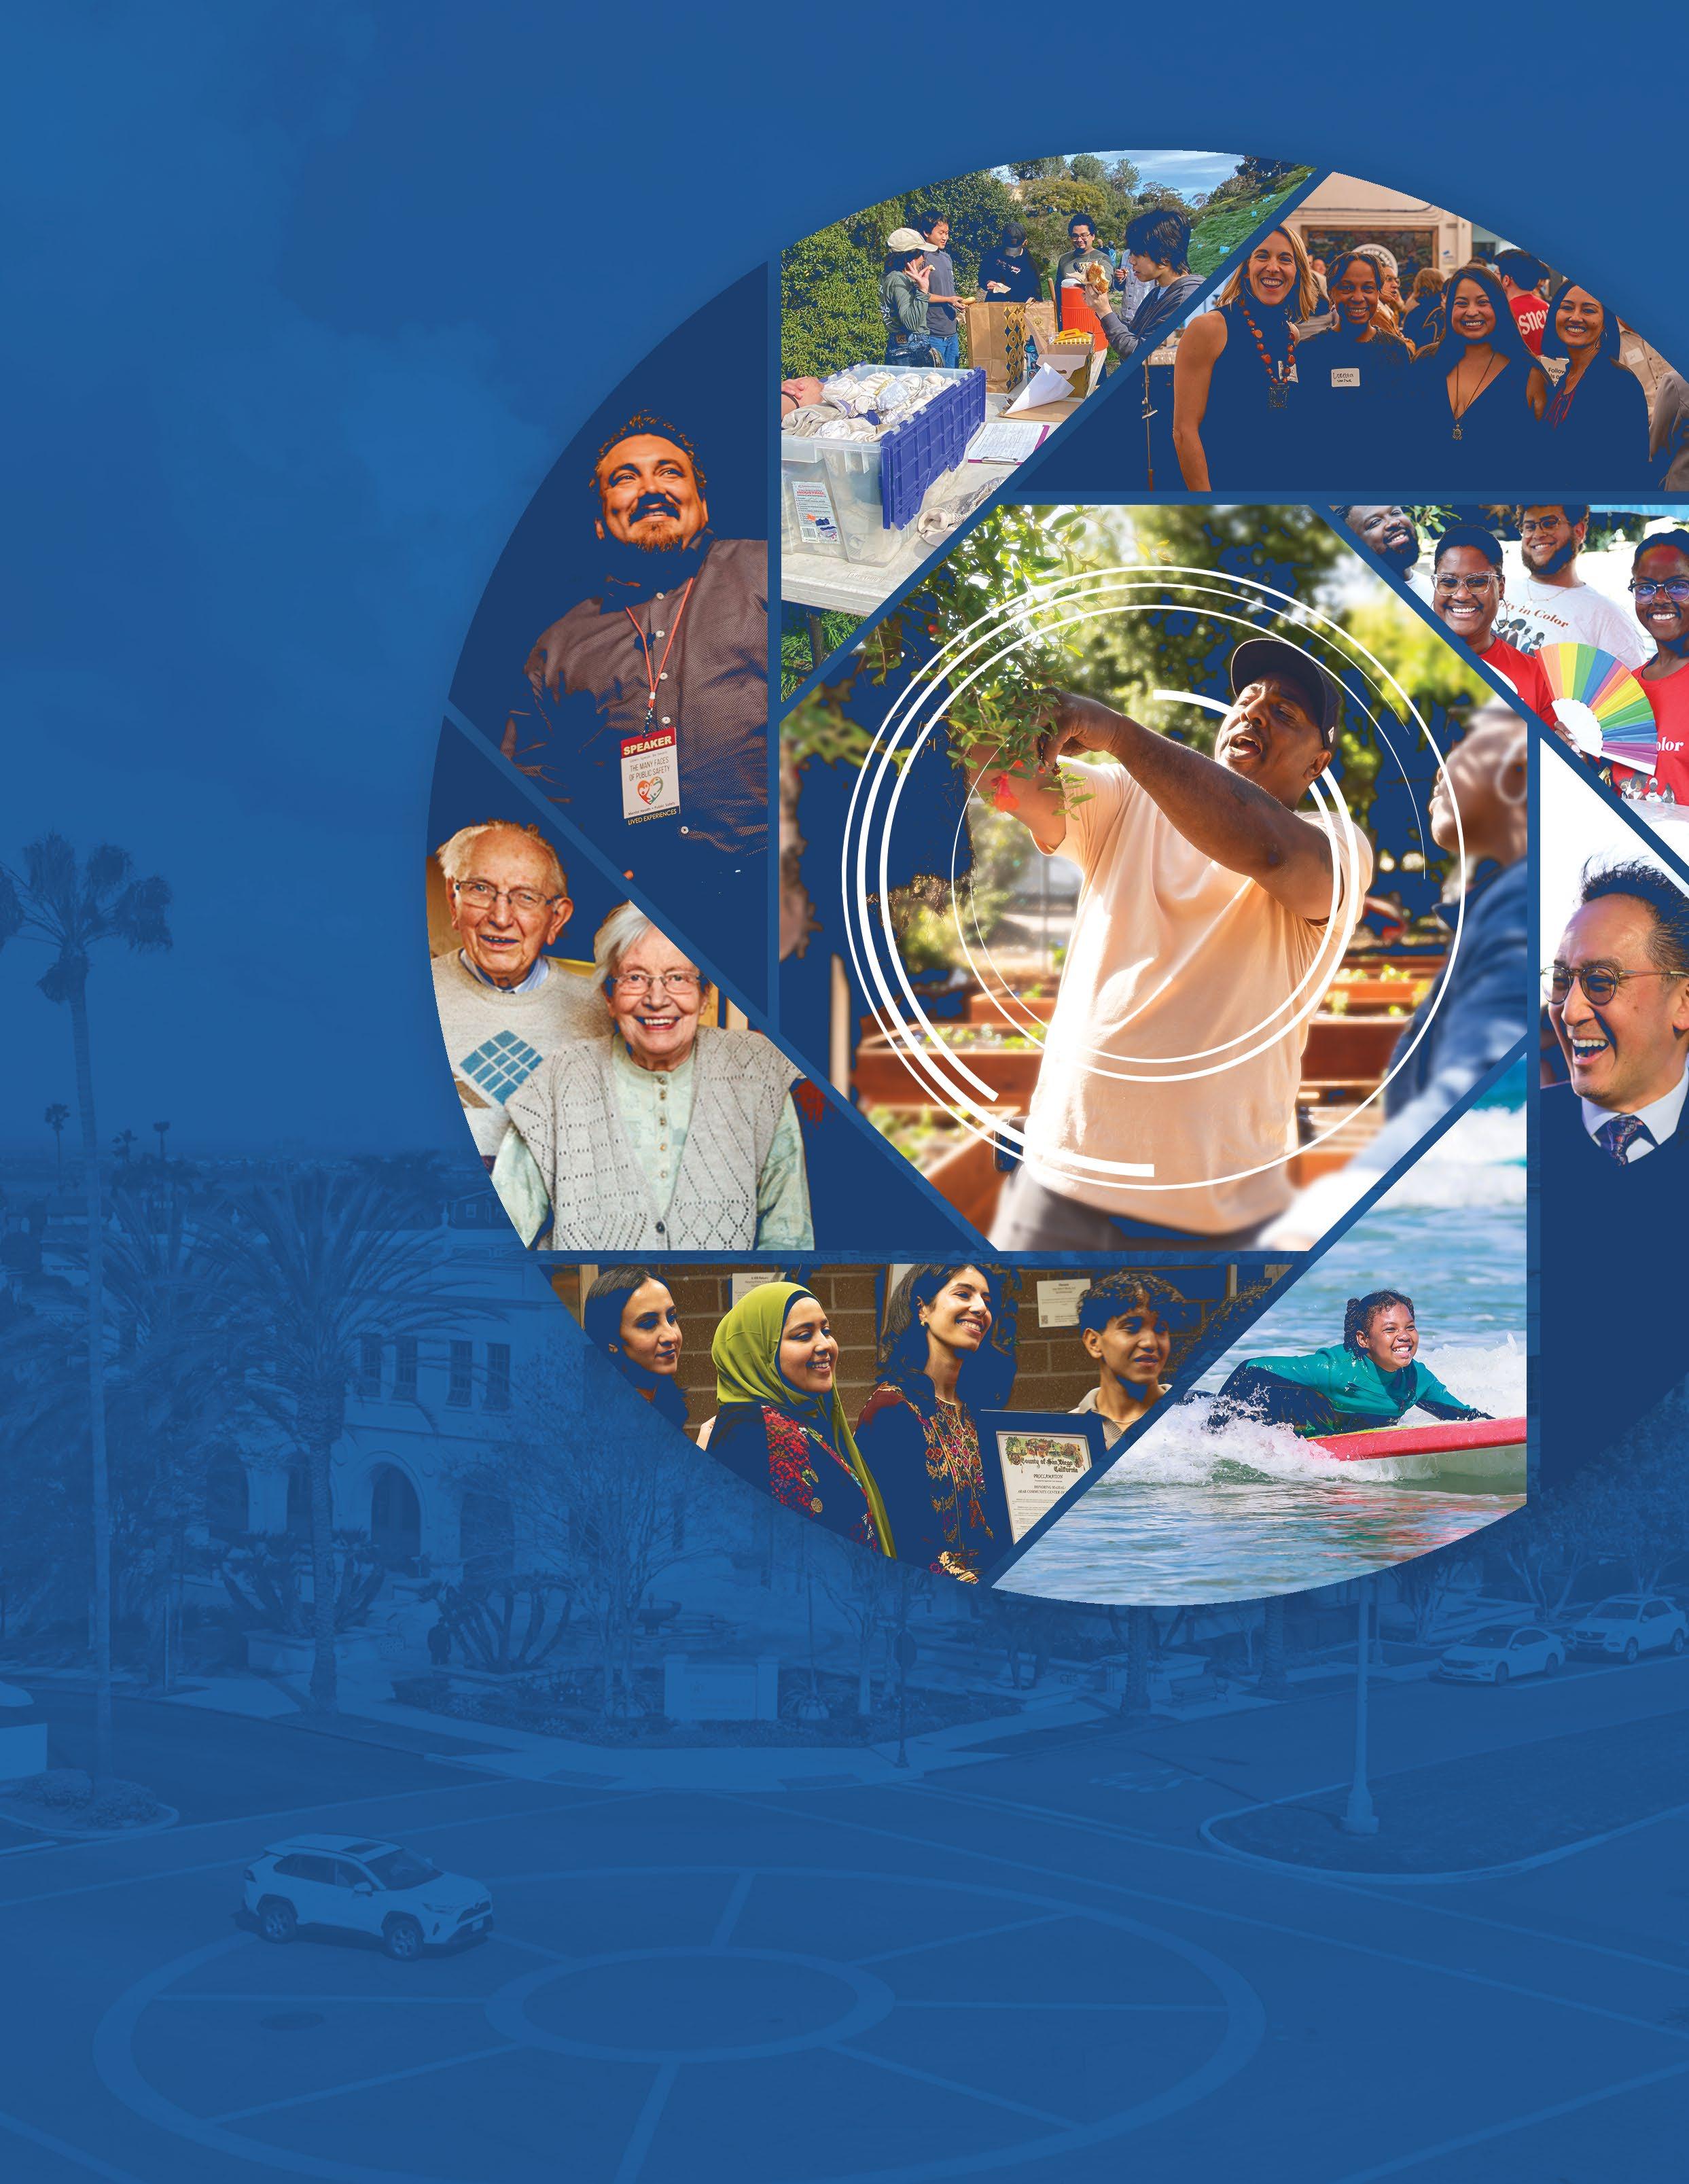
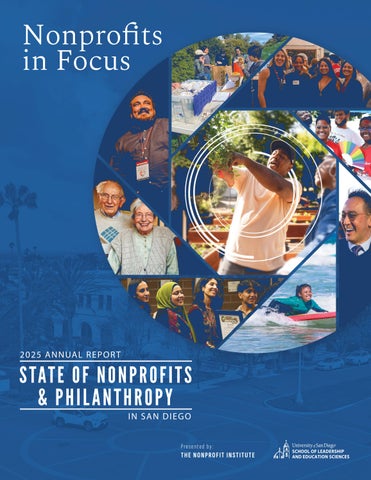
Front Cover - Clockwise, starting top center: San Diego Canyonlands, Leaders 20/20, San Diego Black Pride, NPI Advisory Board, Paddle for Peace, Majdal Community Center, Image by Ingo Bartussek via Adobe Stock, Lived Experiences, Center
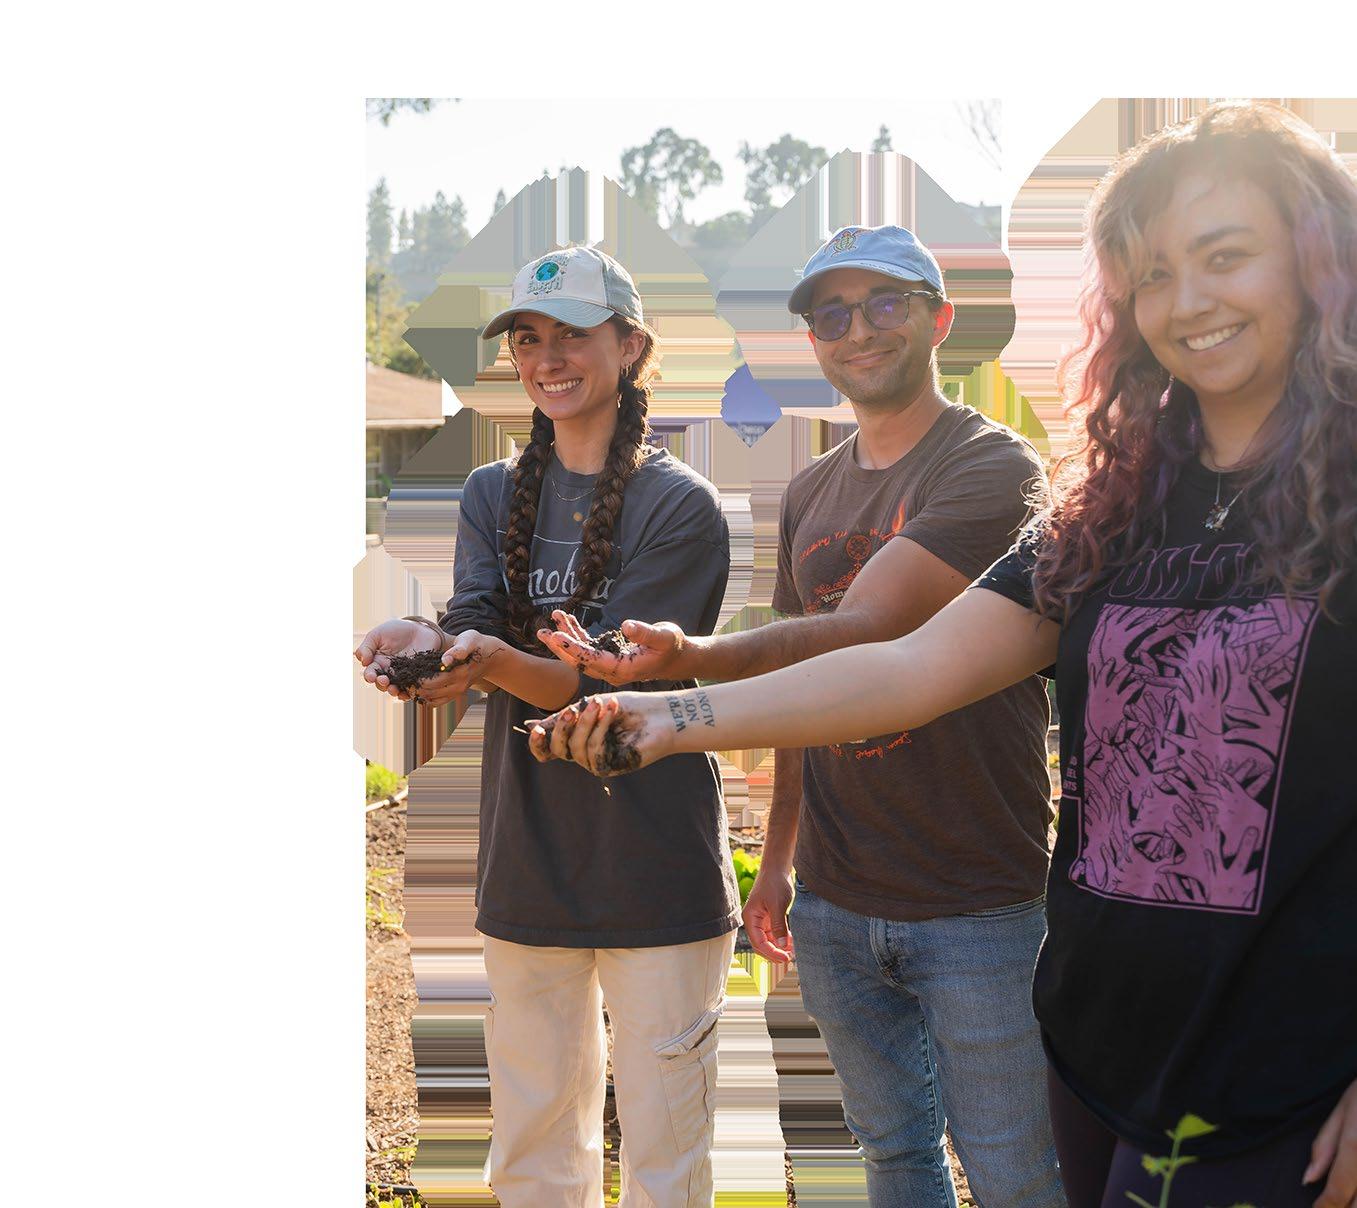
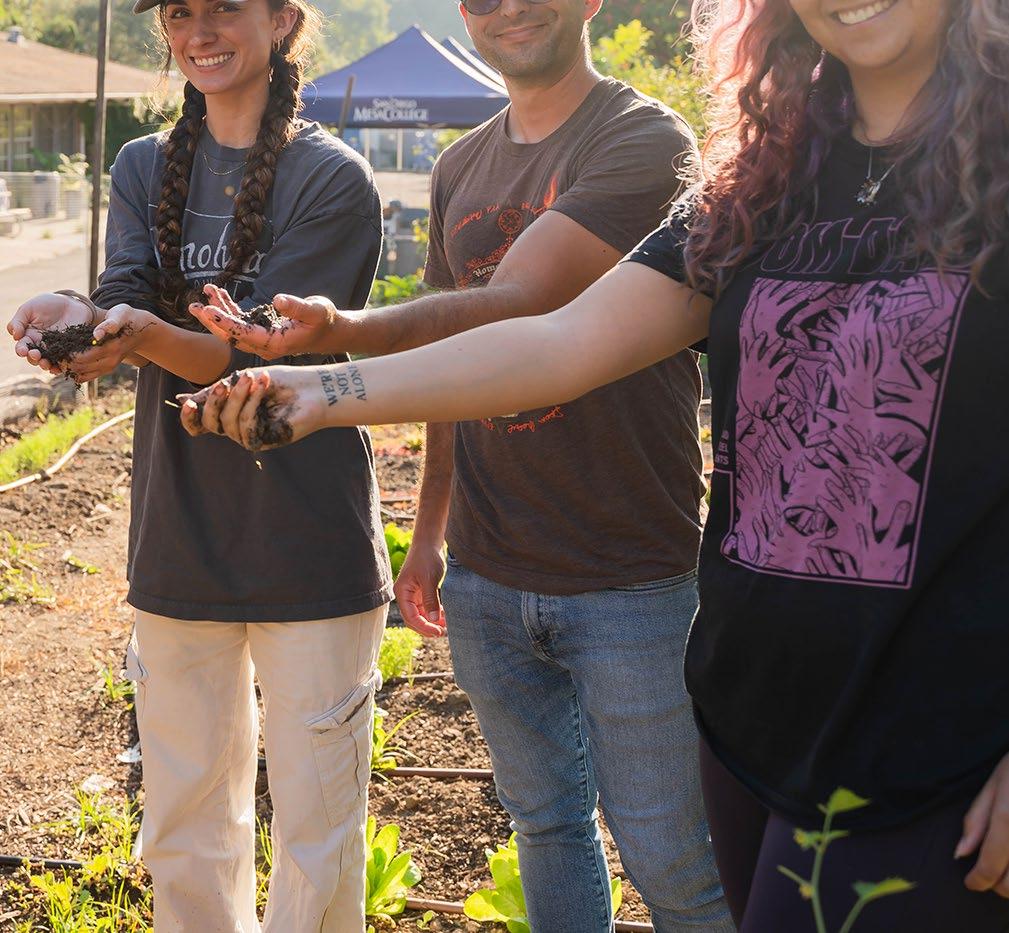
Photo: Garden 31
Page 3,5,7,9 - Top banner: Paddle for Peace
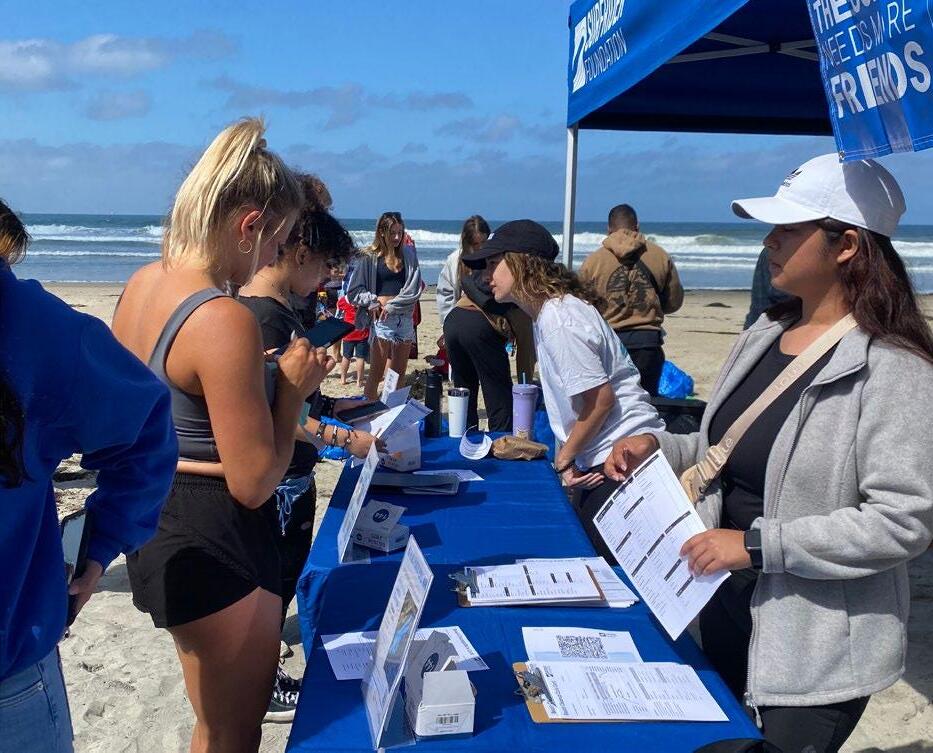
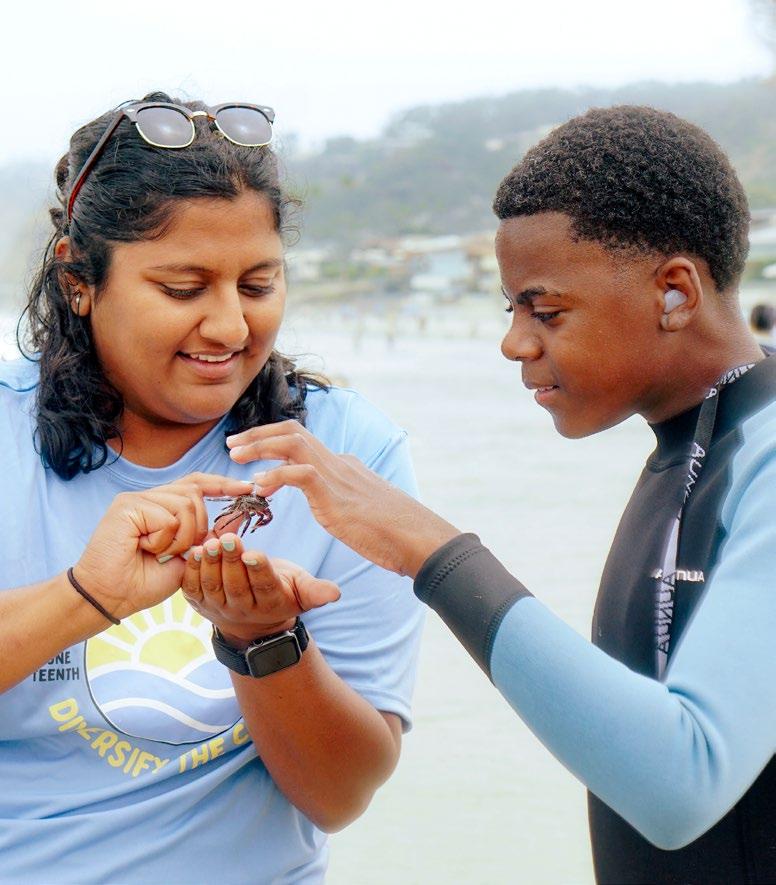
Page 4 - Surfrider San Diego
Page 6 - Top: Paddle for Peace, Middle: Garden 31, Bottom: First Gen Scholars
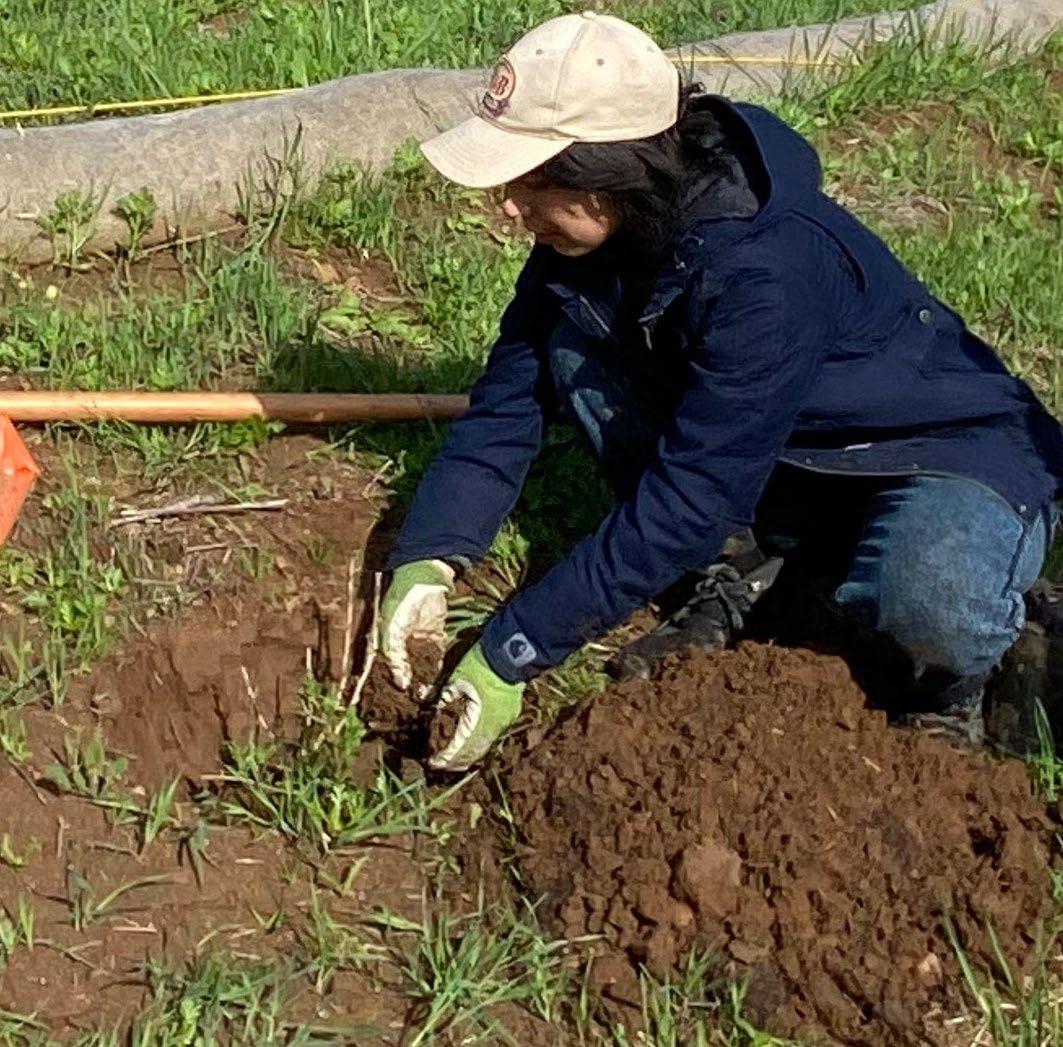
Page 8 - San Diego Canyonlands (top), Leaders 20/20 (bottom)
Page 10 - Image by insta_photos via Adobe Stock
Designed by Jason Cardenas, jasondcard@gmail.com
¹ Independent Sector. 2025. Tracking the Policy Landscape for the Charitable Sector. Retrieved February 5, 2026 from https:// independentsector.org/policy/tracking-the-policy-landscape/.
² Urban Institute. (2025). Government grants and contracts for nonprofits in 2023: Data tables from the Nonprofit Trends and Impacts survey. https://www.urban.org/sites/default/files/2025-02/Government%20Grants%20and%20Contracts%20for%20 Nonprofits%20in%202023_Data%20Tables%20from%20Nonprofit%20Trends%20and%20Study_0.pdf