
NSSE 2025
Frequencies and Statistical Comparisons
University of Houston-Downtown

NSSE 2025 Frequencies and Statistical Comparisons About This Report
The Frequencies and Statistical Comparisons report presents item-by-item student responses and statistical comparisons that allow you to examine patterns of similarity and difference between your students and those at your comparison group institutions. The report uses information from all randomly selected or census-administered students. The display below highlights important details in the report to keep in mind when interpreting your results. For more information please visit our website (nsse.indiana.edu) or contact a member of the NSSE team.
Class level: As reported by your institution.
Item numbers: Numbering corresponds to the instrument available on the NSSE website.
Item wording and variable names: Survey items are in the same order and wording as they appear on the instrument. Variable names are included for easy reference to your data file and codebook.
Values and response options: Values are used to calculate means. Response options are worded as they appear on the instrument.
Count and column percentage (%): The Count column contains the number of students who selected the corresponding response option. The column percentage is the weighted percentage of students selecting the corresponding response option.
Note: Column percentages and statistics are weighted by institutionreported sex and enrollment status. Comparison group statistics are also weighted by institutional size. Counts are unweighted and cannot be used to replicate column percentages. For details visit: go.iu.edu/NSSE-weights
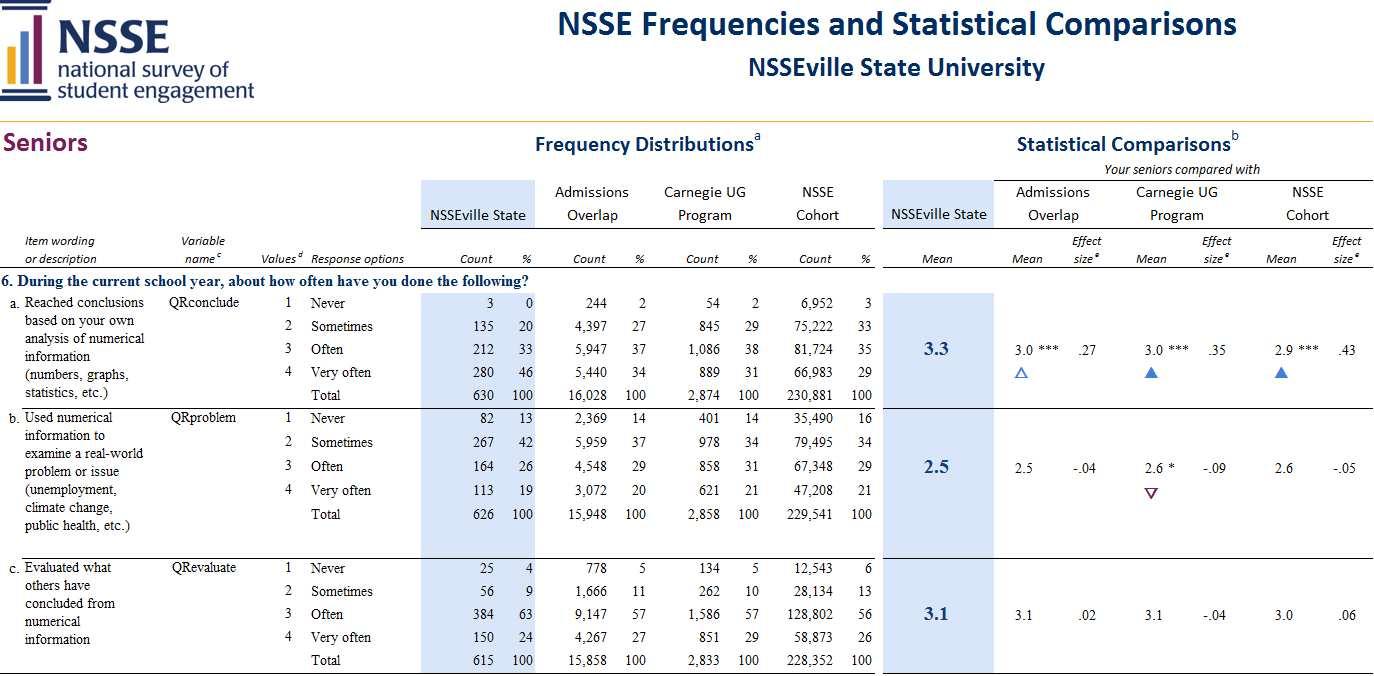
Statistical comparisons: Items with mean differences that are larger than would be expected by chance are noted with asterisks referring to three significance levels (*p < .05, **p < .01, ***p < .001). Significance levels indicate the probability that an observed difference is due to chance. Statistical significance does not guarantee the result is substantive or important. Large sample sizes will generate more statistically significant results even when the magnitude of mean differences are inconsequential. Consult effect sizes (see #7) to judge the practical meaning of differences. Unless otherwise noted, statistical comparisons are two-tailed independent t- tests. Exceptions are items 11 a-f which are compared using a z- test.
7.
Effect size: Effect size indicates practical significance. An effect size of .2 is often considered small, .5 moderate, and .8 large (NSSE adjusts this to .1/.3/.5 for the Engagement Indicators). A positive effect size indicates that your institution’s mean was greater than that of the comparison group, thus showing a favorable result for your institution. A negative effect size indicates your institution lags behind the comparison group, suggesting that the student behavior or institutional practice represented by the item may warrant attention. Effect sizes for independent t -tests use Cohen's d; z -tests use Cohen's h . Cohen's d is calculated by dividing the mean difference by the pooled standard deviation. Cohen's h is calculated by taking the difference in the proportion of students who responded “Done or in progress” after the proportion has been transformed using a non-linear (arcsine) transformation. See: Cohen, J. (1988). Statistical power analysis for the behavioral sciences (2nd edition). New York: Psychology Press.
8. Key to symbols:
▲ Your students’ average was significantly higher (p < .05) with an effect size at least .3 in magnitude.
△ Your students’ average was significantly higher (p < .05) with an effect size less than .3 in magnitude.
▽ Your students’ average was significantly lower (p < .05) with an effect size less than .3 in magnitude.
▼ Your students’ average was significantly lower (p < .05) with an effect size at least .3 in magnitude.
Note: It is important to interpret the direction of differences relative to item wording and your institutional context. You may not see all of these symbols in your report.
First-Year Students
UHD
1. During the current school year, about how often have you done the following?
Asked questions or contributed to course discussions in other ways
Asked another student to help you understand course material
Explained course material to one or more students
Prepared for exams by discussing or working through course material with other students
Worked with other students on course projects or assignments
Given a course presentation
NSSE 2025 Frequencies and Statistical Comparisons
University of Houston-Downtown Your first-year students compared with
Carnegie Class Public Texas Universities Carnegie Class Public Frequency Distributionsa Statistical Comparisonsb
Texas Universities
First-Year Students
2. During the current school year, about how often have you done the following?
Combined ideas from different courses when completing assignments
Connected your learning to societal problems or issues
Included diverse perspectives (political, religious, racial/ethnic, gender, etc.) in course discussions or assignments
Examined the strengths and weaknesses of your own views on a topic or issue
Tried to better understand someone else's views by imagining how an issue looks from their perspective
Learned something that changed the way you understand an issue or concept
NSSE 2025 Frequencies and Statistical Comparisons
*p<.05, **p<.01, ***p<.001 (2-tailed); Refer to p. 2 for key to triangle symbols. See the endnotes on the last page of this report.
First-Year Students
NSSE 2025 Frequencies and Statistical Comparisons
Connected ideas from your courses to your prior experiences and knowledge
3. During the current school year, about how often have you done the following?
Talked about career plans with a faculty member
Worked with a faculty member on activities other than coursework (committees, student groups, etc.)
Discussed course topics, ideas, or concepts with a faculty member outside of class
4. During the current school year, how much has your coursework emphasized the following?
Memorizing course material
Discussed your academic performance with a faculty member *p<.05, **p<.01, ***p<.001 (2-tailed); Refer to p. 2 for key to triangle symbols. See the endnotes on the last page of this report.
First-Year Students
NSSE 2025 Frequencies and Statistical Comparisons
Applying facts, theories, or methods to practical problems or new situations
Analyzing an idea, experience, or line of reasoning in depth by examining its parts
Evaluating a point of view, decision, or information source
Forming a new idea or understanding from various pieces of information
5. During the current school year, to what extent have your instructors done the following?
Clearly explained course goals and requirements
Taught course sessions in an organized way
First-Year Students
Used examples or illustrations to explain difficult points
Provided feedback on a draft or work in progress
Provided prompt and detailed feedback on tests or completed assignments
Explained in advance the criteria for successfully completing your assignments
Reviewed and summarized key ideas or concepts
Taught in a way that aligns with how you prefer to learn
NSSE 2025 Frequencies and Statistical Comparisons
First-Year Students
NSSE 2025 Frequencies and Statistical Comparisons
6. During the current school year, about how often have you done the following?
Reached conclusions based on your own analysis of numerical information (numbers, graphs, statistics, etc.)
Used numerical information to examine a real-world problem or issue (unemployment, climate change, public health, etc.)
Evaluated what others have concluded from numerical information
Enabled you to demonstrate your learning through quizzes, assignments, and other activities *p<.05, **p<.01, ***p<.001 (2-tailed); Refer to p. 2 for key to triangle symbols. See the endnotes on the last page of this report.
7. During the current school year, about how many papers, reports, or other writing tasks of the following lengths have you been assigned? (Include those not yet completed.)
Up to 5 pages
(Recoded version of wrshort created by NSSE. Values are estimated number of papers, reports, etc.)
First-Year Students
NSSE 2025 Frequencies and Statistical Comparisons
Between 6 and 10 pages
(Recoded version of wrmed created by NSSE. Values are estimated number of papers, reports, etc.)
11 pages or more
(Recoded version of wrlong created by NSSE. Values are estimated number of papers, reports, etc.)
Estimated number of assigned pages of student writing.
(Continuous variable, recoded and summed by NSSE from wrshort, wrmed, and wrlong. Values are estimated pages of assigned writing.)
8. During the current school year, about how often have you had discussions with people from the following groups?
People of races or ethnicities other than your own
People from economic backgrounds other than your own
(2-tailed); Refer to p. 2 for key to triangle symbols. See the endnotes on the last page of this report.
First-Year Students
People with religious beliefs other than your own
People with political views other than your own
People with sexual orientations other than your own
People from countries other than your own
9. During the current school year, about how often have you done the following?
Identified key information from reading assignments
Reviewed your notes after class
NSSE 2025 Frequencies and Statistical Comparisons
**p<.01, ***p<.001 (2-tailed); Refer to p. 2 for key to triangle symbols. See the endnotes on the last page of this report.
First-Year Students
NSSE 2025 Frequencies and Statistical Comparisons
Summarized what you learned in class or from course materials
10. During the current school year, to what extent have your courses challenged you to do your best work?
11. Which of the following have you done while
Participate in an internship, co-op, field experience, student teaching, or clinical placement
Hold a formal leadership role in a student organization or group
(Means indicate the percentage who responded "Done or in progress.")
(Means indicate the percentage who responded "Done or in progress.")
c.
Participate in a learning community or some other formal program where groups of students take two or more classes together
(Means indicate the percentage who responded "Done or in progress.")
**p<.01, ***p<.001 (2-tailed); Refer to p. 2 for key to triangle symbols. See the endnotes on the last page of this report.
First-Year Students
NSSE 2025 Frequencies and Statistical Comparisons
Participate in a study abroad program
Work with a faculty member on a research project
(Means indicate the percentage who responded "Done or in progress.")
(Means indicate the percentage who responded "Done
Complete a culminating senior experience (capstone course, senior project or thesis, portfolio, recital, comprehensive exam, etc.)
(Means indicate the percentage who responded "Done or in progress.")
12. About how many of your courses at this institution have included a community-based project (service-learning)?
13. Indicate the quality of your interactions with the following people at your institution.
Students
First-Year Students
NSSE 2025 Frequencies and Statistical Comparisons
First-Year Students
Other administrative staff and offices (registrar, financial aid, etc.)
How much does your institution emphasize the following?
Spending significant amounts of time studying and on academic work
Providing support to help students succeed academically
Using learning support services (tutoring services, writing center, etc.)
Encouraging contact among students from different backgrounds (social, racial/ethnic, religious, etc.)
NSSE 2025 Frequencies and Statistical Comparisons
**p<.01, ***p<.001 (2-tailed); Refer to p. 2 for key to triangle symbols. See the endnotes on the last page of this report.
First-Year Students
NSSE 2025 Frequencies and Statistical Comparisons
Providing opportunities to be involved socially
Providing support for your overall wellbeing (recreation, health care, counseling, etc.)
Helping you manage your non-academic responsibilities (work, family, etc.)
Attending campus activities and events (performing arts, athletic events, etc.)
Attending events that address important social, economic, or political issues
First-Year Students
NSSE 2025 Frequencies and Statistical Comparisons
15. To what extent do you agree or disagree with the following statements?
I feel comfortable being myself at this institution.
I feel valued by this institution.
I feel like part of the community at this institution.
16. About how many hours do you spend in a typical 7-day week doing the following?
Preparing for class (studying, reading, writing, doing homework or lab work, analyzing data, rehearsing, and other academic activities)
(Recoded version of tmprep created by NSSE. Values are estimated number of hours per week.)
First-Year Students
Participating in cocurricular activities (organizations, campus publications, student government, fraternity or sorority, intercollegiate or intramural sports, etc.)
(Recoded version of tmcocurr created by NSSE.
Values
of hours per week.)
Working for pay on campus
(Recoded version of tmworkon created by NSSE.
Values are estimated number of hours per week.)
Working for pay off campus
(Recoded version of tmworkoff created by NSSE.
Values are estimated number of hours per week.)
Estimated number of hours working for pay
(Continuous variable created by NSSE)
NSSE 2025 Frequencies and Statistical Comparisons
*p<.05, **p<.01, ***p<.001 (2-tailed); Refer to p. 2 for key to triangle symbols. See the endnotes on the last page of this report.
First-Year Students
Doing community service or volunteer work
(Recoded version of tmservice created by NSSE. Values are estimated number of hours per week.)
Relaxing and socializing (time with friends, video games, TV or videos, keeping up with friends online, etc.)
(Recoded version of tmrelax created by NSSE. Values are estimated number of hours per week.)
NSSE 2025 Frequencies and Statistical Comparisons
Providing care for dependents (children, parents, etc.)
(Recoded version of tmcare created by NSSE. Values are estimated number of hours per week.)
First-Year Students
NSSE 2025 Frequencies and Statistical Comparisons
(Recoded version of tmcommute created by NSSE.
Values are estimated number of hours per week.)
Commuting to campus (driving, walking, etc.) *p<.05, **p<.01, ***p<.001 (2-tailed); Refer to p. 2 for key to triangle symbols. See the endnotes on the last page of this report.
17. Of the time you spend preparing for class in a typical 7-day week, about how much is on assigned reading?
(Continuous variable created by NSSE. Calculated as a proportion of tmprephrs based on reading, where Very little=.10; Some=.25; About half=.50; Most=.75; Almost all=.90)
(Collapsed version of tmreadinghrs created by NSSE.)
First-Year Students
NSSE 2025 Frequencies and Statistical Comparisons
18. How much has your experience at this institution contributed to your knowledge, skills, and personal
Writing clearly and effectively
Speaking clearly and effectively
Thinking critically and analytically
Analyzing numerical and statistical information
Acquiring job- or work-related knowledge and skills
Working effectively with others *p<.05, **p<.01, ***p<.001 (2-tailed); Refer to p. 2 for key to triangle symbols. See the endnotes on the last page of this report.
in the following areas?
First-Year Students
Developing or clarifying a personal code of values and ethics
Understanding people of other backgrounds (economic, racial/ethnic, political, religious, nationality, etc.)
Solving complex realworld problems
Being an informed and active citizen
19. How would you evaluate your entire educational experience at this institution?
NSSE 2025 Frequencies and Statistical Comparisons
20. If you could start over again, would you go to the same institution you are now attending?
*p<.05, **p<.01, ***p<.001 (2-tailed); Refer to p. 2 for key to triangle symbols. See the endnotes on the last page of this report.
First-Year Students
Do you intend to return to this institution next year?
(Means indicate the percentage who responded "Yes.")
NSSE 2025 Frequencies and Statistical Comparisons
Seniors
1. During the current school year, about how often have you done the following?
Asked questions or contributed to course discussions in other ways
Asked another student to help you understand course material
Explained course material to one or more students
Prepared for exams by discussing or working through course material with other students
Worked with other students on course projects or assignments
Given a course presentation
NSSE 2025 Frequencies and Statistical Comparisons
Seniors
2. During the current school year, about how often have you done the following? a.
Combined ideas from different courses when completing assignments
Connected your learning to societal problems or issues
Included diverse perspectives (political, religious, racial/ethnic, gender, etc.) in course discussions or assignments
Examined the strengths and weaknesses of your own views on a topic or issue
Tried to better understand someone else's views by imagining how an issue looks from their perspective
Learned something that changed the way you understand an issue or concept
NSSE 2025 Frequencies and Statistical Comparisons
University of Houston-Downtown
Seniors
NSSE 2025 Frequencies and Statistical Comparisons
University of Houston-Downtown
Connected ideas from your courses to your prior experiences and knowledge
3. During the current school year, about how often have you done the following?
Talked about career plans with a faculty member
Worked with a faculty member on activities other than coursework (committees, student groups, etc.)
Discussed course topics, ideas, or concepts with a faculty member outside of class
Discussed your academic performance with a faculty member
4. During the current school year, how much has your coursework emphasized the following?
Memorizing course material
Seniors
NSSE 2025 Frequencies and Statistical Comparisons
University of Houston-Downtown
Applying facts, theories, or methods to practical problems or new situations
Analyzing an idea, experience, or line of reasoning in depth by examining its parts
Evaluating a point of view, decision, or information source
Forming a new idea or understanding from various pieces of information
5. During the current school year, to what extent have your instructors done the following?
Clearly explained course goals and requirements
Taught course sessions in an organized way
Seniors
Used examples or illustrations to explain difficult points
Provided feedback on a draft or work in progress
Provided prompt and detailed feedback on tests or completed assignments
Explained in advance the criteria for successfully completing your assignments
Reviewed and summarized key ideas or concepts
Taught in a way that aligns with how you prefer to learn
NSSE 2025 Frequencies and Statistical Comparisons
University of Houston-Downtown
**p<.01, ***p<.001 (2-tailed); Refer to p. 2 for key to triangle symbols. See the endnotes on the last page of this report.
Seniors
NSSE 2025 Frequencies and Statistical Comparisons
University of Houston-Downtown
Enabled you to demonstrate your learning through quizzes, assignments, and other activities
6. During the current school year, about how often have you done the following?
Reached conclusions based on your own analysis of numerical information (numbers, graphs, statistics, etc.)
Used numerical information to examine a real-world problem or issue (unemployment, climate change, public health, etc.)
Evaluated what others have concluded from numerical information
7. During the current school year, about how many papers, reports, or other writing tasks of the following lengths have you been assigned? (Include those not yet completed.)
Up to 5 pages
wrshortnum
(Recoded version of wrshort created by NSSE. Values are estimated number of papers, reports, etc.)
Seniors
Between 6 and 10 pages
(Recoded version of wrmed created by NSSE. Values are estimated number of papers, reports, etc.)
11 pages or more
(Recoded version of wrlong created by NSSE. Values are estimated number of papers, reports, etc.)
NSSE 2025 Frequencies and Statistical Comparisons
University of Houston-Downtown
(Continuous variable, recoded and summed by NSSE from wrshort, wrmed, and wrlong. Values are estimated pages of assigned writing.)
8. During the current school year, about how often have you had discussions with people from the following groups?
People of races or ethnicities other than your own
Estimated number of assigned pages of student writing. *p<.05, **p<.01, ***p<.001 (2-tailed); Refer to p. 2 for key to triangle symbols. See the endnotes on the
People from economic backgrounds other than your own
page of this report.
Seniors
People with religious beliefs other than your own
People with political views other than your own
People with sexual orientations other than your own
People from countries other than your own
During the current school year, about how often have you done the following?
Identified key information from reading assignments
Reviewed your notes after class
NSSE 2025 Frequencies and Statistical Comparisons
University of Houston-Downtown
Seniors
NSSE 2025 Frequencies and Statistical Comparisons
University of Houston-Downtown
Summarized what you learned in class or from course materials
10. During the current school year, to what extent have your courses challenged you to do your best work?
11. Which of the following have you done while in college or do you plan to do before you
Participate in an internship, co-op, field experience, student teaching, or clinical placement
Hold a formal leadership role in a student organization or group
(Means indicate the percentage who responded "Done or in progress.")
(Means indicate the percentage who responded "Done or in progress.")
Participate in a learning community or some other formal program where groups of students take two or more classes together *p<.05, **p<.01, ***p<.001 (2-tailed); Refer to p. 2 for key to triangle symbols. See the endnotes on the last page of this report.
(Means indicate the percentage who responded "Done or in progress.")
Seniors
NSSE 2025 Frequencies and Statistical Comparisons
University of Houston-Downtown
Participate in a study abroad program
Work with a faculty member on a research project
(Means indicate the percentage who responded "Done or in progress.")
(Means indicate the percentage who responded "Done or in progress.")
Complete a culminating senior experience (capstone course, senior project or thesis, portfolio, recital, comprehensive exam, etc.)
(Means indicate the percentage who responded "Done or in progress.")
12. About how many of your courses at this institution have included a community-based project (service-learning)?
13. Indicate the quality of your interactions with the following people at your institution.
Students
*p<.05, **p<.01, ***p<.001 (2-tailed); Refer to p. 2 for key to triangle symbols. See the endnotes on the last page of this report.
Seniors
NSSE 2025 Frequencies and Statistical Comparisons
University of Houston-Downtown
Academic
Seniors
Other administrative staff and offices (registrar, financial aid, etc.)
Spending significant amounts of time studying and on academic work
Providing support to help students succeed academically
Using learning support services (tutoring services, writing center, etc.)
Encouraging contact among students from different backgrounds (social, racial/ethnic, religious, etc.)
NSSE 2025 Frequencies and Statistical Comparisons
University of Houston-Downtown
Seniors
NSSE 2025 Frequencies and Statistical Comparisons
University
of Houston-Downtown
Providing opportunities to be involved socially
Providing support for your overall wellbeing (recreation, health care, counseling, etc.)
Helping you manage your non-academic responsibilities (work, family, etc.)
Attending campus activities and events (performing arts, athletic events, etc.)
15. To what extent do you agree or disagree with the following statements?
I feel comfortable being myself at this institution.
Attending events that address important social, economic, or political issues *p<.05, **p<.01, ***p<.001 (2-tailed); Refer to p. 2 for key to triangle symbols. See the endnotes on the last page of this report.
Seniors
NSSE 2025 Frequencies and Statistical Comparisons
University of Houston-Downtown
I feel valued by this institution.
I feel like part of the community at this institution.
16. About how many hours do you spend in a typical 7-day week doing the following?
Preparing for class (studying, reading, writing, doing homework or lab work, analyzing data, rehearsing, and other academic activities)
(Recoded version of tmprep created by NSSE. Values are estimated number of hours per week.)
Seniors
NSSE 2025 Frequencies and Statistical Comparisons
University of Houston-Downtown
Participating in cocurricular activities (organizations, campus publications, student government, fraternity or sorority, intercollegiate or intramural sports, etc.)
(Recoded version of tmcocurr created by NSSE.
Values are estimated number of hours per week.)
Working for pay on campus
(Recoded version of tmworkon created by NSSE.
Values are estimated number of hours per week.)
Working for pay off campus
(Recoded version of tmworkoff created by NSSE.
Values are estimated number of hours per week.) *p<.05, **p<.01, ***p<.001 (2-tailed); Refer to p. 2 for key to triangle symbols. See the endnotes on the last page of this report.
Estimated number of hours working for pay
(Continuous variable created by NSSE)
Seniors
Doing community service or volunteer work
(Recoded version of tmservice created by NSSE. Values are estimated number of hours per week.)
Relaxing and socializing (time with friends, video games, TV or videos, keeping up with friends online, etc.)
(Recoded version of tmrelax created by NSSE. Values are estimated number of hours per week.)
NSSE 2025 Frequencies and Statistical Comparisons
University of Houston-Downtown
Providing care for dependents (children, parents, etc.)
(Recoded version of tmcare created by NSSE. Values are estimated number of hours per week.)
Seniors
NSSE 2025 Frequencies and Statistical Comparisons
University of Houston-Downtown
Commuting to campus (driving, walking, etc.)
(Recoded version of tmcommute created by NSSE. Values are estimated number of
17. Of the time you spend preparing for class in a typical 7-day week, about how much is on assigned reading?
(Continuous variable created by NSSE. Calculated as a proportion of tmprephrs based on reading, where Very little=.10; Some=.25; About half=.50; Most=.75; Almost all=.90)
(Collapsed version of tmreadinghrs created by NSSE.) *p<.05, **p<.01, ***p<.001 (2-tailed); Refer to p. 2 for key to triangle symbols. See the endnotes on the last page of this report.
Seniors
NSSE 2025 Frequencies and Statistical Comparisons
University of Houston-Downtown
18. How much has your experience at this institution contributed to your knowledge, skills, and personal development in the following areas?
Writing clearly and effectively
Speaking clearly and effectively
Thinking critically and analytically
Analyzing numerical and statistical information
Acquiring job- or work-related knowledge and skills
Working effectively with others
Seniors
Developing or clarifying a personal code of values and ethics
Understanding people of other backgrounds (economic, racial/ethnic, political, religious, nationality, etc.)
Solving complex realworld problems
Being an informed and active citizen
NSSE 2025 Frequencies and Statistical Comparisons
University of Houston-Downtown
20. If you could start over again, would you go to the same institution you are now attending?
First-Year Students
NSSE 2025 Frequencies and Statistical Comparisons
Detailed Statistics
University of Houston-Downtown
Significance
1
b.
4
3
c.
d.
5
c.
g.
First-Year Students
9
8
6
c.
c.
d.
NSSE 2025 Frequencies and Statistical Comparisons
Detailed Statisticsg
University of Houston-Downtown
First-Year Students
NSSE 2025 Frequencies and Statistical Comparisons
Detailed Statisticsg
University of Houston-Downtown
c.
e.
First-Year Students
NSSE 2025 Frequencies and Statistical Comparisons
Detailed Statisticsg
University of Houston-Downtown
c.
e.
f.
g.
i.
Seniors
3
1
b.
d.
2
b.
c.
d.
d.
e.
g.
NSSE 2025 Frequencies and Statistical Comparisons
Detailed Statistics
University of Houston-Downtown
Comparisons
Comparisons
Seniors
c.
9
8
c.
d.
e.
See the endnotes on the last page of this report.
NSSE 2025 Frequencies and Statistical Comparisons
Detailed Statisticsg
University of Houston-Downtown
Seniors
NSSE 2025 Frequencies and Statistical Comparisons
Detailed Statistics
University of Houston-Downtown
c.
f.
g.
Seniors
NSSE 2025 Frequencies and Statistical Comparisons
Detailed Statistics
University of Houston-Downtown
c.
g.
h.
i.
j.
NSSE 2025 Frequencies and Statistical Comparisons
University of Houston-Downtown
Column percentages are weighted by institution-reported sex and enrollment status (and institution size for comparison groups). Percentages may not sum to 100 due to rounding. Counts are unweighted; column percentages cannot be replicated from counts.
All statistics are weighted by institution-reported sex and enrollment status (and institution size for comparison groups). Means calculated from ordered response options (e.g., Very often, Often, Sometimes, Never) assume equal intervals and should be interpreted with caution. Unless otherwise noted, statistical comparisons are two-tailed independent t -tests. Exceptions are the dichotomous High-Impact Practice items (11a to 11f) which are compared using a z -test.
Items which make up the Engagement Indicators include the following two-letter prefixes: CL = Collaborative Learning, DD = Discussions with Diverse Others, ET = Effective Teaching Practices, HO = Higher-Order Learning, LS = Learning Strategies, QI = Quality of Interactions, QR = Quantitative Reasoning, RI = Reflective & Integrative Learning, SE = Supportive Environment, and SF = Student-Faculty Interaction.
These are the values used to calculate means. For the majority of items, these values match the codes in the data file and codebook. For items estimating number of papers and hours per week, the values represent actual units using the midpoints of response option ranges and an estimate for unbounded options.
Effect size for independent t -tests uses Cohen's d; z -tests use Cohen's h. See page 2 for more details.
Statistical comparison uses z -test to compare the percentage who responded "Done or in progress" or "Yes."
Statistics are weighted by institution-reported sex and enrollment status (and institution size for comparison groups).
Standard error of the mean for ordered and continuous variables; standard error of the proportion for items indicating “Done or in progress” (High-Impact Practices). The 95% confidence interval is equal to the sample mean plus or minus 1.96 times the standard error of the mean.
i. A measure of the amount individual scores deviate from the mean of all the scores in the distribution.
Degrees of freedom used to compute the t -tests. Values differ from Ns due to weighting and whether equal variances were assumed.
Statistical comparisons are two-tailed independent t -tests or z -tests. Statistical significance represents the probability that the difference between your students' mean and that of the comparison group is due to chance.
l. Mean represents the proportion who responded “Done or in progress” or "Yes."