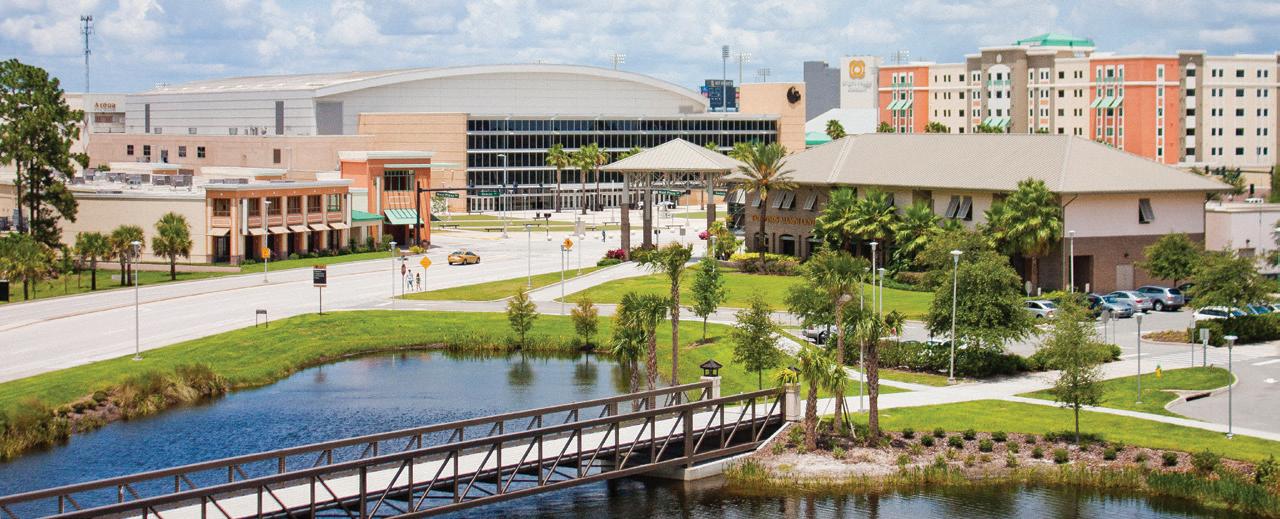
The University of Central Florida is a public, multi-campus, metropolitan research university, dedicated to serving its surrounding communities with their diverse and expanding populations, technological corridors, and international partners. The mission of the university is to offer highquality undergraduate and graduate education, student development, and continuing education; to conduct research and creative activities; to provide services that enhance the intellectual, cultural, environmental, and economic development of the metropolitan region; to address national and international issues in key areas; to establish UCF as a major presence; and to contribute to the global community.
About the Barry S. Miller College of Business
The Barry S. Miller College of Business advances the university’s mission and goal in providing intellectual leadership through research, teaching, and service. The college is striving to enhance graduate programs, while maintaining a strong undergraduate base. The college delivers research and quality business education programs at the undergraduate, master’s, doctoral, and executive levels to citizens of the state of Florida and to select clientele nationally and internationally.
We would like to recognize the following organizations for their support of the Institute for Economic Forecasting:
FLORIDA & METRO FORECAST 2026 - 2029
Published quarterly by the Institute for Economic Forecasting, Barry S. Miller College of Business, University of Central Florida
Publications of the Institute for Economic Forecasting are made possible by the following staff:
Dr. Sean Snaith, Director
Steven Abraham, Researcher
Elijah Agathe, Researcher
Noah Aguirre, Researcher
Marek Covard, Researcher
Sophia Nunez, Researcher
Paige Wolle, Researcher
This forecast was prepared based upon assumptions reflecting the Institute for Economic Forecasting judgments as of the date it bears. Actual results could vary materially from the forecast. Neither the Institute for Economic Forecasting nor the University of Central Florida shall be held responsible as a consequence of any such variance. Unless approved by the Institute for Economic Forecasting, the publication or distribution of this forecast and the preparation, publication or distribution of any excerpts from this forecast are prohibited.
HIGHLIGHTS OF THE SPRING 2026
FLORIDA FORECAST
• The Iran conflict has altered Florida’s near-term economic path. November’s elections could create another shift.
• In 2029, Florida’s nominal GDP will exceed $2.2 trillion. Real GDP (adjusted for inflation) will be $1.52 trillion.
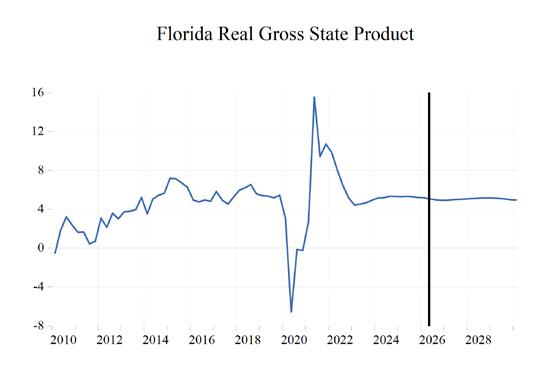
• From 2026-2029, Florida’s economy, as measured by Real Gross State Product, will expand at an average annual rate of 2.2%. Real Gross State Product will decelerate during the economic slowdown as growth falls from 3.1% in 2025 to 1.9% in 2026, then further to 1.8% in 2027, then rebound to 2.6% in 2028, before coming in at 2.4% in 2029.
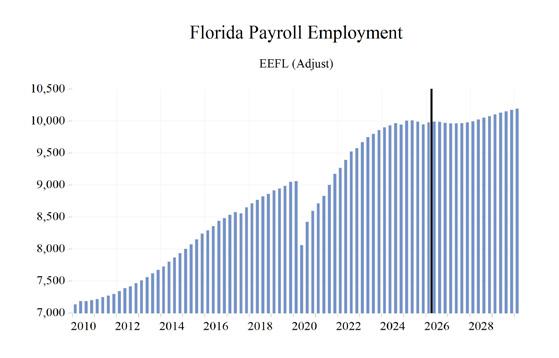
• Payroll job growth in Florida will continue to decelerate as the state’s economy slows but the unemployment rate will remain consistent with an economy operating near full employment. After year-over-year growth of 1.8% in 2024, hiring slowed to 0.6% in 2025 and will average 0.4% from 2026-2029. Total job growth in Florida will be negative in 2026 and 2027 despite growth in some sectors.
• Labor force growth in Florida will average 0.4% from 2026-2029. After shrinking 0.3% in 2025, growth will tick up to 0.7% in 2029.
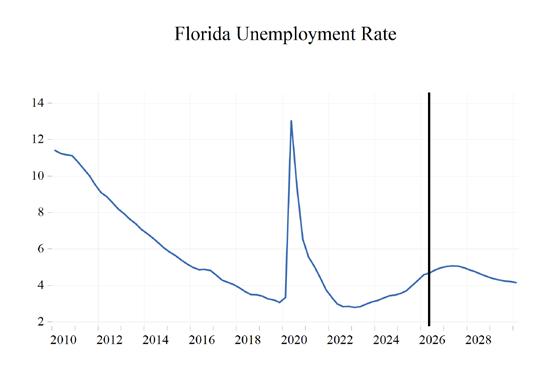
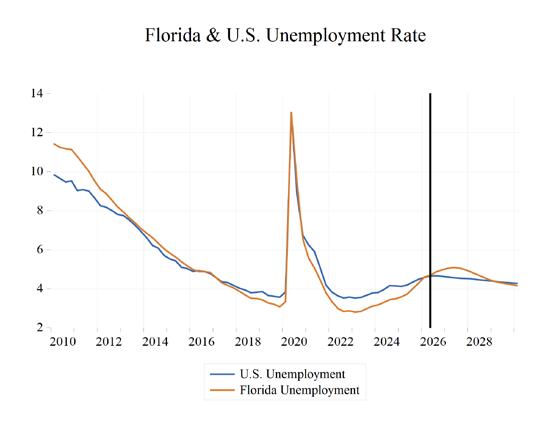
• The slowing U.S. economy pushed the unemployment rate up to 3.4% in 2024 from 3.0% the previous year, and it drifted higher to 3.9% in 2025. In 2026, the rate will hit 4.8% and 5.0% in 2027 then decline to 4.3% in 2029. During 2026-2029, Florida’s unemployment rate will average 0.1 points above our forecast for the U.S. economy.
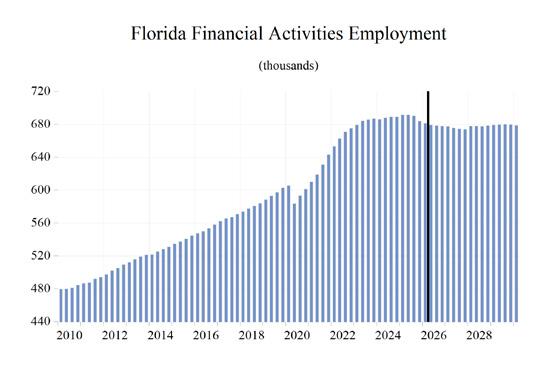
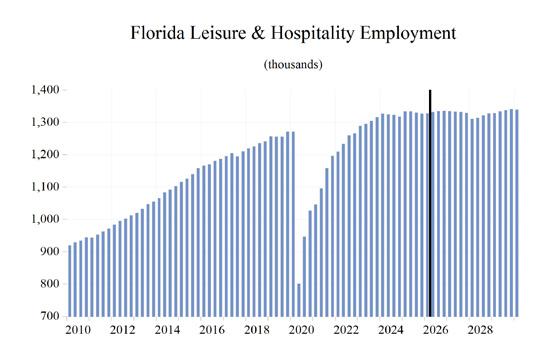
• The sectors expected to have the strongest average job growth during 20262029 are Professional & Business Services (2.1%), Construction (1.1%), Education & Health Services (1.0%), State & Local Government (0.3%), Leisure & Hospitality (0.1%), and Finance (0.4%).
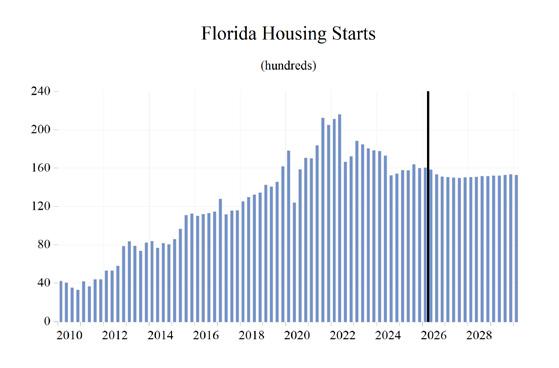
• Housing starts have felt headwinds from higher mortgage and insurance rates. Total starts were 191,500 in 2022—before higher mortgage rates and a slowing economy started a deceleration that will slow starts to 150,218 in 2027. From this point, starts will bottom out near 150,000 units in 2028 before gradually rising to 152,773 in 2029.
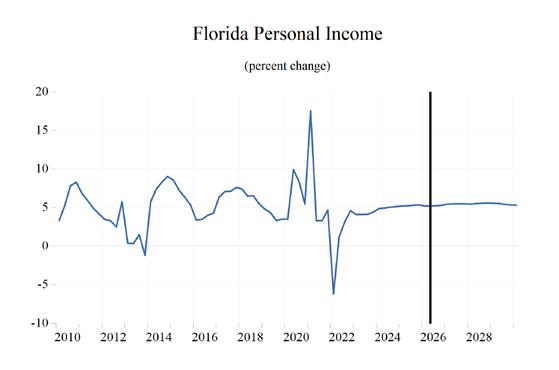
• Real personal income growth will average 2.6% during 2026-2029. Following an inflation-driven contraction in 2022 and inflation-diminished growth in 2026, growth will be 3.3% in 2029. Florida’s average growth will be 0.2 percentage points higher than the national rate over the same four-year period.
The Iran Conflict: An On-Again, Off-Again Threat to Consumers
The sudden onset of the war with Iran was immediately reflected in financial markets and the markets for oil and natural gas. The cumulative impact that it will have on the U.S. and Florida economies will ultimately depend on the duration and severity of the conflict. We have experienced multiple false ends to this conflict and endured the swings in interest rates, energy prices, and consumer sentiment that accompany it.
As of this writing, there appears to be another “end” to the conflict. Hopefully this will be a lasting solution, but several previous cease fires and deescalation efforts have proven temporary, contributing to continued uncertainty.
The longer the war lasts and the greater the damage to the oil and natural gas and shipping infrastructure in the region, the more dire the consequences would be for the economy.
Current oil and gasoline prices have not (yet) broken into record territory (as of this forecast), but they are adding strain on households that are still recovering from the highest inflation in 40 years during 2022-2023. Higher costs at the pump mean less income available for other consumer expenditures, including paying down the trillion-dollar-plus credit card debt that was accumulated during those years.
Consumer sentiment hit an all-time low in April 2026, falling below levels recorded during both the housing collapse and the COVID-19 pandemic. Yet, as is often the case, what consumers say about the economy and how they spend have not yet correlated.
If this end to the conflict doesn’t hold, it could keep energy prices high and could cause further supply interruption that would take time to fully resolve. The effect of this would ripple through sectors beyond oil and natural gas, raising costs and impacting supply in transportation (jet fuel, diesel fuel, gasoline), agriculture (fertilizers, herbicides, pesticides), healthcare (pharmaceuticals, medical devices), and a wide array household and consumer goods. Thus far these downstream impacts have been minimal and if this is the lasting end to the conflict, the economy will avoid more extensive damage.
Florida already is seeing a slower labor market than has been the case in the years following the end of COVID lockdowns, when the state’s decision to open earlier and remove pandemic-related restrictions turbocharged in migration, the economy, and labor market of the state. Those COVID policy boosters have spent all their fuel, and we are seeing a labor market that is cooling and an economy that is experiencing more modest growth.
The April 2026 single-family home report released by Florida Realtors shows a market for existing housing with a shrinking level of inventories, maintaining a housing supply shortage—though not as severe as during that surge in prices. The median price is now $162,200 above the peak price of the housing bubble in June 2006. The median sales price for single-family homes increased by $7,266 from April 2025 (year-over-year) and now stands at $420,000—a year-over-year price appreciation of 1.8%. Price depreciation in the townhome/condominium market stopped in April 2026, with no change in the median sales price year-over-year, registering at $315,000 for the month.
Inventories of single-family homes in April are down from 5.6 months of supply a year ago to 4.7 months of supply this year. This indicates an inventory balance that is once again slightly skewed in favor of the sellers in the single-family market, according to the Florida Realtors report1. From April 2025 to April 2026, inventories of condominiums fell from 10.3 months to 8.9 months, indicating that the condo market is still firmly in a buyer’s market. The existing singlefamily homes market remains skewed in the seller’s favor, but the condo market remains firmly in favor of buyers.
Distressed sales of single-family homes in the form of short sales remain at historically very low levels, showing some impact of higher mortgage rates, prices, and homeowners insurance costs. They have increased from 40 in April 2025 to 73 in April 2026, an increase of 82.5% year-overyear, but at still-low levels. Foreclosure/REO sales
1 According to Florida Realtors, the benchmark for a balanced market (favoring neither buyer nor seller) is 5.5 months of inventory. Numbers above that indicate a buyers’ market; numbers below a sellers’ market. Other real estate economists suggest a 6-to-9month inventory as being a balanced market.
also increased year-over-year versus April 2025, increasing to 191 from 156; the level of foreclosure remains low. Traditional sales are up 2.1% yearover-year versus April 2025, as stable prices, some relief on homeowners insurance rates, mitigate some of the affordability challenges that constrain potential buyers.
Distressed sales of condos in the form of short sales are still at extremely low levels—just 12 in April 2026. Foreclosure/REO sales are up 16.7% from April 2025 but remain at a low level of just 35. Traditional sales of condos are up 6.8% in April 2026 when compared to April 2025.
In April 2026, the percentage of closed sales of single-family homes that were cash transactions stood at 30.7%. For condos, that figure is much higher, as 54.7% of all closings were cash transactions. The condo market’s share of cash transactions increased by 0.7 percentage points year-over-year, while the single-family housing market’s share of cash transactions decreased by 1.1 percentage points. This is occurring amidst a still-tight market for mortgages2 .
Figure 1 depicts the monthly Realtor sales of existing single-family homes, as well as the 12-month moving average of these sales. The smoother moving average line evens out the seasonality and other statistical noise inherent in monthly housing market data. Sales were on a strong upward path in the first couple of years post-pandemic, and the 12-month moving average and monthly sales vastly exceeded their peak value during the housing bubble. After a postpandemic surge, the 12-month moving average sharply declined, then flattened out, but in recent months it has ticked up slightly year-over-year. This reflects affordability issues easing slightly in the face of softer prices over the past year; a rising
2 The Mortgage Credit Availability Index (MCAI), put out by the Mortgage Bankers Association, increased by 0.1% to 108.0 in May from April 2026. The increase in the index in May from April indicates that mortgage lending standards loosened slightly. The index is benchmarked to 100 in March 2012. Relative to that month, mortgages in May 2026 were 8.0% more available. In 2006, the value of this same index approached 900 and at the start of 2020, the index was near 185. Despite mortgage rates down somewhat from their post- COVID, financing is not available to all comers.
inventory of houses for sale; some stabilizing of homeowners insurance premiums; and post-peak mortgage rates for those able to get loans. The short-lived COVID-19 plunge in sales pulled down the moving average in 2020, but the immediate post-shutdown rebound was strong, fueled by pent-up demand and the then record-low mortgage rates.
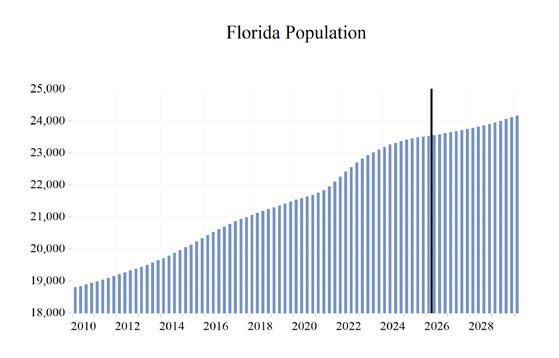
The housing market in Florida is still challenged by the burden of high prices, but somewhat stabilizing insurance premiums and slightly lower than peak mortgage rates have helped support sales. Both economic growth and job growth in Florida are forecasted to slow as the U.S. economy decelerates and the COVID turbo boost has faded. As the remaining baby boomers continue to reach the end of their working lives, this should provide for continued population growth through continued in-migration of retirees, as well as job seekers, to Florida. The rate of population growth will be modest compared to the COVID influx but should provide support for housing demand. We expect prices to remain under pressure, as increases in inventories will help keep downward pressure on prices in an environment with sustained support in the demographic drivers of housing demand.
Housing demand had some relief from higher mortgage rates that had hit nearly 8.0% at their recent peak. With the inflation from the Iran conflict reducing the likelihood of the Federal Reserve Bank resuming interest rate cuts later this year, mortgage rates could ease if the conflict reaches a durable resolution. Also, any further relief from recent surges in homeowners insurance rates could help support this demand.
Figure 2 displays median sales prices for existing single-family homes. Median sales prices have continued to climb since bottoming out in 2011. The double-digit pace of price increases in 2016
and 2017—which eased in 2018 and 2019— resumed in 2020. But, over the past year, the 12-month moving average of median sales prices has fallen by $6,089.17.
Low inventories of existing homes for sale and lagging housing starts growth since 2016 contributed to an environment where home prices were able to rise at a rapid pace. This was exacerbated by those who had refinanced mortgages at sub-3.0% levels and were hesitant to sell when current rates were over 7.0%, but they may be adjusting to the new reality of housing finance. The slowing of housing demand will result in a continued slowdown in housing starts.
The COVID period of unsustainable, multi-year price appreciation ended several years ago. The economic slowdown, coupled with relatively higher mortgage rates and rising inventories, has led to a softening of prices. These economic conditions will lead to some continued price depreciation, but not anything like the 2008-2009 collapse in prices.
Housing starts in 2029 are expected to be 152,773, falling from 183,087 in 2023. Lower mortgage rates could support this sector of the economy after higher rates had a dampening effect on home construction activity over the past few years.
Uncertainty surrounding Florida’s housing market increased with the State of Florida adding
Source: Florida Realtors
Figure 1.
Source: Florida Realtors
the “Save our Homes from Excessive Property Taxes” constitutional amendment to the November 2026 ballot. Such a large and rapid increase to the homestead exemption will have diverse and uncertain impacts across the state if it passes in November. Local governments have little time to assess the possible consequences of funding their operations and what actions to take in the face of a sudden, varied, and significant shock to the revenue that funds their operations if the amendment passes.
At this point, the overall impact on both the single family and multi-family housing markets is difficult to project in both the short run and longer-term without knowledge of whether the amendment passes and what the response of local governments might be if it does.
The remaining time between now and the November elections will hopefully provide additional information about the local consequences of passing the initiative and what they may mean to the economy and housing markets of the state.
GROSS STATE PRODUCT
COVID restrictions caused a contraction in Florida’s Real Gross State Product (RGSP) in 2020 of 1.1% year-over-year. During the Great
Recession, Florida’s economy contracted 3.9% in 2008 and 5.5% in 2009. However, the second quarter’s year-over-year decline in 2020 was steeper than any quarter during the Great Recession as travel ground to a halt and many businesses were temporarily closed (but the damage was greater for small businesses was permanent in many cases.) Fortunately, the COVID-19 recession, while deeper than the previous recessions, lasted only 2 months.
Florida’s decision to avoid the longer and more restrictive economic shutdowns on its economy that other states had adopted allowed the state to rebound rapidly in 2021, when growth soared to 9.3 percent. Since that year, growth has decelerated in Florida each year and will continue to do so through 2027.
During 2026-2029, Florida’s real GSP is expected to grow by an average of 2.2% annually. This growth will include a 2027 deceleration to 1.8% from 3.1% in 2025. The 2.2% average growth from 2026 through 2029 will be a slower pace for growth compared to the prior four years (when growth averaged 4.4%). This is due in part to an anticipated slowdown in the U.S. economy. This projected average rate of growth for Florida’s economy over the 2026-2029 period is 0.2 percentage points higher than the average of our forecasted real GDP growth for the U.S. economy (2.0%) over the same time frame.
Housing prices have increased sharply since the bottom of the housing crisis. During the low point of bursting of the bubble, median existing home prices fell to a low of $122,200 but now stand at $420,000. This price appreciation significantly improved homeowners’ balance sheets in Florida. With price appreciation to date, Florida home prices have moved well beyond the once-shocking peak levels reached during the housing bubble. But
with higher mortgage rates, a slowing economy, and affordability issues locking potential buyers out of the market, we have seen modest decline in prices over the past year. Fortunately for homeowners, but not for potential buyers, any additional price declines will not resemble the price collapse of 2008-2009.
Despite the uncertainty that has hovered over the U.S. economy this year, major stock indices continue to set record highs creating an additional wealth effect atop the home equity gains of Florida homeowners have experienced.
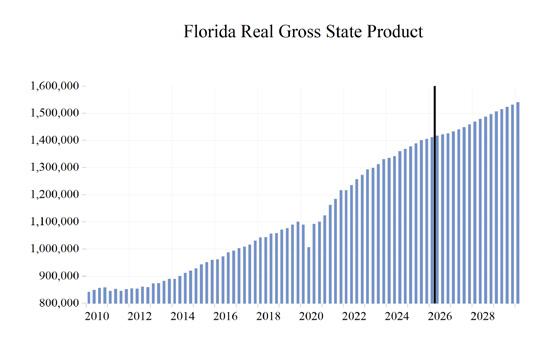
In 2017, Florida’s economy broke the $1-trillion threshold with a nominal (not adjusted for inflation) Gross State Product (GSP) which increased to $1.30 trillion in 2021. The GSP reached $1.47 trillion in 2022 and hit $1.62 trillion in 2023. We expect Florida’s GSP to rise to $1.83 trillion in 2025, $1.94 trillion in 2026, $2.03 trillion in 2027, $2.13 trillion in 2028, and $2.23 trillion in 2029.
Real GSP (adjusted for inflation) was nearly $1.2 trillion in 2021 and will climb to $1.519 trillion in 2029.
PERSONAL INCOME, RETAIL SALES, AND AUTO SALES
In 2020, nominal personal income growth surged thanks to COVID spending and federal extra unemployment payments. Amid further federal stimulus spending and tax credits, it climbed to 11.9% in 2021. Nominal personal income will be $2.20 trillion in 2029, marking an increase in personal income of nearly $1.2 trillion from its Great Recession low point in 2009.
Thanks to rising inflation, real personal income contracted by 0.4% in 2022, but rose by 4.2% in 2023. Growth was 3.8% in 2024 and slowed to 2.6% in 2025. A resurgence of inflation and a slowing of economic growth will push growth down to 0.4% in 2026 but then bounce back to
3.0% in 2027, and 3.8% in 2028. Real personal income growth during 2026-2029 will average 2.6% in Florida, weighed down by slower growth and higher inflation in the near term, but still 0.2 percentage points higher than our forecast for the U.S.
Real disposable income growth, because of surging inflation, turned negative at -4.1% in 2022. Average growth in Florida during 20262029 will be 2.7% with inflation taking another bite out of growth in 2026 and slower hiring in Florida’s labor market alongside rising—though still historically low—unemployment rates, contributed to the slowdown.
Financial markets experienced a strong rebound from the COVID-19-induced financial downturn, thanks in large part to the Federal Reserve Bank’s resumption of the financial crisis era zero-interestrate policy, quantitative easing, and in addition to the other federal government stimulus programs. The Dow Jones Industrial Average fell to 18,214 in March 2020 but then surged to a new record high of 36,953 in January 2022. The market declined as the Fed commenced its fight against inflation, causing financial markets to decline from those highs, with the Dow falling to under 34,000.
Artificial intelligence investment, new leadership at the Federal Reserve, and daily swings in the news about the Iran conflict have combined to send major stock indices to record highs, with the Dow hitting a new high of 52,281. The wealth effects of the financial markets and housing markets continue to support consumer spending.
Housing may not be as large a driver in the economy over the next two years, as housing starts have slipped from their post-pandemic heights. However, housing will still be an important economic factor as builders work to replenish, albeit at this diminished pace, inventories as Florida’s population continues to grow and the uncertainty surrounding mortgage rates will continue to support housing demand. In 20282029, we expect housing starts to begin to climb. The homestead property ballot initiative casts a
large shadow over this sector as well.
Retail spending was hurt in the short run by the public health shutdowns and the effective collapse of the tourism industry in Florida from the pandemic response. Retail spending in the first quarter of 2020 contracted by 12.6% at an annual rate, followed by a 6.2% contraction for the second quarter. Spending levels rocketed after the short, deep recession and a series of economic lockdowns, fully countering the first half of the year’s plunge, and driving full-year growth into positive territory for the year. In 2021, retail sales grew robustly compared to 2020, rising 18.9% at an annual rate. Sales returned to more sustainable growth rates from the post-lockdown growth, and after a few quarters of weak growth from an erosion of consumers’ purchasing power because of rising inflation and a slowing economy in 2023, steady growth resumed. Growth will average 3.8% during 2026-2029, coming in at 4.0% in the final year of our forecast.
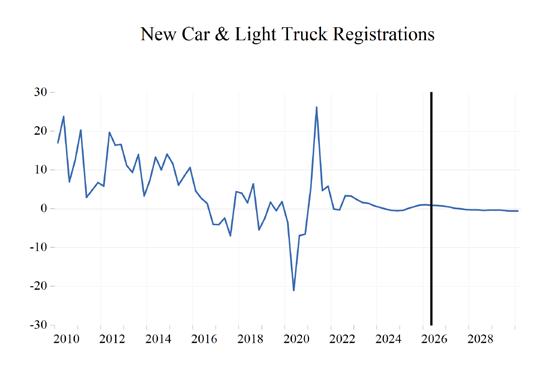
The 2020 COVID recession once again caused a contraction of new passenger car and truck registrations of 9.56% year-over-year in the fourth quarter of 2020, versus the fourth quarter of 2019. This contraction was not as sharp or as persistent as the one that took place during the Great Recession.
Supply chain disruptions injected chaos into light vehicle markets, and prices for both new and used vehicles soared in the wake of these problems. New cars were selling at thousands above sticker price and used vehicle inflation at one point hit 40% year-over-year. The rate of vehicle inflation has declined significantly, but prices remain elevated above pre-pandemic levels and interest rates on auto loans are still high, for now. Sales are likely to be sluggish over the next couple years before showing renewed growth in 2028 and 2029.
Pent-up demand and the economic recovery boosted registrations coming out of the COVID-19 recession, and vehicle registration growth in Florida surged in 2021, rising to 9.3% year over year. High auto prices during the
COVID inflation caused a double-digit decline in year over year registrations 11.25% in 2022 that was offset starting in 2023 as inflation and supply chain disruptions began to ease and in part by buyers trying to get ahead of potential tariff impacts on prices. This led to a short-lived acceleration in the growth in the number of new registrations in 2025 to 7.46%.
Registration growth in Florida during 20262029 will average just 0.1%. Surging energy prices and a slowing job market in 2026 will lead to a contraction of registrations by 1.7%. In 2029, Florida’s new passenger car and truck registrations will be slightly below 1.51 million.
EMPLOYMENT
AI, Slower Growth, And Uncertainty
Payroll employment was devastated by the COVID-19 lockdowns, as layoffs happened in a massive, but thankfully short-lived, wave. In Florida, total business payrolls surpassed their pre-pandemic levels in late 2021, as Florida ended lockdowns much sooner than most other states. Through 2025, the strength of Florida’s job market exceeded that of the national job market. During 2026-2027 we expect Florida to slip slightly behind the national slowdown in job creation.
The COVID-19 lockdowns, closures, and travel restrictions were followed by aggressive federal spending and monetary policy to counter the devastating effects of shutting down the economy. These policies added fuel to an economy that was already roaring back to life by virtue of just being allowed to reopen. The policy also had a major impact on the labor market, fueling labor shortages and rapid wage and salary growth, and eventually the highest inflation rate in the U.S. in over 40 years.
Job growth plummeted in March and April during lockdowns, contributing to a 4.9% yearover-year contraction in payroll jobs in 2020, but
Florida’s decision to open the economy and avoid lengthier lockdowns allowed job growth in the state to recover rapidly to 4.6% in 2021, and then accelerated to 5.7% in 2022.
Total payroll jobs still rose by 3.5% in 2023 and then decelerated to 1.7% growth in 2024 and further slipped to 0.6% in 2025. The deceleration will continue to -0.1% in 2026 and 2027, before rebounding again to 0.7% in 2028 and then ticking up to 1.0% in 2029. Florida’s labor market job creation growth will then again outperform the national economy in the two final years of our forecast.
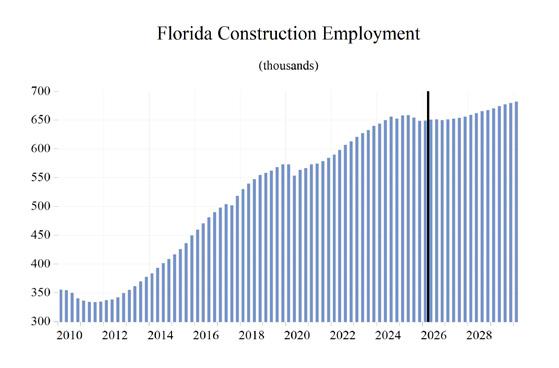
Construction job growth turned slightly negative during 2020 but bounced back in 2021, with housing starts rising amid depleted inventories and large-scale public works projects that carried on uninterrupted by COVID. Construction job growth recovered to 2.4% in 2021. Job growth rose further to 4.2% in 2022, grew by 4.7% in 2023, and then by 3.3% in 2024. Job growth slipped to 0.6% in 2025 before turning negative to -0.7% in 2026, rising 0.5% in 2027, and then to 1.5% in 2028, and finally to 1.8% in 2029. Average annual job growth during 2026-2029 will be 0.8%. Construction employment will average 675,530 in 2029.
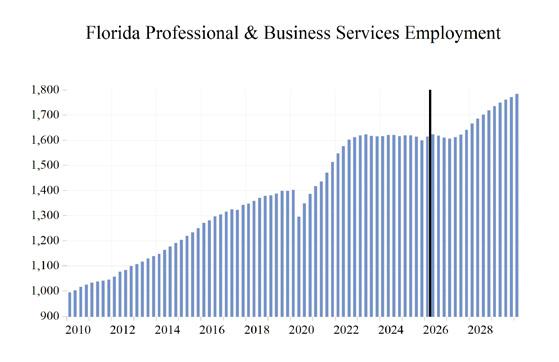
The Professional and Business Services sectors, the second-fastest growing sector coming out of the COVID recession behind Leisure and Hospitality, will see more modest growth in the next two years. Job growth in this sector is expected to average 2.1% during 2026-2029. Growth in this sector fell to -2.3% in 2020 due to the pandemic and lockdowns. Growth surged to 7.4% in 2021 and then to 8.6% in 2022. It slowed to 2.1% in 2023 and hit zero in 2024. In 2025, growth was slightly negative at -0.3%. Growth should continue with an upward trend going forward, with growth of 0.2% in 2026, 0.2% in 2027, 4.5% in 2028, and 3.6% in 2029. This is a sector that is under the significant influence of AI and how it plays out for the economy.
Artificial intelligence is creating both
opportunities and uncertainty for Florida’s labor market. Firms are increasingly adopting AI tools to improve productivity, automate routine administrative tasks, and enhance customer service. While these technologies may support long-run economic growth, they are also contributing to caution in hiring, particularly for entry-level professional occupations. The pace and scope of AI adoption remain uncertain, but its effects are expected to become increasingly important for employment growth in professional services, information industries, and other knowledge-based sectors.
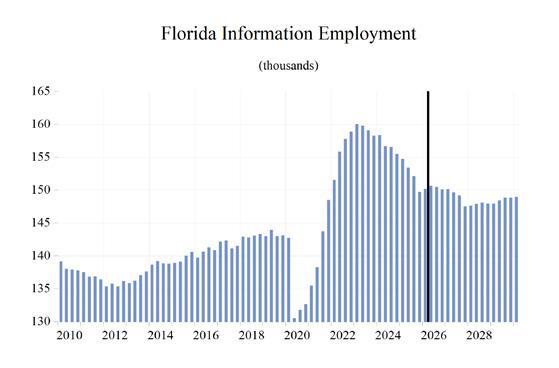
The Information sector is a mix of high-tech ventures and the transformation of the legacy print media. Structural and technological changes in the gathering and dissemination of information starting with the internet, now further complicated by AI, and who pays for this information has decimated the traditional print industry for close to two decades. Sources of growth within the information sector in Florida, such as software development, data processing and hosting, wireless telecommunications, and content creation, temporarily offset the loss of jobs in traditional print media and publishing. Job growth dropped to -6.2% in 2020, recovered to 5.4% in 2021, and hit 10.3% in 2022, boosted by the roll-out of 5G wireless services. Job growth slowed to 2.1% in 2023, before it slid to -1.6% in 2024. Job losses increased to -2.7% in 2025 and will continue to contract through 2028. In 2029, growth will be positive, but only 0.4%. The projected growth rate will average -0.7% during 2026-2029. This is another sector shaken by the uncertainty of the AI structural changes in the economy.
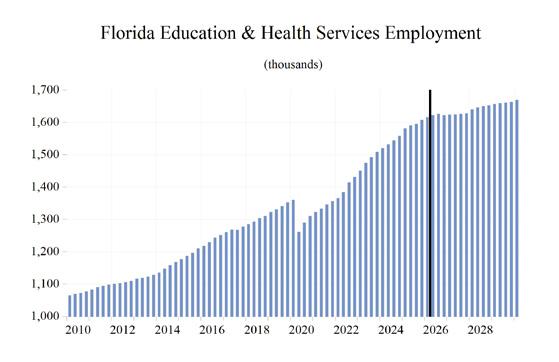
The Education and Health Services sector in Florida has been a consistent source of job growth in Florida, even during the worst part of the 20072009 Great Recession. However, the pandemic did hit this sector hard, as schools closed and most elective procedures, screenings, and wellness checks were postponed; employment contracted by 2.4% in 2020. The state’s growing population, with a larger share of older residents than many states
who have a higher demand for health services, has supported growth in this sector and will continue to do so. Job growth will continue, though at a decelerating pace, through the next several years. During 2026-2029, employment in this sector is expected to continue to expand at an average rate of 1.0%.
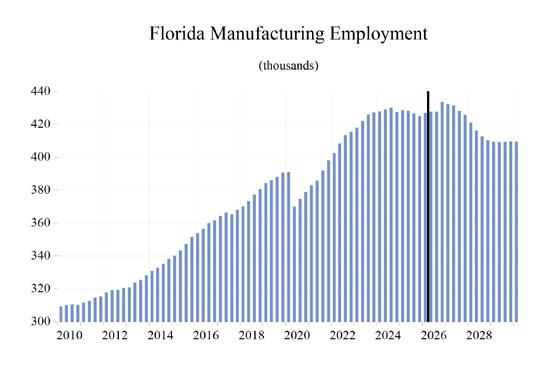
During 2016-2019, Manufacturing job growth averaged 2.9% in Florida, as trade policies helped level the playing field for U.S. manufacturers. The economic environment for the manufacturing sector is increasingly uncertain as slower economic growth looms for the U.S., coupled with the uncertainty in Washington, D.C. surrounding tariffs and trade deals following the U.S. Supreme Court decision that overturned many of the tariffs. After job losses of 2.2% in manufacturing in 2020, the economy and manufacturing in Florida recovered. Job growth accelerated to 2.9% in 2021 and rose by 5.2% in 2022. After that year’s burst of growth, job growth decelerated to 3.2% in 2023, then slowed to 1.4% in 2024 and -0.3% in 2025. The sector will once again lose jobs from 2026 through 2029. Average job growth during 20262029 will be -1.0 percent.
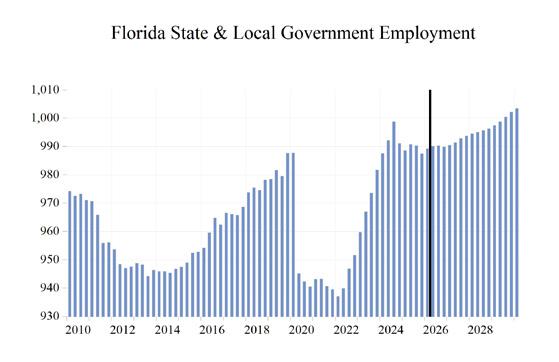
The State and Local Government sector in Florida has enjoyed higher revenues from increased property values and state sales tax revenues that have exceeded forecasts for several years. As housing prices soared during 2020-2022, property tax revenues rose, as well. Though housing price growth has slowed, there will not be a repeat of the local government budget shortfalls after the housing market crashed, which led to job losses in this sector that persisted for six years from 2009 through 2014. The caveat here is the ballot initiative that would raise homestead exemptions significantly.
The debate for property tax reform gained momentum in Florida. As of this writing, it seems likely a constitutional amendment will be on the November 2026 ballot. Though there are outstanding challenges regarding the initiative known as Save Our Homes from Excessive Property Taxes Amendment currently before the courts.
Key provisions of the amendment 3:
1. Increases the homestead tax exemption for non-school taxes to $150,000 in 2027 and $250,000 in 2028, with the amount indexed to inflation starting in 2029.
2. New residents would receive a smaller exemption until they’ve lived in the state for five years.
3. Lower the cap on how much the assessed value of other properties, such as rentals and commercial buildings, can increase each year to 5% (from 10%,) excluding school taxes.
4. Limit how counties and municipalities can spend property tax revenue on public safety, education, infrastructure, natural resource projects and flood control, local bonds, employee retirement benefits, and government operations; and other changes.
What was not fully addressed during consideration of the amendment was how local governments would replace lost property-tax revenue and maintain existing service levels. With very little time before the November elections local governments are required to rapidly evaluate provisional changes to budgets if the ballot initiative passes in November.
The accelerated timetable has limited the opportunity for local governments to fully evaluate the fiscal implications of the proposal.
As Florida’s population and economy continue to grow, albeit at a slower pace than in the past four years, the demand for state and local government services continues to rise as well. To meet this demand, growth in state and local government employment will be necessary, but not at the levels seen during the housing boom of 2004-2006 and in the wake of the homestead exemption ballot initiative. After annual job growth hit 2.8% in 2023, 2.6% in 2024, and -0.3% in 2025, it will remain modest through the end of our forecast
3 For more information see: https://ballotpedia.org/Florida_ Homestead_Tax_Exemptions,_Property_Assessments,_and_ Spending_Restrictions_Amendment_(2026)
horizon. The slowing economy, softening housing market and the homestead ballot initiative uncertainty will put pressure on both sales and property tax revenue growth. Average job growth in State and Local Government during 2026-2029 will be 0.3%.
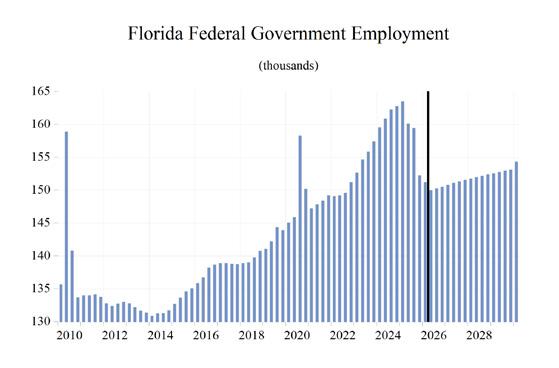
Federal Government employment growth, which was boosted by the decennial census hiring, turned negative in 2021 after the temporary hiring surge during the 2020 census year ended. From 20222024 growth averaged 2.9%, but in 2025 spending contracted. However, historic deficits, a national debt of over $39.2 trillion, and an increasing debt service burden of over $1 trillion dollars per year will become considerable factors going forward. Job growth in the Federal Government sector in Florida will average -0.9% during 2026-2029; the outcome of the Iran conflict will play a significant role.
UNEMPLOYMENT
The unemployment rate in Florida has plummeted from its May 2020 peak of 14.2% and stands at 4.8% as of April 2026. When unemployment spiked to 14.2% in May 2020, it was 2.9 percentage points higher than the peak level of unemployment from the Great Recession. This unprecedented spike in unemployment transpired in only three months, while it took two-and-a-half years for the unemployment rate to peak in the Great Recession. The April 2026 unemployment rate is up 1.1 percentage points from a year ago and is 0.5 percentage points higher than the U.S. unemployment rate.
The Bureau of Labor Statistics (BLS) produces alternative measures of labor market weakness, including the broadest measure of unemployment (U-6). U-6 accounts for discouraged workers, underemployed workers — working part-time but not by choice— and workers who are marginally attached to the labor force — those who have looked for work in the past 12 months, but are
not currently looking, yet indicate a willingness to work. None of these workers are accounted for in the Florida April headline unemployment rate of 4.8%.
Looking at U-6, we see a labor market in Florida that remains relatively strong. U-6 in Florida averaged 8.3% during April 2025 through March 2026 4. Meanwhile, the national rate of U-6 averaged 8.0% during the same period. U-6 unemployment in Florida during the second quarter of 2024 through the first quarter of 2025 was 3.8 percentage points below the U-6 rate in 2014; 7.7 percentage points lower than the 16% rate in 2012; and down 11.0 percentage points from its peak average rate of 19.3% in 2010 (the nation’s U-6 averaged 16.7% in 2010). As the economy slows, these numbers will continue drifting higher in Florida.
An analysis of how U-6 behaves relative to the headline unemployment rate (U-3) continues to provide additional insight into the health of the labor market. The gap between these two measures continues to narrow. The average spread between U-6 and U-3 during April 2025 through March 2026 was hovering at 3.8% at the national level. That gap was 4.2% for the same period in Florida.
4 This 11-month average excludes October when no data was collected because of the federal government shutdown..
1. Annual Summary of the University of Central Florida's Forecast for Florida
Nonfarm Employment (Payroll Survey % Change Year Ago) Employment and Labor Force (Household Survey % Change Year Ago)
Table
2. Quarterly Summary of the University of Central Florida's Forecast for Florida*
Personal Income and GSP
*Quarterly at an annual rate
Employment and Labor Force (Household Survey % Change Year Ago)
Nonfarm Employment (Payroll Survey % Change Year Ago)
Population and Migration
Housing
Table
Table 3. Employment Quarterly*
*Quarterly at an annual rate Florida Payroll Employment (Thousands)
Table 4. Employment Annual
Florida Payroll Employment (Thousands)
*Quarterly at an annual rate
Billions Current Dollars
Billions 2012 $
PROFILES
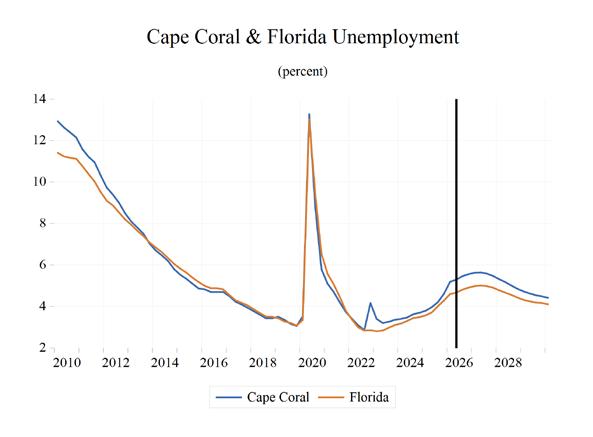
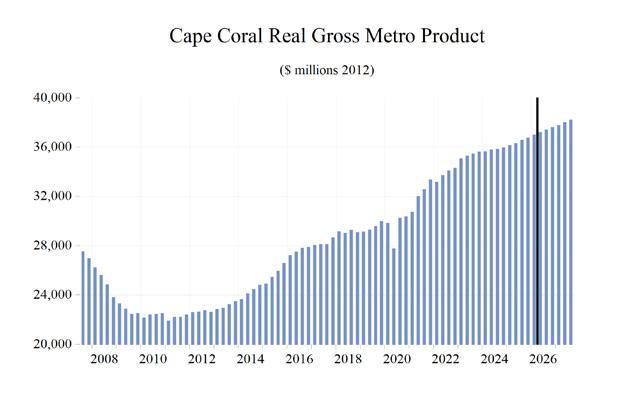
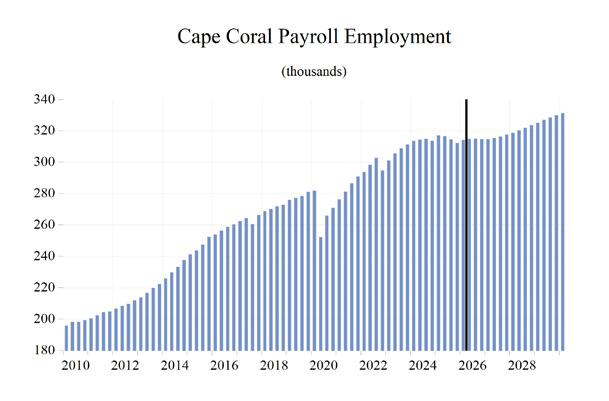
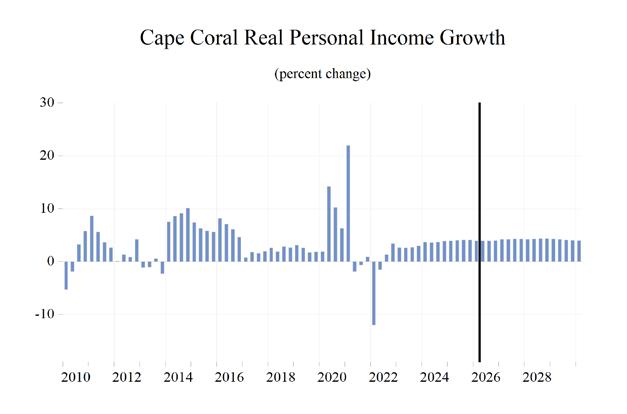
The Cape Coral MSA consists of Lee County, located on Florida’s southwest coast. This area is known for its extensive network of waterways, with more than 400 miles of canals. Cape Coral has the most extensive canal system of any city in the world and is the largest master-planned community in the U.S.
QUICK FACTS
• Metro population estimate of 860,959 as of 2023 (ACS 5-Year Estimate) (U.S. Census Bureau).
• Lee County population estimate of 792,692 as of 2025 (ACS 5-Year Estimate).
• Civilian labor force of 380,300 in August 2025 (FRED, U.S. Bureau of Labor Statistics).
• An unemployment rate of 4.8% as of August 2025, not seasonally adjusted. This amounts to 18,243 unemployed people (FRED, U.S. Bureau of Labor Statistics).
Cape Coral-Ft. Myers MSA
Long Term Outlook for Cape Coral-Fort Myers, FL
June 2026 Forecast
Personal Income (Billions $)
Establishment Employment (Place of Work, Thousands, SA)
Other Economic Indicators
CAPE
Short Term Outlook for Cape Coral-Fort Myers, FL
June 2026 Forecast
(Billions $)
Establishment Employment (Place of Work, Thousands, SA)
Other Economic Indicators
PROFILES
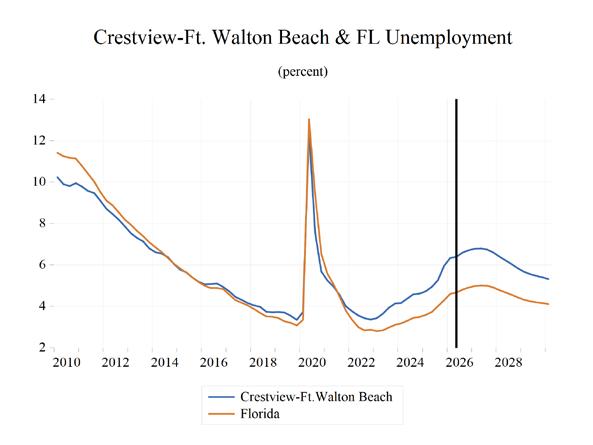
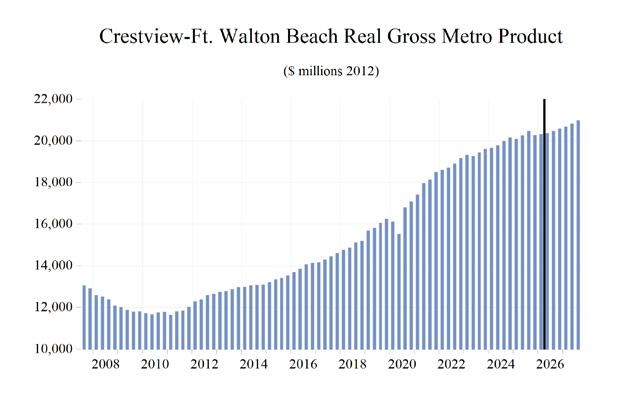
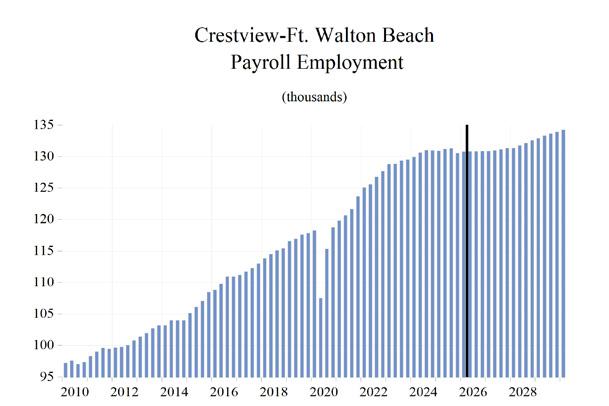
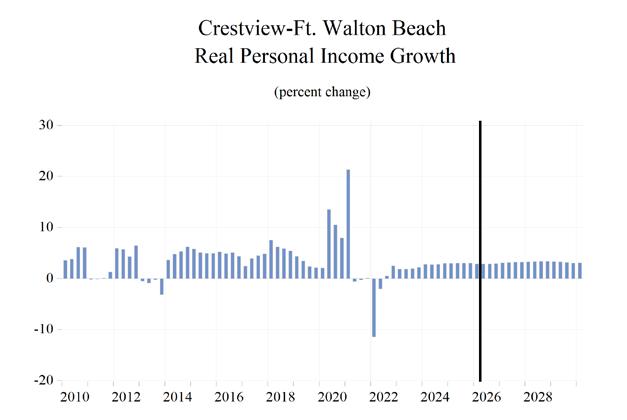
The Crestview MSA is comprised of Okaloosa and Walton counties and is located in the northwest corner of the state. Crestview is known as the “Hub City” because of the convergence of Interstate 1, State Road 85, U.S. Highway 90, the Florida Gulf & Atlantic railroad, the Yellow River, and the Shoal River in or near the city.
QUICK FACTS
• Metro population estimate of 310,149 as of 2023 (ACS 5-Year Estimate) (U.S. Census Bureau).
• Okaloosa County population estimate of 214,281 as of 2023 (ACS 5-Year Estimate).
• Walton County population estimate of 79,846 as of 2023 (ACS 5-Year Estimate).
• Civilian labor force of 141,100 in August 2025 (FRED, U.S. Bureau of Labor Statistics).
• An unemployment rate of 4.2% as of August 2025, not seasonally adjusted. This amounts to 6,074 unemployed people (FRED, U.S. Bureau of Labor Statistics).
Crestview-Ft. Walton Beach-Destin MSA
Long Term Outlook for Crestview-Fort Walton Beach-Destin, FL
June 2026 Forecast
Personal Income (Billions $)
Establishment Employment (Place of Work, Thousands, SA)
Short Term Outlook for Crestview-Fort Walton Beach-Destin, FL
June 2026 Forecast
Establishment Employment (Place of Work, Thousands, SA)
Other Economic Indicators
PROFILES
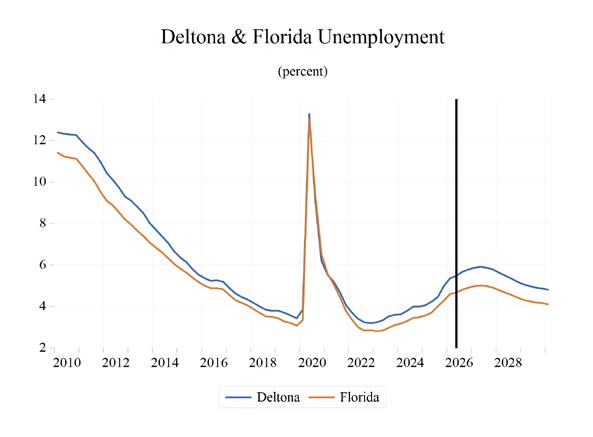
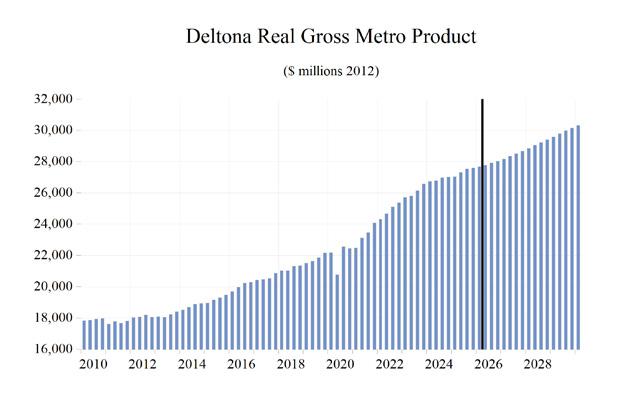
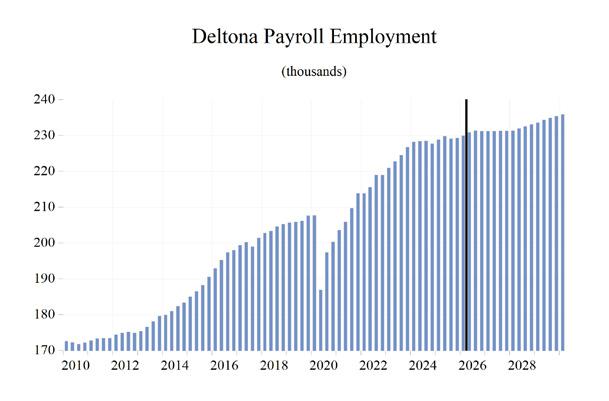
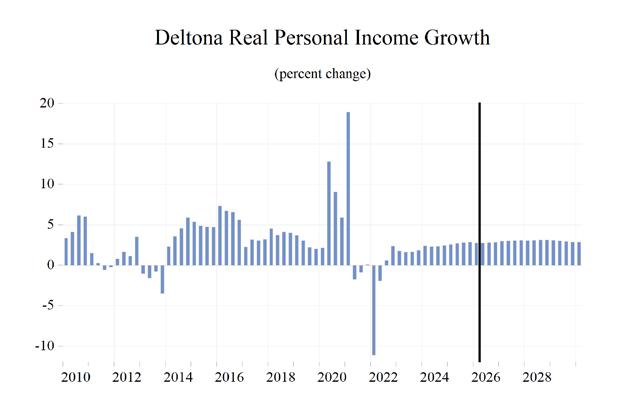
The Deltona–Daytona–Ormond Beach MSA is comprised of Volusia and Flagler counties. It is located on the east coast of Florida and is notable for special events that occur throughout the year, such as Bike Week. It is also home to the NASCAR headquarters and the Daytona International Speedway, which hosts popular races such as the Daytona 500.
QUICK FACTS
• Metro population estimate of 739,516 as of 2023 (ACS 5-Year Estimate) (U.S. Census Bureau).
• Volusia County population estimate of 568,229 as of 2023 (ACS 5-Year Estimate).
• Civilian labor force of 323,700 in August 2025 (FRED, U.S. Bureau of Labor Statistics).
• An unemployment rate of 5.1% as of August 2025, not seasonally adjusted. This amounts to 16,604 unemployed people (FRED, U.S. Bureau of Labor Statistics).
- Ormond Beach MSA
Deltona - Daytona Beach
Long Term Outlook for Deltona-Daytona Beach-Ormond Beach, FL
June 2026 Forecast
Personal Income (Billions $)
Other Economic Indicators
Short Term Outlook for Deltona-Daytona Beach-Ormond Beach, FL
June 2026 Forecast
Other Economic Indicators
PROFILES
The Broward County MSA is located in Southeastern Florida. It is estimated to be the second-most populous county in the State of Florida and the 17th most populous county in the United States.
QUICK FACTS
• Metro population estimate of 1,940,907 as of 2023 (ACS 5-Year Estimate) (U.S. Census Bureau).
• Broward County population estimate of 1,946,127 as of 2023 (ACS 5-Year Estimate).
• Civilian labor force of 1,095,600 in August 2025 (FRED, U.S. Bureau of Labor Statistics).
• An unemployment rate of 4.1% as of August 2025, not seasonally adjusted. This amounts to 44,982 unemployed people (FRED, U.S. Bureau of Labor Statistics).
Broward County MSA
Long Term Outlook for Fort Lauderdale-Pompano Beach-Deerfield Beach, FL (Division of Miami MSA)
June 2026 Forecast
Personal Income (Billions $)
Establishment Employment (Place of Work, Thousands, SA)
Other Economic Indicators
Short Term Outlook for Fort Lauderdale-Pompano Beach-Deerfield Beach, FL (Division of Miami MSA)
June 2026 Forecast
Establishment Employment (Place of Work, Thousands, SA)
Other Economic Indicators
PROFILES
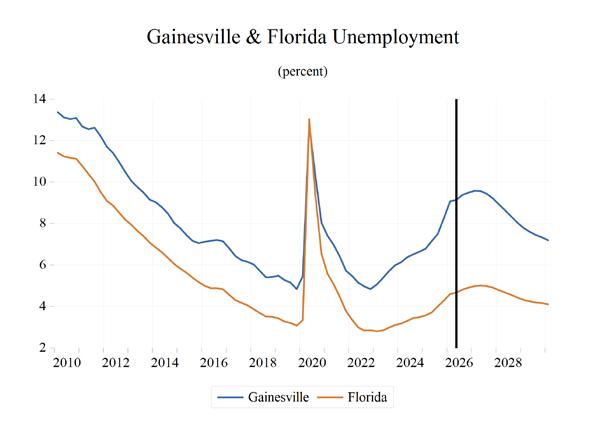
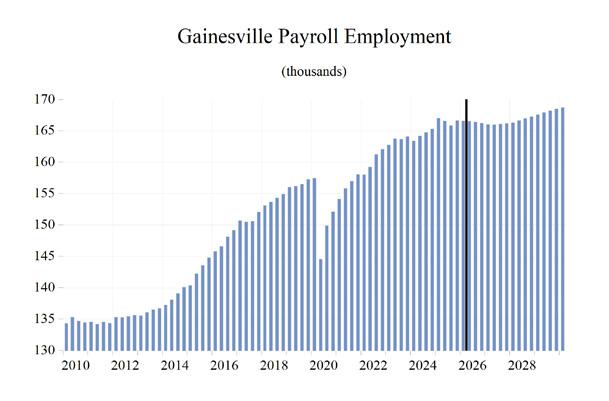
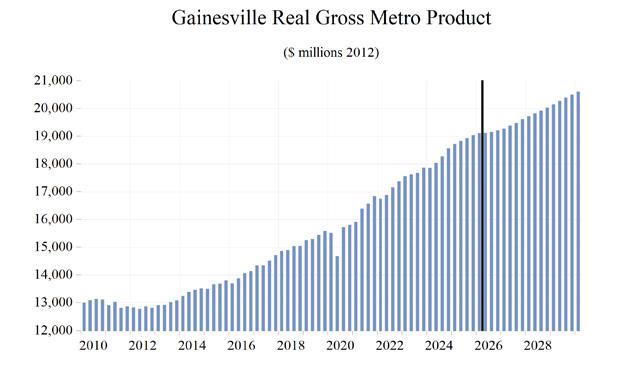
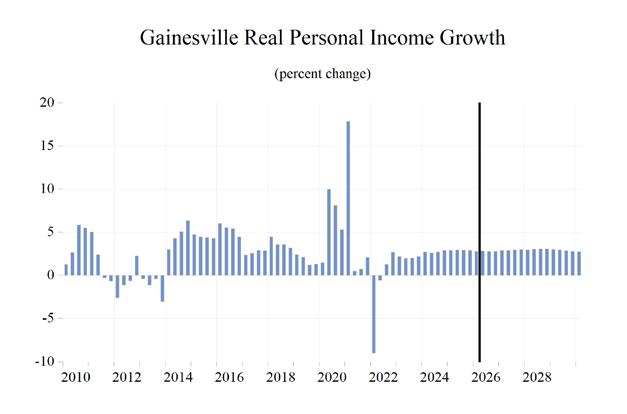
The Gainesville MSA is comprised of Alachua and Gilchrist counties, and is located in the central north portion of the state. This metro is home to the University of Florida and the Florida Museum of Natural History, the state’s official natural history museum.
QUICK FACTS
• Metro population estimate of 360.81 as of 2023 (ACS 5-Year Estimate) (U.S. Census Bureau).
• Alachua County population estimate of 281,751 as of 2023 (ACS 5-Year Estimate).
• Gilchrist County population estimate of 18,494 as of 2023 (ACS 5-Year Estimate).
• Civilian labor force of 154,700 in August 2025 (FRED, U.S. Bureau of Labor Statistics).
• An unemployment rate of 5.1% as of August 2025, not seasonally adjusted. This amounts to 8,665 unemployed people (FRED, U.S. Bureau of Labor Statistics).
Total Nonagricultural Employment
Total Private Goods Producing Service Producing
Private Service Providing
Mining, Logging, and Construction Manufacturing
Gainesville MSA
Professional and Business Services
Educational and Health Services
Leisure and Hospitality Other Services Government
Long Term Outlook for Gainesville, FL
June 2026 Forecast
Personal Income (Billions $)
Other Economic Indicators
Short Term Outlook for Gainesville, FL
June 2026 Forecast
Personal Income (Billions $)
Establishment Employment (Place of Work, Thousands, SA)
Other Economic
Indicators
PROFILES
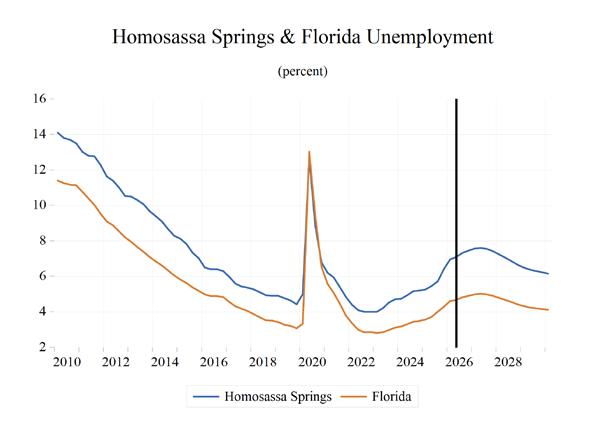
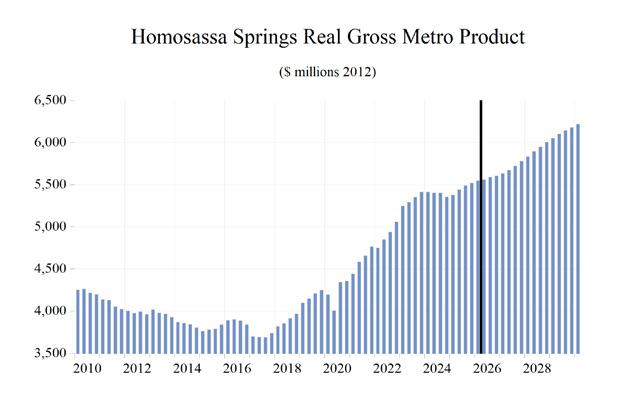
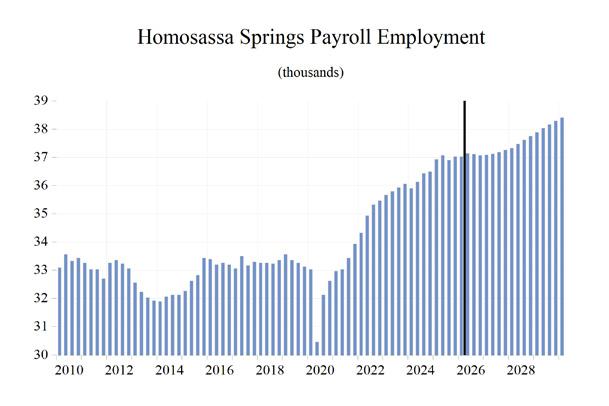
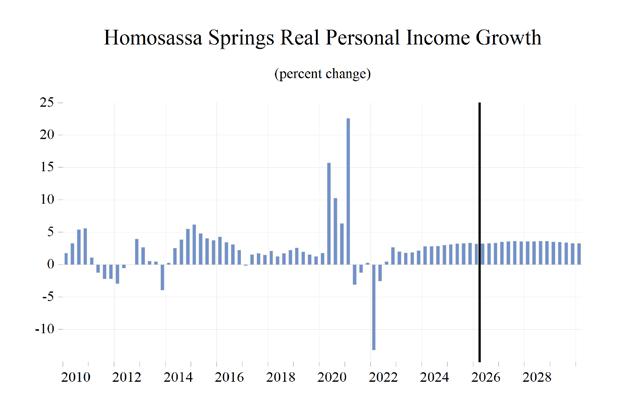
The Homosassa Springs MSA is located in the central northwest portion of the state. Homosassa Springs is a Census-designated place in Citrus County and is known for and named after the warm spring located in Homosassa Springs Wildlife State Park, which attracts manatees to the area.
QUICK FACTS
• Metro population estimate of 170,174 as of 2023 (ACS 5-Year Estimate) (U.S. Census Bureau).
• Citrus County population estimate of 158,693 as of 2023 (ACS 5-Year Estimate).
• Civilian labor force of 49,900 in August 2025 (FRED, U.S. Bureau of Labor Statistics).
• An unemployment rate of 6.6% as of August 2025, not seasonally adjusted. This amounts to 3,571 unemployed people (FRED, U.S. Bureau of Labor Statistics).
Homosassa Springs MSA Industry Location Quotients
Long Term Outlook for Homosassa Springs, FL
June 2026 Forecast
Personal Income (Billions $)
Employment (Place of Work, Thousands, SA)
Other Economic Indicators
Short Term Outlook for Homosassa Springs, FL
June 2026 Forecast
Personal Income (Billions $)
Other Economic Indicators
PROFILES
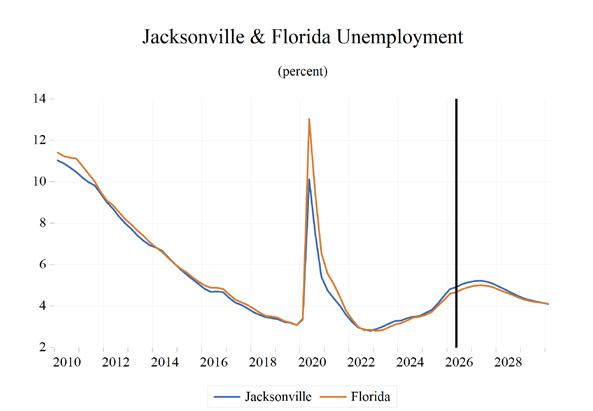
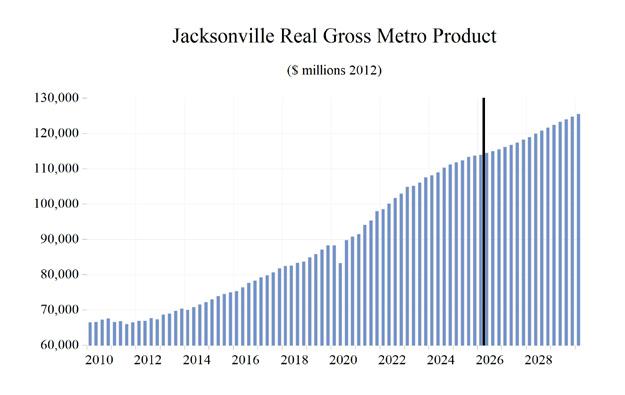
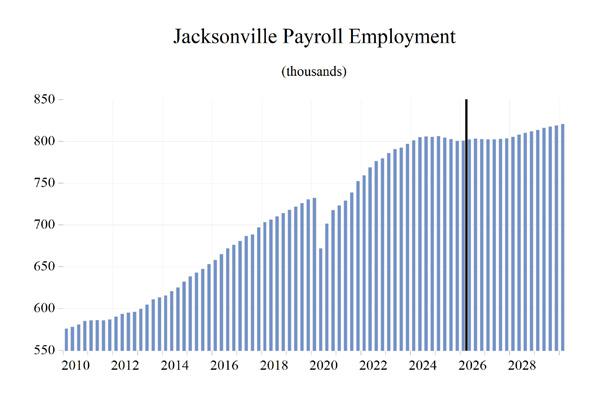
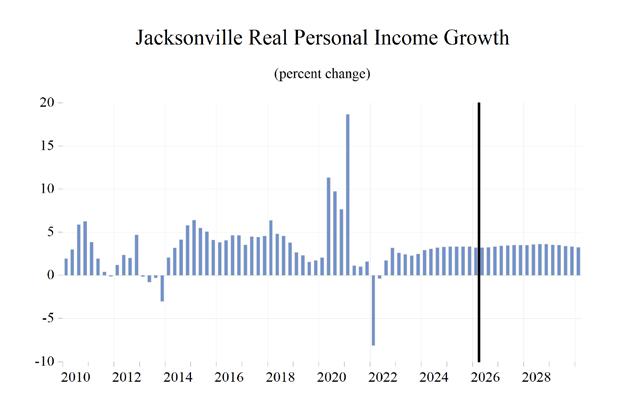
The Jacksonville MSA is comprised of Baker, Clay, Duval, Nassau, and St. Johns counties. It is located on the northeast coast of Florida and is home to several major U.S. military bases, such as the Jacksonville Naval Air Station, as well as the University of North Florida and the Jacksonville International Airport.
QUICK FACTS
• Metro population estimate of 1,760,548 as of 2023 (ACS 5-Year Estimate) (U.S. Census Bureau).
• Baker County population estimate of 28,186 as of 2023 (ACS 5-Year Estimate).
• Clay County population estimate of 223,436 as of 2023 (ACS 5-Year Estimate).
• Duval County population estimate of 1,007,189 as of 2023 (ACS 5-Year Estimate).
• Nassau County population estimate of 94,653 as of 2023 (ACS 5-Year Estimate).
• St. Johns County population estimate of 292,243 as of 2023 (ACS 5-Year Estimate).
• Civilian labor force of 846,700 in August 2025 (FRED, U.S. Bureau of Labor Statistics).
• An unemployment rate of 4.6% as of August 2025, not seasonally adjusted. This amounts to 39,389 unemployed people (FRED, U.S. Bureau of Labor Statistics).
Long Term Outlook for Jacksonville, FL
June 2026 Forecast
Personal Income (Billions $)
Establishment Employment (Place of Work, Thousands, SA)
Other Economic Indicators
Short Term Outlook for Jacksonville, FL
June 2026 Forecast
Personal Income (Billions $)
Establishment Employment (Place of Work, Thousands, SA)
Other Economic Indicators
PROFILES
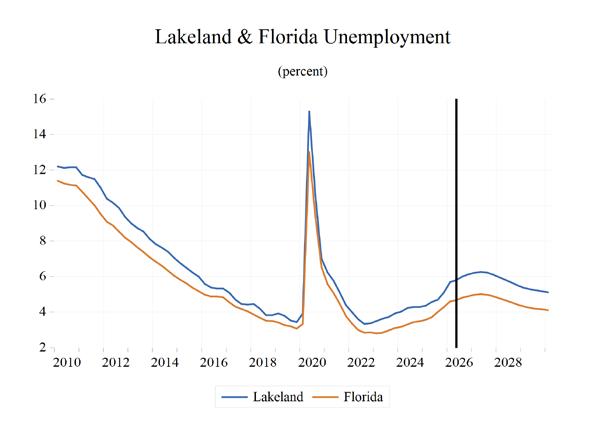
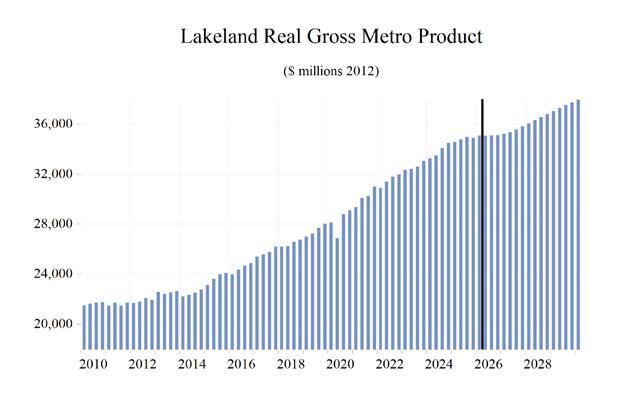
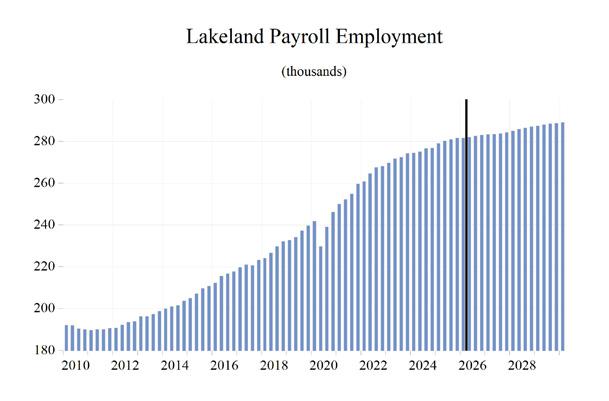
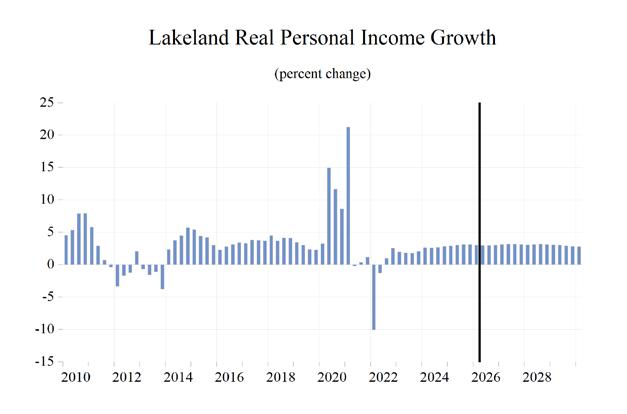
The Lakeland–Winter Haven MSA is comprised only of Polk County. It is located in the westerncenter of the state and is heavily agriculturally based, especially in citrus. The MSA is home to Legoland Florida and is also the location of Publix Supermarket headquarters. Each year, the Detroit Tigers host spring training at Joker Marchant Stadium. Lakeland is also home to Florida Polytechnic University, one of the newer members of the State University System.
QUICK FACTS
• Metro population estimate of 852,878 as of 2023 (ACS 5-Year Estimate) (U.S. Census Bureau).
• Polk County population estimate of 760,961 as of 2023 (ACS 5-Year Estimate).
• Civilian labor force of 347,500 in August 2025 (FRED, U.S. Bureau of Labor Statistics).
• An unemployment rate of 4.6% as of August 2025, not seasonally adjusted. This amounts to 19,671 unemployed people (FRED, U.S. Bureau of Labor Statistics).
Lakeland - Winter Haven MSA
Long Term Outlook for Lakeland-Winter Haven, FL
June 2026 Forecast
Personal Income (Billions $)
Establishment Employment (Place of Work, Thousands, SA)
Other Economic Indicators
Short Term Outlook for Lakeland-Winter Haven, FL
June 2026 Forecast
(Billions $)
Establishment Employment (Place of Work, Thousands, SA)
Other Economic Indicators
PROFILES
The Miami-Fort-Lauderdale-West Palm Beach MSA is comprised of Miami-Dade County, Broward County, and Palm Beach County. Home to the largest populous county in the state of Florida and seventh in the United States, it is located on the southeast coast of Florida. Miami hosts many sports teams including the Miami Dolphins, the Miami Heat, the Miami Marlins, and the Florida Panthers, as well as many institutions of higher education, including the University of Miami and Florida International University.
QUICK FACTS
• Metro population estimate of 6,457,988 as of 2023 (ACS 5-Year Estimate) (U.S. Census Bureau).
• Miami-Dade County population estimate of 2,685,296 as of 2023 (ACS 5-Year Estimate).
• Broward County population estimate of 1,940,907 as of 2023 (ACS 5-Year Estimate).
• Palm Beach County population estimate of 1,494,805 as of 2023 (ACS 5-Year Estimate).
• Civilian labor force of 3,262,200 in August 2025 (FRED, U.S. Bureau of Labor Statistics).
• An unemployment rate of 3.7% as of August 2025, not seasonally adjusted. This amounts to 121,845 unemployed people (FRED, U.S. Bureau of Labor Statistics).
Miami-Fort
Lauderdale-West Palm Beach MSA
Industry Location Quotients
Total Nonagricultural Employment
Total Private Goods Producing Service Producing Private Service Providing
Transporta
Educational and Health Services
Leisure
Long Term Outlook for Miami-Fort Lauderdale-Pompano Beach, FL
June 2026 Forecast
Personal Income (Billions $)
Employment
(Place of Work, Thousands, SA)
Other Economic Indicators
Short Term Outlook for Miami-Fort Lauderdale-Pompano Beach, FL
June 2026 Forecast
Personal Income (Billions $)
Establishment Employment (Place of Work, Thousands, SA)
Other Economic Indicators
PROFILES
The Miami–Miami Beach–Kendall MSA is located in the southeastern section of the state of Florida. Miami-Dade is estimated to be the most populous county in Florida and the seventh-most populous county in the United States.
QUICK FACTS
• Metro population estimate of 2,688,237 as of 2023 (ACS 5-Year Estimate) (U.S. Census Bureau).
• Maimi-Dade County population estimate of 2,688,237 as of 2023 (ACS 5-Year Estimate).
• Civilian labor force of 1,384,500 in August 2025 (FRED, U.S. Bureau of Labor Statistics).
• An unemployment rate of 2.9% as of August 2025, not seasonally adjusted. This amounts to 42,078 unemployed people (FRED, U.S. Bureau of Labor Statistics).
Miami-Miami Beach-Kendall Division MSA
Long Term Outlook for Miami-Miami Beach-Kendall, FL (Division of Miami-Fort Lauderdale MSA)
June 2026 Forecast
Personal Income (Billions $)
Establishment Employment (Place of Work, Thousands, SA)
Other Economic Indicators
Short Term Outlook for Miami-Miami Beach-Kendall, FL (Division of Miami-Fort Lauderdale MSA)
June 2026 Forecast
(Billions $)
Establishment Employment (Place of Work, Thousands, SA)
Other Economic Indicators
PROFILES
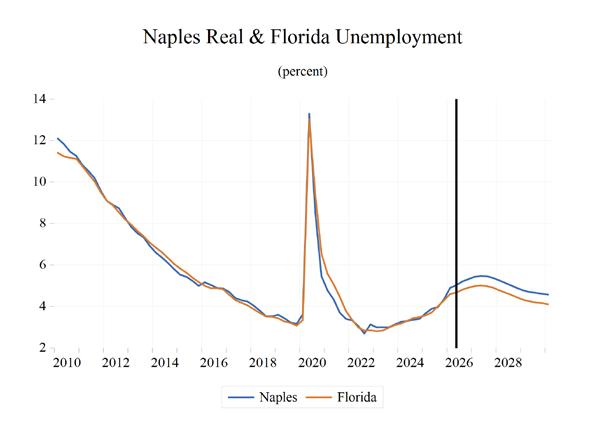
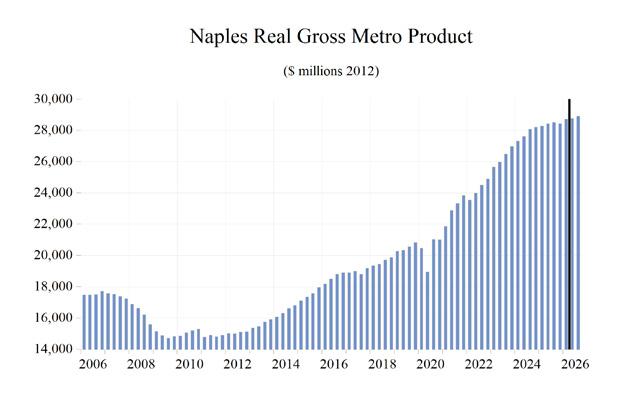
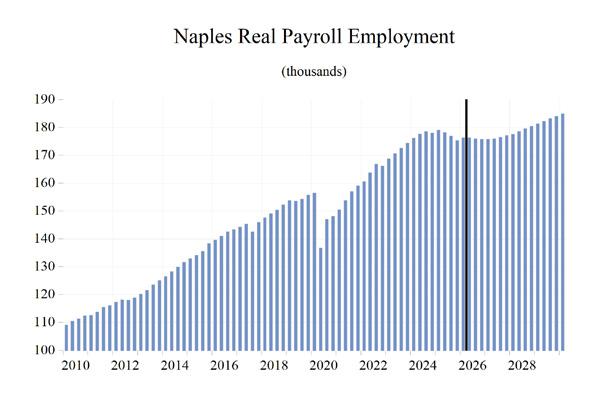
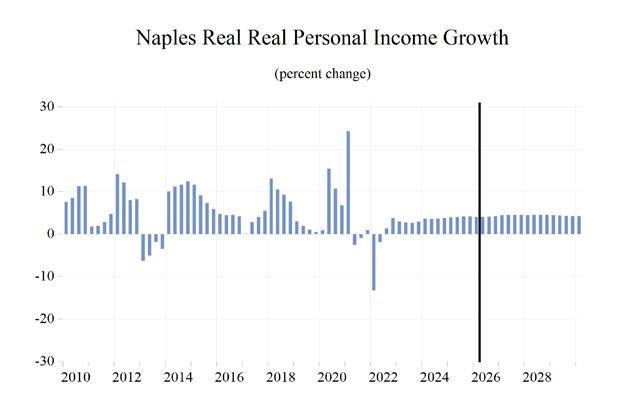
The Naples–Immokalee–Marco Island MSA is comprised of Collier County only. Located on the southwest coast of Florida, it is notable for numerous recreation and leisure activities, and is a popular retirement destination. This region is sometimes referred to as the “Crown Jewel of Southwest Florida.”
QUICK FACTS
• Metro population estimate of 416,233 as of 2023 (ACS 5-Year Estimate) (U.S. Census Bureau).
• Collier County population estimate of 387,681 as of 2023 (ACS 5-Year Estimate).
• Civilian labor force of 195,700 in August 2025 (FRED, U.S. Bureau of Labor Statistics).
• An unemployment rate of 4.8% as of August 2025, not seasonally adjusted. This amounts to 8,874 unemployed people (FRED, U.S. Bureau of Labor Statistics).
Naples - Immokalee - Marco Island MSA
Long Term Outlook for Naples-Immokalee-Marco Island, FL
June 2026 Forecast
Personal Income (Billions $)
Establishment Employment (Place of Work, Thousands, SA)
Other Economic Indicators
Short Term Outlook for Naples-Immokalee-Marco Island, FL
June 2026 Forecast
Other Economic Indicators
PROFILES
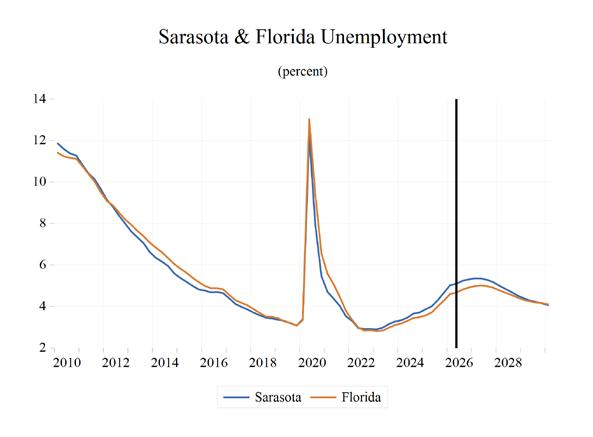
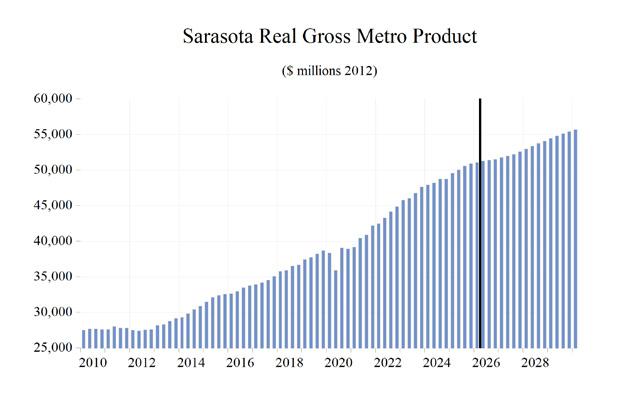
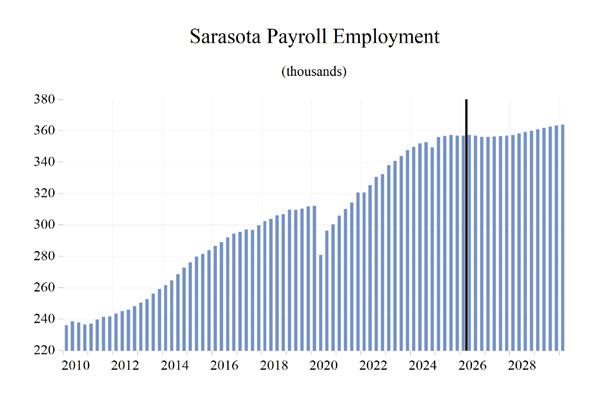
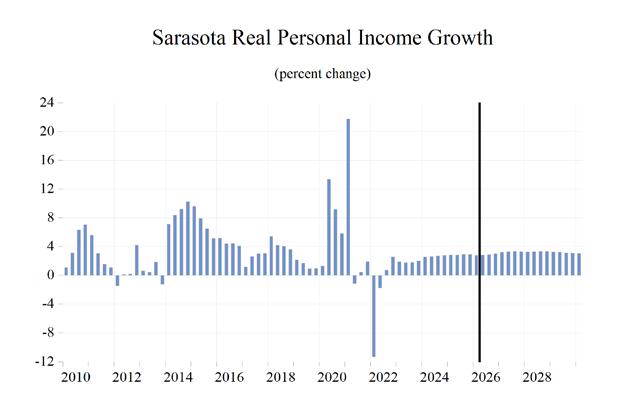
The North Port–Sarasota–Bradenton is located in Sarasota County in the southwest segment of the state. North Port encompasses 14 miles of interstate I-75 within its boundaries and it has two international airports within 45 minutes.
QUICK FACTS
• Metro population estimate of 934,956 as of 2023 (ACS 5-Year Estimate) (U.S. Census Bureau).
• Sarasota County population estimate of 449,011 as of 2023 (ACS 5-Year Estimate).
• Manatee County population estimate of 405,069 as of 2023 (ACS 5-Year Estimate).
• Civilian labor force of 399,700 in August 2025 (FRED, U.S. Bureau of Labor Statistics).
• An unemployment rate of 4.8% as of August 2025, not seasonally adjusted. This amounts to 13,100 unemployed people (FRED, U.S. Bureau of Labor Statistics).
Total Nonagricultural Employment
Total Private Goods Producing Service Producing
Private Service Providing
Mining, Logging, and Construction
Trade, Transportation, and Utilities Wholesale Trade Retail Trade
North Port-Sarasota-Bradenton MSA
Educational and Health Services
Leisure and Hospitality Other Services
Long Term Outlook for North Port-Sarasota-Bradenton, FL
June 2026 Forecast
Personal Income (Billions $)
Employment (Place of Work, Thousands, SA)
Other Economic Indicators
Short Term Outlook for North Port-Sarasota-Bradenton, FL
June 2026 Forecast
Personal Income (Billions $)
Other Economic Indicators
PROFILES
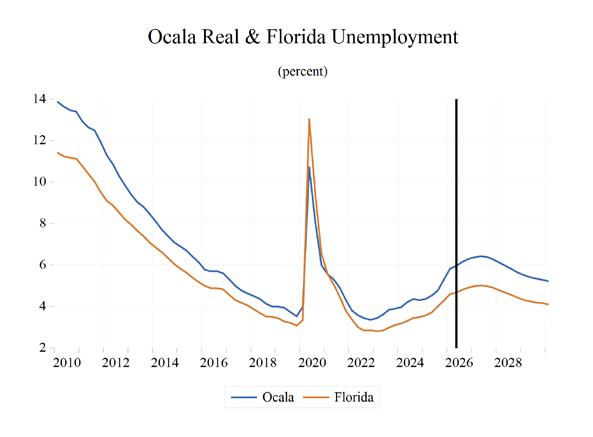
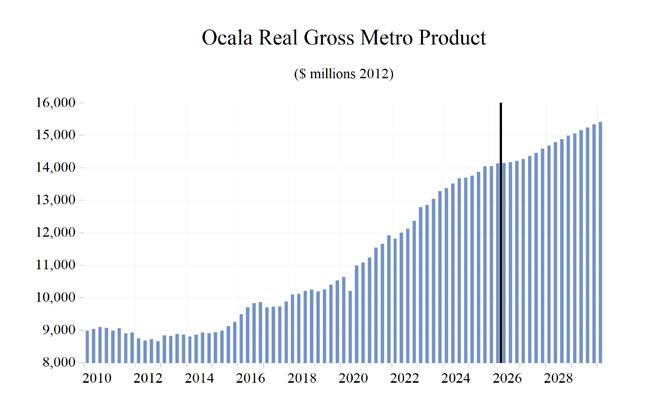
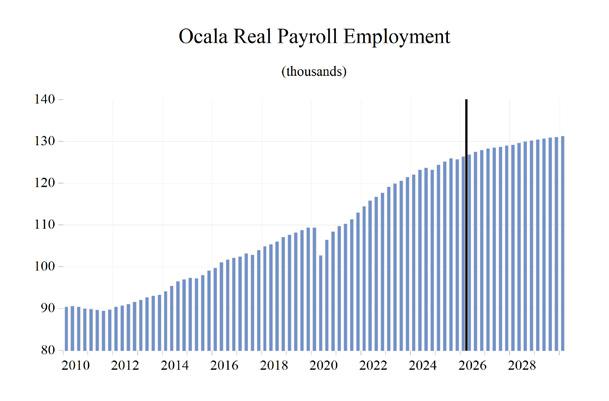
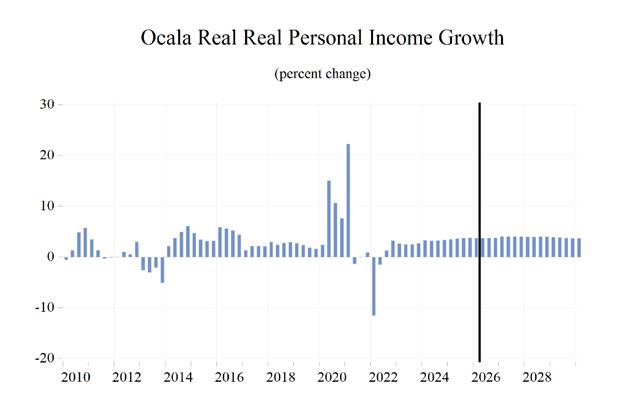
Comprised of Marion County only, the Ocala MSA is located northwest of the Orlando area and is in the center of the state. The second-largest national forest in Florida, the Ocala National Forest, and Silver Springs are two main outdoor attractions in the area.
QUICK FACTS
• Metro population estimate of 428,905 as of 2023 (ACS 5-Year Estimate) (U.S. Census Bureau).
• Marion County population estimate of 387,697 as of 2023 (ACS 5-Year Estimate).
• Civilian labor force of 151,600 in August 2025 (FRED, U.S. Bureau of Labor Statistics).
• An unemployment rate of 5.5% as of August 2025, not seasonally adjusted. This amounts to 8,854 unemployed people (FRED, U.S. Bureau of Labor Statistics).
Total Nonagricultural Employment
Total Private Goods Producing Service Producing
Private Service Providing
Mining, Logging, and Construction
Manufacturing
Trade, Transportation, and Utilities
Wholesale Trade
Retail Trade
Transportation, Warehousing and Utilities
Information
Financial Activities
Professional and Business Services
Educational and Health Services
Leisure and Hospitality
Other Services
Government
Ocala MSA
Industry Location Quotients
Long Term Outlook for Ocala, FL
June 2026 Forecast
Personal Income (Billions $)
Other Economic Indicators
Short Term Outlook for Ocala, FL
June 2026 Forecast
Personal Income (Billions $)
Other Economic
Indicators
PROFILES
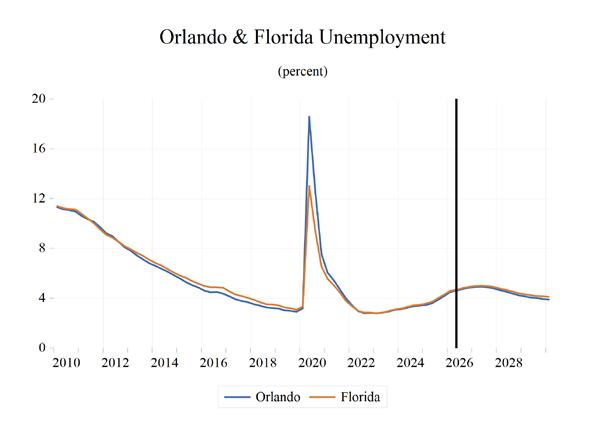
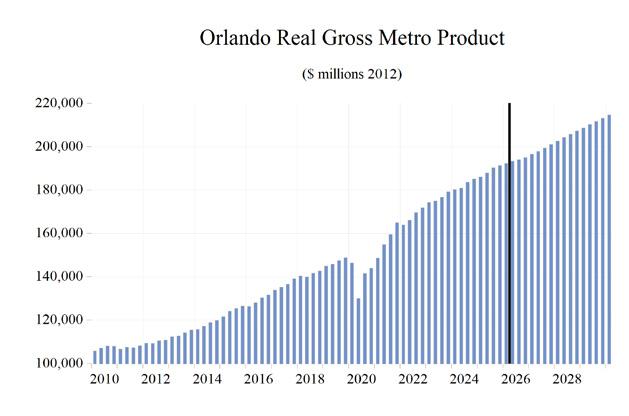
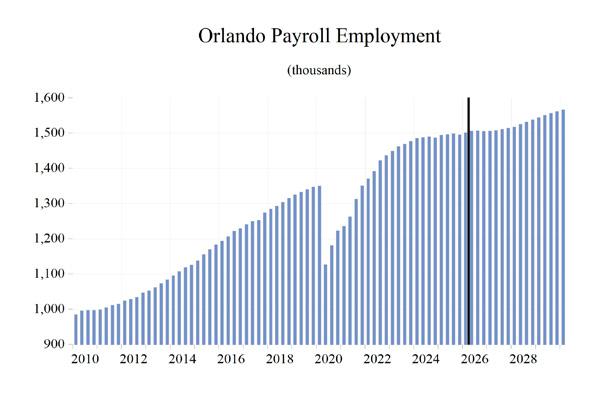
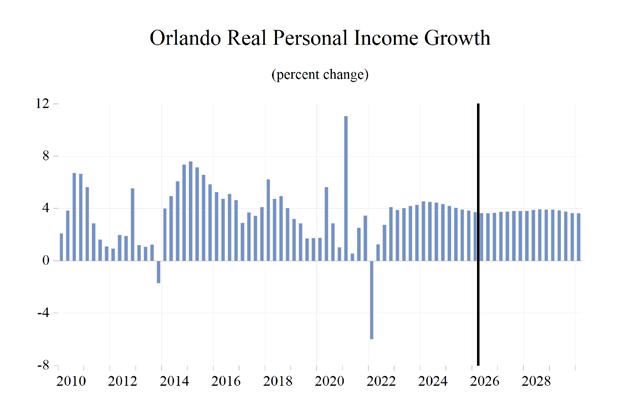
The Orlando–Kissimmee–Sanford MSA is comprised of Lake, Orange, Osceola, and Seminole counties. Located in the southern center of the state, this area is home to numerous tourist attractions such as Walt Disney World, Universal Studios, and Sea World, and most notable as of 2025 is Universal Studios, Orlando’s Epic Universe. It is also home to the Orlando Magic and the Orlando City Soccer Club. Orlando hosts many conventions utilizing some of the biggest hotels in the country and America’s second-largest convention center. The University of Central Florida, one of the nation’s largest public universities, and many other places of higher education also reside in the MSA.
QUICK FACTS
• Metro population estimate of 2,940,513 as of 2023 (ACS 5-Year Estimate) (U.S. Census Bureau).
• Lake County population estimate of 398,696 as of 2023 (ACS 5-Year Estimate).
• Orange County population estimate of 1,440,471 as of 2023 (ACS 5-Year Estimate).
• Osceola County population estimate of 406,943 as of 2023 (ACS 5-Year Estimate).
• Seminole County population estimate of 474,912 as of 2023 (ACS 5-Year Estimate).
• Civilian labor force of 1,476,500 in August 2025 (FRED, U.S. Bureau of Labor Statistics).
• An unemployment rate of 4.3% as of August 2025, not seasonally adjusted. This amounts to 65.984 unemployed people (FRED, U.S. Bureau of Labor Statistics).
Total Nonagricultural Employment
Total Private Goods Producing Service Producing
Private Service Providing
Mining, Logging, and Construction Manufacturing
Trade, Transportation, and Utilities
Wholesale Trade
Retail Trade
Transportation, Warehousing and Utilities Information Financial Activities
Professional and Business Services
Educational and Health Services
Leisure and Hospitality
Other Services Government
Orlando - Kissimmee - Sanford MSA
Location Quotients
Long Term Outlook for Orlando-Kissimmee-Sanford, FL
June 2026 Forecast
Personal Income (Billions $)
Establishment Employment (Place of Work, Thousands, SA)
Other Economic Indicators
Short Term Outlook for Orlando-Kissimmee-Sanford, FL
June 2026 Forecast
(Billions $)
Establishment Employment (Place of Work, Thousands, SA)
Other Economic Indicators
PROFILES
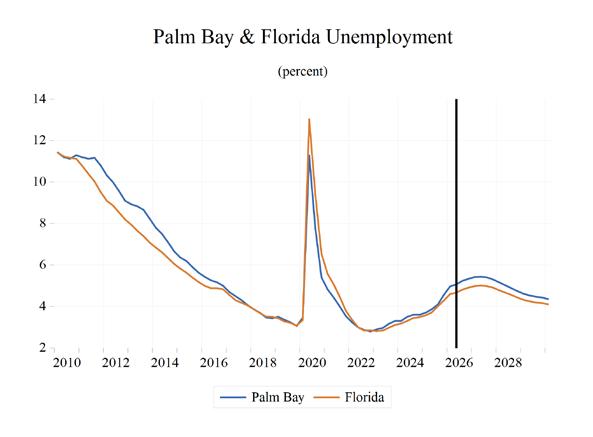
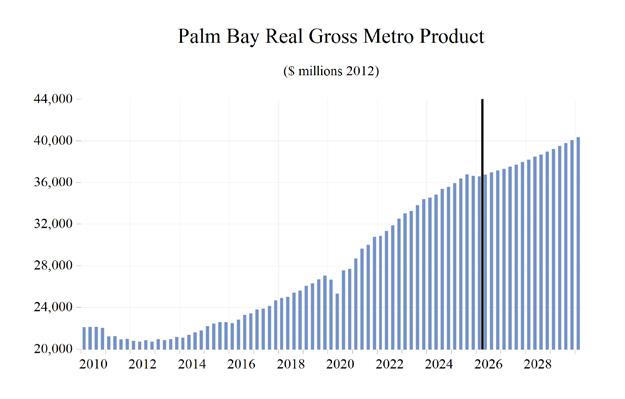
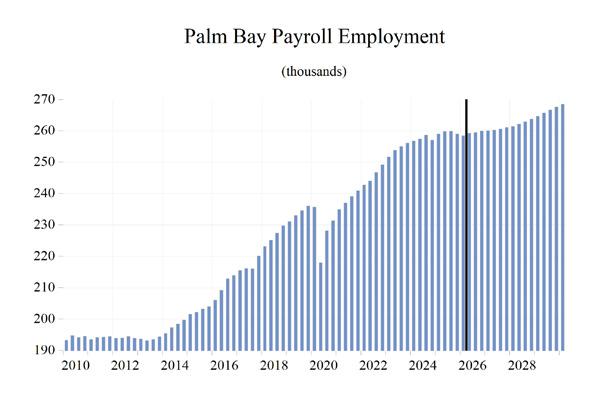
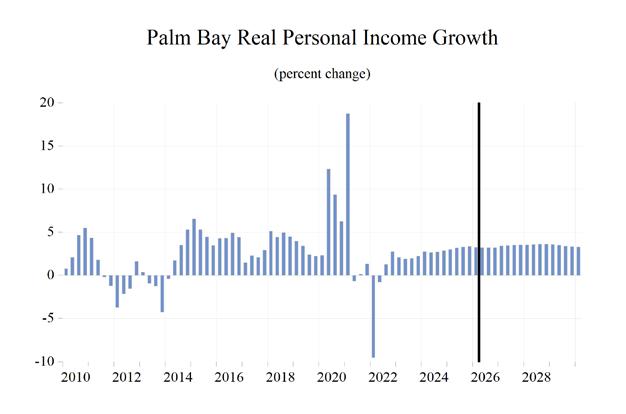
The Palm Bay–Melbourne–Titusville MSA is comprised of Brevard County only. Typically known as “Florida’s Space Coast,” this area is home to the Kennedy Space Center. Located in the central part of Florida’s east coast, the region is home to Cape Canveral Space Force Station, Patrick Air Force Base, and government contractors such as L3Harris. Like much of Florida, this area is growing fast; Port Canaveral is now a leading cruise ship port.
QUICK FACTS
• Metro population estimate of 658,447 as of 2023 (ACS 5-Year Estimate) (U.S. Census Bureau).
• Brevard County population estimate of 620,533 as of 2023 (5-Year Estimate) (U.S. Census Bureau).
• Civilian labor force of 304,300 in August 2025 (FRED, U.S. Bureau of Labor Statistics).
• An unemployment rate of 4.7% as of August 2025, not seasonally adjusted. This amounts to 14,421 unemployed people (FRED, U.S. Bureau of Labor Statistics).
Palm Bay - Melbourne - Titusville MSA
Long Term Outlook for Palm Bay-Melbourne-Titusville, FL
June 2026 Forecast
Personal Income (Billions $)
Establishment Employment (Place of Work, Thousands, SA)
Other Economic Indicators
Short Term Outlook for Palm Bay-Melbourne-Titusville, FL
June 2026 Forecast
Personal Income (Billions $)
Other Economic Indicators
PROFILES
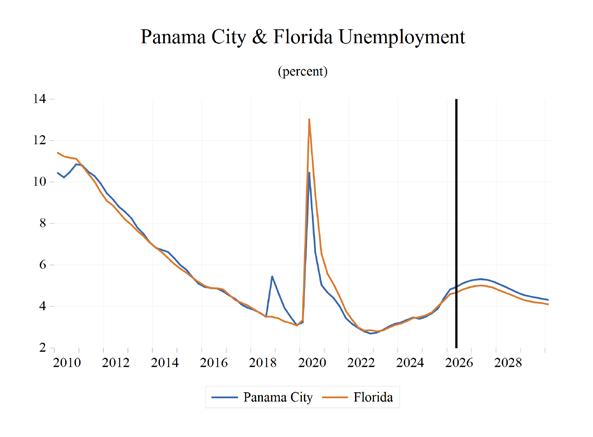
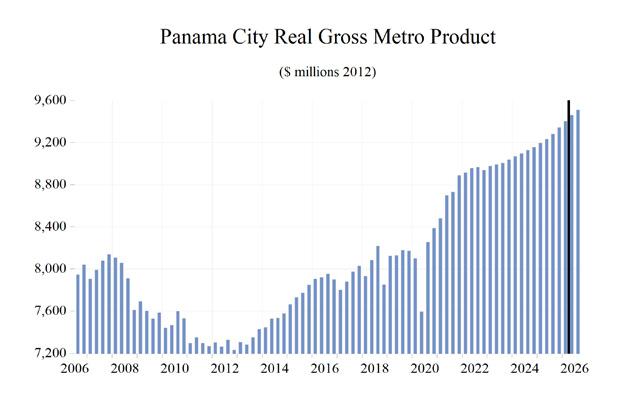
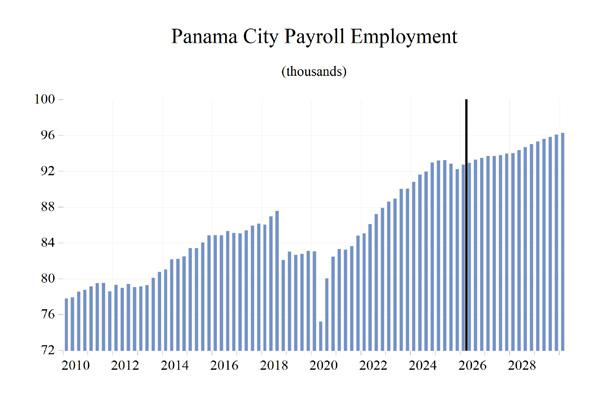
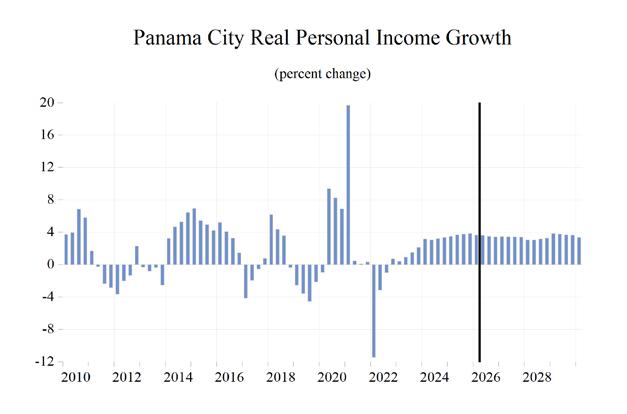
The Panama City MSA, known for its beaches and recreational fishing vessels, is located in the Northwest portion of the state. Panama City is the largest city between Tallahassee and Pensacola. This area is the more populated of two principal cities of the Panama City-Lynn Haven MSA and it is the county seat of Bay County.
QUICK FACTS
• Metro population estimate of 226,221 as of 2023 (ACS 5-Year Estimate) (U.S. Census Bureau).
• Bay County population estimate of 181,368 as of 2023 (ACS 5-Year Estimate).
• Civilian labor force of 94,900 in August 2025 (FRED, U.S. Bureau of Labor Statistics).
• An unemployment rate of 4.5% as of August 2025, not seasonally adjusted. This amounts to 4,571 unemployed people (FRED, U.S. Bureau of Labor Statistics).
Panama City MSA
Long Term Outlook for Panama City, FL
June 2026 Forecast
(Billions $)
Establishment Employment (Place of Work, Thousands, SA)
Other Economic Indicators
Short Term Outlook for Panama City, FL
June 2026 Forecast
Income (Billions $)
Establishment Employment (Place of Work, Thousands, SA)
Other Economic Indicators
PROFILES
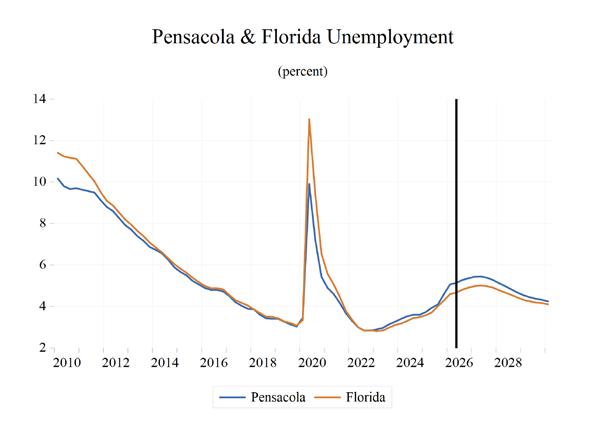
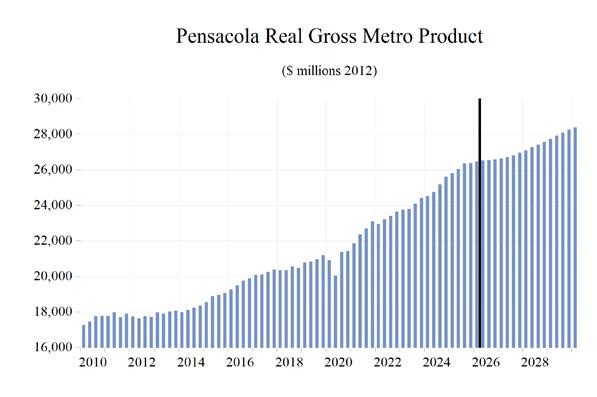
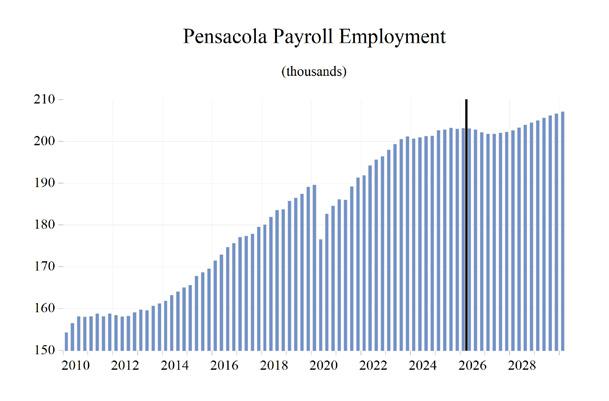
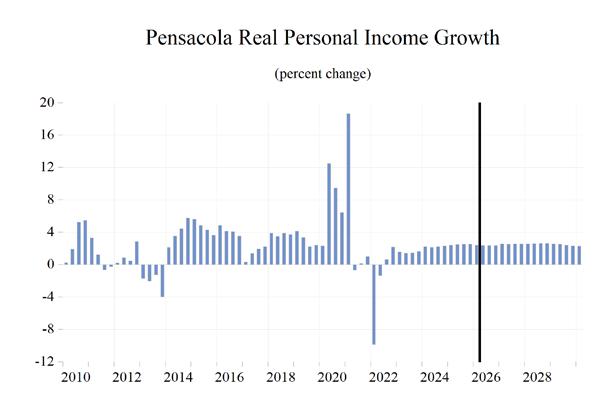
The Pensacola–Ferry Pass–Brent MSA is comprised of Escambia County and Santa Rosa County. Located in the northwest corner of Florida bordering Alabama, the region is home to the Pensacola Naval Air Station, Blue Angels, and the National Museum of Naval Aviation. This area has been referred to as the “Cradle of Naval Aviation.”
QUICK FACTS
• Metro population estimate of 538,928 as of 2023 (ACS 5-Year Estimate) (U.S. Census Bureau).
• Escambia County population estimate of 323,275 as of 2023 (ACS 5-Year Estimate).
• Santa Rosa County population estimate of 188,994 as of 2023 (ACS 5-Year Estimate).
• Civilian labor force of 244,800 in August 2025 (FRED, U.S. Bureau of Labor Statistics).
• An unemployment rate of 4.7% as of August 2025, not seasonally adjusted. This amounts to 11,381 unemployed people (FRED, U.S. Bureau of Labor Statistics).
Pensacola - Ferry Pass - Brent MSA
Long Term Outlook for Pensacola-Ferry Pass-Brent, FL
June 2026 Forecast
Personal Income (Billions $)
Establishment Employment (Place of Work, Thousands, SA)
Other Economic Indicators
Short Term Outlook for Pensacola-Ferry Pass-Brent, FL
June 2026 Forecast
Other Economic Indicators
PROFILES
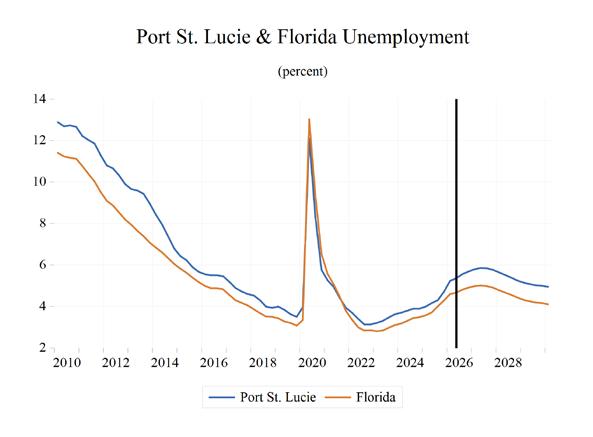
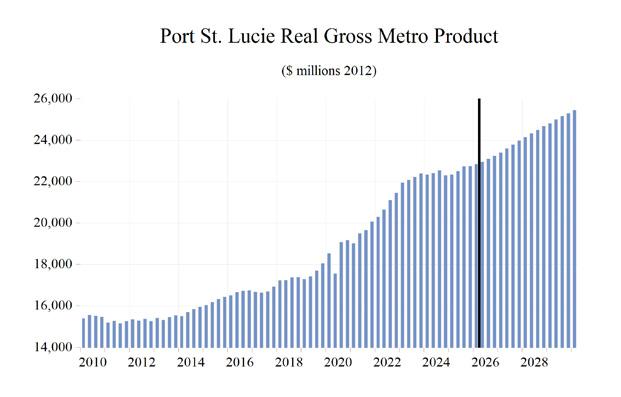
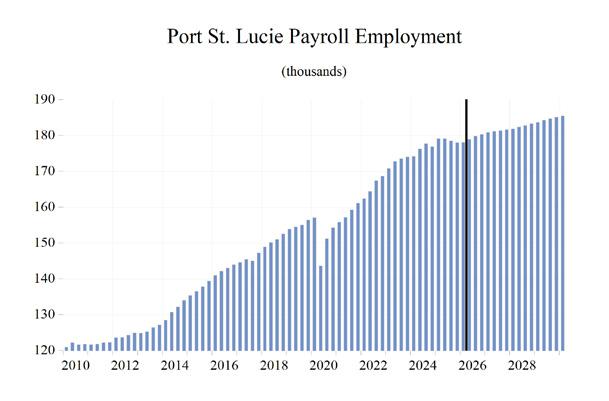
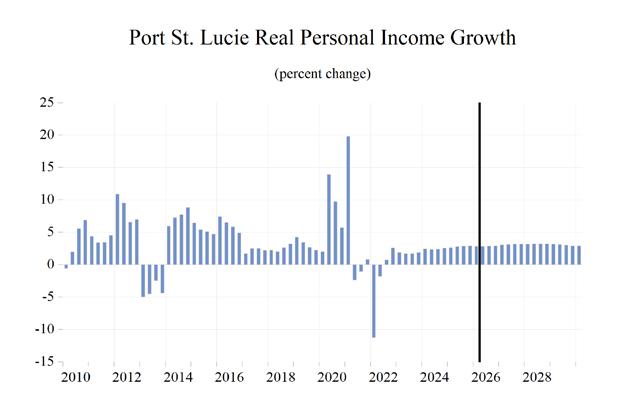
The Port St. Lucie MSA is a city on the Atlantic coast of southern Florida. Located in St. Lucie County, this municipality is the most populous in the county. Known for its botanical gardens and the waterways of the North Fork St. Lucie River Aquatic Preserve, the area is home to manatees, river otters, egrets and alligators.
QUICK FACTS
• Metro population estimate of 556,336 as of 2023 (ACS 5-Year Estimate) (U.S. Census Bureau).
• Martin County population estimate of 159,399 as of 2023 (ACS 5-Year Estimate).
• St. Lucie County population estimate of 334,682 as of 2023 (ACS 5-Year Estimate).
• Civilian labor force of 238,500 in August 2025 (FRED, U.S. Bureau of Labor Statistics).
• An unemployment rate of 5.0% as of August 2025, not seasonally adjusted. This amounts to 12,151 unemployed people (FRED, U.S. Bureau of Labor Statistics).
Port St. Lucie MSA
Long Term Outlook for Port St. Lucie, FL
June 2026 Forecast
Personal Income (Billions $)
Establishment Employment (Place of Work, Thousands, SA)
Other Economic Indicators
PORT ST. LUCIE
Short Term Outlook for Port St. Lucie, FL
June 2026 Forecast
Personal Income (Billions $)
Establishment Employment (Place of Work, Thousands, SA)
Other Economic Indicators
PROFILES
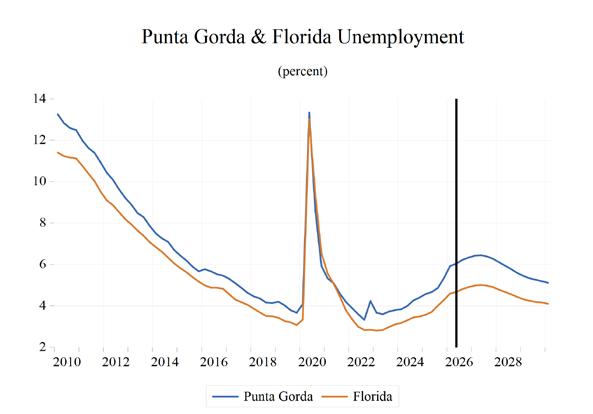
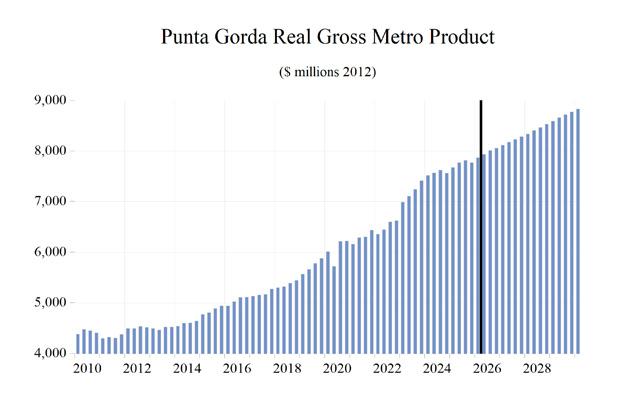
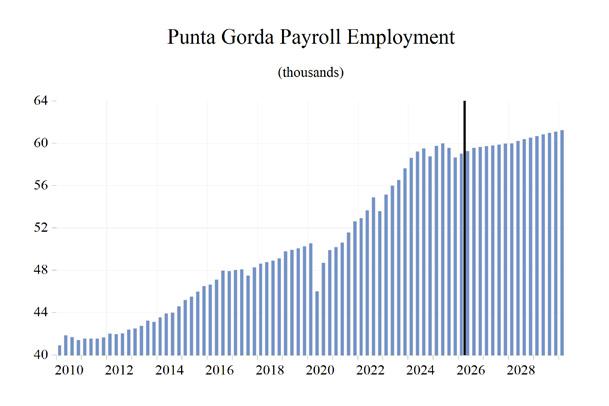
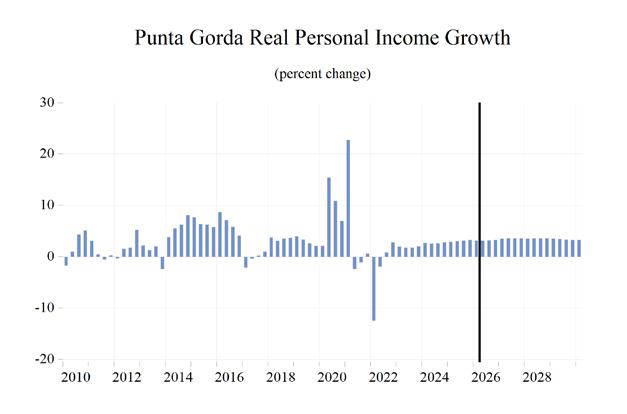
The Punta Gorda MSA is located in the southwest segment of the state. Punta Gorda is the County seat of Charlotte County and the only incorporated municipality in the country. The city is known as one of the top sport-fishing destinations along with the water recreation in Charlotte Harbor.
QUICK FACTS
• Metro population estimate of 212,122 as of 2023 (ACS 5-Year Estimate) (U.S. Census Bureau).
• Charlotte County population estimate of 189,900 as of 2023 (ACS 5-Year Estimate).
• Civilian labor force of 79,000 in August 2025 (FRED, U.S. Bureau of Labor Statistics).
• An unemployment rate of 5.6% as of August 2025, not seasonally adjusted. This amounts to 4,379 unemployed people (FRED, U.S. Bureau of Labor Statistics).
Punta Gorda MSA
Long Term Outlook for Punta Gorda, FL
June 2026 Forecast
Personal Income (Billions $)
Establishment Employment (Place of Work, Thousands, SA)
Economic Indicators
Short Term Outlook for Punta Gorda, FL
June 2026 Forecast
Personal Income (Billions $)
Establishment Employment (Place of Work, Thousands, SA)
Other Economic Indicators
PROFILES
The Sebastian MSA is located in central east Florida and is comprised of Indian River County. Sebastian is home to Pelican Island, America’s first National Wildlife refuge, and is known for its Atlantic-facing beaches.
QUICK FACTS
• Metro population estimate of 172,139 as of 2023 (ACS 5-Year Estimate) (U.S. Census Bureau).
• Indian River County population estimate of 160,986 as of 2023 (ACS 5-Year Estimate).
• Civilian labor force of 69,400 in August 2025 (FRED, U.S. Bureau of Labor Statistics).
• An unemployment rate of 5.6% as of August 2025, not seasonally adjusted. This amounts to 3,786 unemployed people (FRED, U.S. Bureau of Labor Statistics).
Total Nonagricultural Employment
Total Private Goods Producing Service Producing
Private Service Providing
Mining, Logging, and Construction
Trade,
Educational and Health Services
Leisure
Sebastian -Vero Beach MSA
Long Term Outlook for Sebastian-Vero Beach, FL
June 2026 Forecast
Personal Income (Billions $)
Establishment Employment (Place of Work, Thousands, SA)
Other Economic Indicators
Short Term Outlook for Sebastian-Vero Beach, FL
June 2026 Forecast
(Billions $)
Establishment Employment (Place of Work, Thousands, SA)
Other Economic Indicators
PROFILES
The Sebring MSA is comprised of Highlands County and is located in the South-central portion of the state. Sebring is nicknamed “The City on the Circle” in reference to Circle Drive, the center of the Sebring Downtown Historic District. Sebring is the home of the Sebring International Raceway, created on a former airbase and it is currently known as the host of the 12 Mobil 1 Twelve Hours of Sebring, an annual WeatherTech SportsCar Championship Race.
QUICK FACTS
• Metro population estimate of 109,778 as of 2023 (ACS 5-Year Estimate) (U.S. Census Bureau).
• Highlands County population estimate of 102,339 as of 2023 (ACS 5-Year Estimate).
• Civilian labor force of 37,700 in August 2025 (FRED, U.S. Bureau of Labor Statistics).
• An unemployment rate of 6.5% as of August 2025, not seasonally adjusted. This amounts to 2,374 unemployed people (FRED, U.S. Bureau of Labor Statistics).
Sebring MSA
Industry Location Quotients
Long Term Outlook for Sebring, FL
June 2026 Forecast
Income (Billions $)
Other Economic Indicators
Short Term Outlook for Sebring, FL
June 2026 Forecast
Establishment Employment (Place of Work, Thousands, SA)
Other Economic Indicators
PROFILES
The Tallahassee MSA is comprised of Gadsden, Jefferson, Leon, and Wakulla counties. It is located between Pensacola and Jacksonville on the Florida panhandle. Tallahassee is the capital city of Florida and the home to Florida State University and Florida A&M University.
QUICK FACTS
• Metro population estimate of 399,098 as of 2023 (ACS 5-Year Estimate) (U.S. Census Bureau).
• Gadsden County population estimate of 43,642 as of 2023 (ACS 5-Year Estimate).
• Jefferson County population estimate of 14,713 as of 2023 (ACS 5-Year Estimate).
• Leon County population estimate of 295,335 as of 2023 (ACS 5-Year Estimate).
• Wakulla County population estimate of 34,608 as of 2023 (ACS 5-Year Estimate).
• Civilian labor force of 205,800 in August 2025 (FRED, U.S. Bureau of Labor Statistics).
• An unemployment rate of 4.7% as of August 2025, not seasonally adjusted. This amounts to 9,782 unemployed people (FRED, U.S. Bureau of Labor Statistics).
Total Nonagricultural Employment
Total Private Goods Producing Service Producing
Private Service Providing
Mining, Logging, and Construction Manufacturing
Trade, Transportation, and Utilities
Wholesale Trade
Retail Trade
Transportation, Warehousing and Utilities
Information
Professional and Business Services
Educational and Health Services
Leisure and Hospitality
Other Services
Government
Tallahassee MSA Industry Location Quotients
Long Term Outlook for Tallahassee, FL
June 2026 Forecast
Personal Income (Billions $)
Establishment Employment (Place of Work, Thousands, SA)
Other Economic Indicators
Short Term Outlook for Tallahassee, FL
June 2026 Forecast
Personal Income (Billions $)
Establishment Employment (Place of Work, Thousands, SA)
Other Economic Indicators
PROFILES
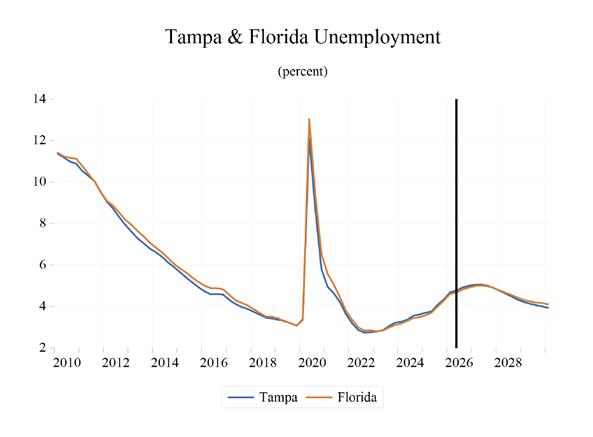
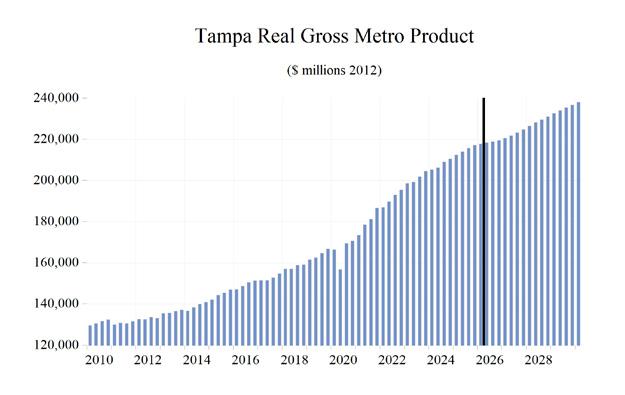
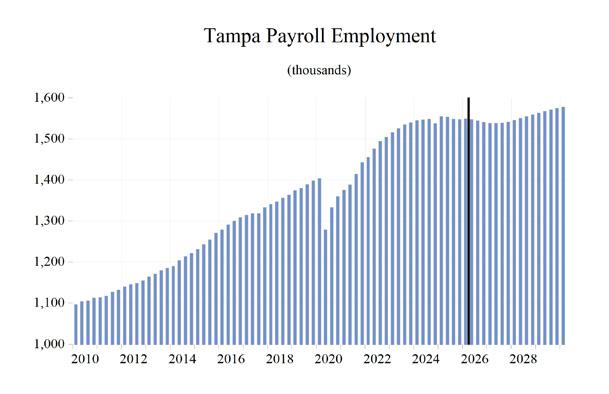
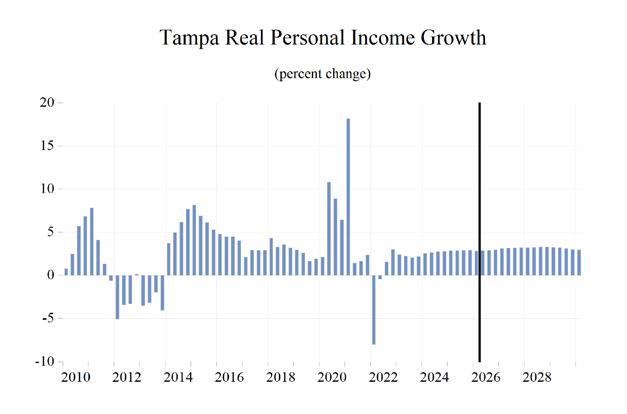
The Tampa–St. Petersburg–Clearwater MSA is comprised of Hernando, Hillsborough, Pasco, and Pinellas counties. Located centrally on the west coast of Florida, this region includes Tarpon Springs, Sponge Docks, Ybor City, Busch Gardens, the University of South Florida, and the University of Tampa. The Tampa Bay Buccaneers and the Tampa Bay Rays call this region home.
QUICK FACTS
• Metro population estimate of 3,424,560 as of 2023 (ACS 5-Year Estimate) (U.S. Census Bureau).
• Hernando County population estimate of 201,512 as of 2023 (ACS 5-Year Estimate).
• Hillsborough County population estimate of 1,489,634 as of 2023 (ACS 5-Year Estimate).
• Pasco County population estimate of 588,758 as of 2023 (ACS 5-Year Estimate).
• Pinellas County population estimate of 960,565 as of 2023 (ACS 5-Year Estimate).
• Civilian labor force of 1,697,600 in August 2025 (FRED, U.S. Bureau of Labor Statistics).
• An unemployment rate of 4.4% as of August 2025, not seasonally adjusted. This amounts to 75,761 unemployed people (FRED, U.S. Bureau of Labor Statistics).
Total Nonagricultural Employment
Total Private Goods Producing Service Producing
Private Service Providing
Mining, Logging, and Construction Manufacturing
Trade, Transportation, and Utilities
Wholesale Trade
Retail Trade
Transportation, Warehousing and Utilities Information Financial Activities
Professional and Business Services
Educational and Health Services
Leisure and Hospitality Other Services Government
Tampa - St. Petersburg - Clearwater
Long Term Outlook for Tampa-St. Petersburg-Clearwater, FL
June 2026 Forecast
Personal Income (Billions $)
Establishment Employment (Place of Work, Thousands, SA)
Other Economic Indicators
Short Term Outlook for Tampa-St. Petersburg-Clearwater, FL
June 2026 Forecast
Economic Indicators
PROFILES
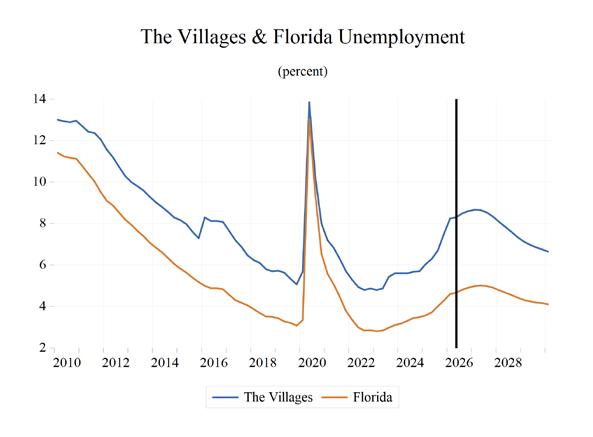
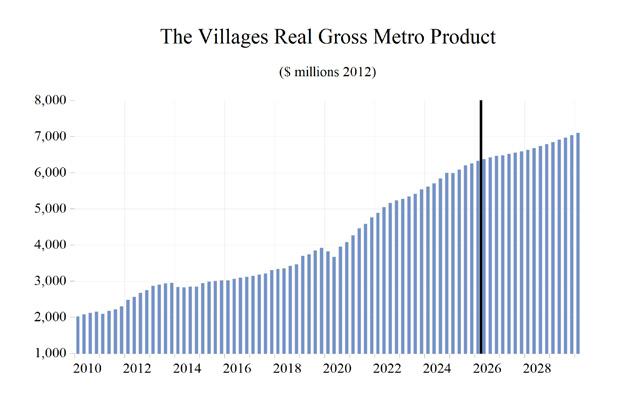
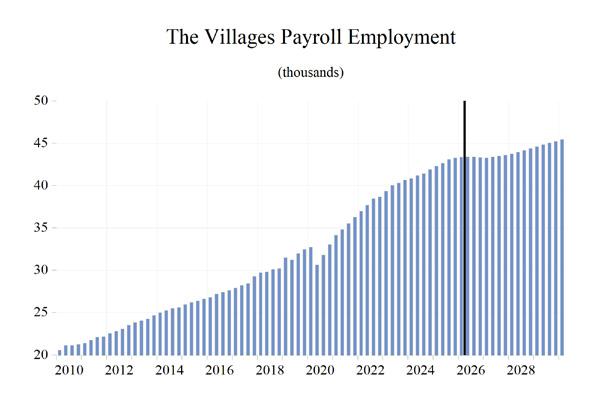
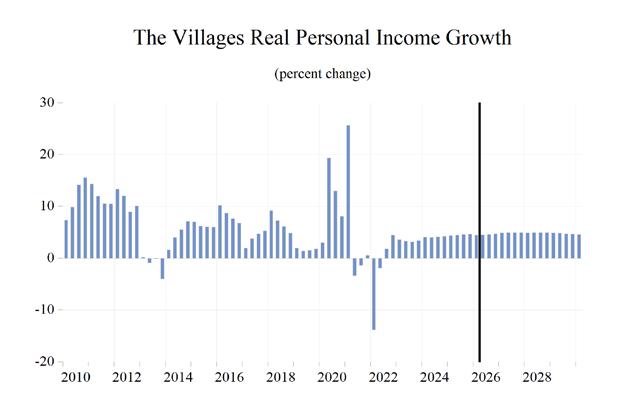
The Villages, located in central Florida, approximately an hour north of Orlando. It is the largest retirement community in the world, comprised mostly of Sumter County, but also includes parts of Lake and Marion counties.
QUICK FACTS
• Metro population estimate of 131,832 as of 2023 (ACS 5-Year Estimate) (U.S. Census Bureau).
• Sumter County population estimate of 137,536 as of 2023 (ACS 5-Year Estimate).
• Civilian labor force of 39,300 in August 2025 (FRED, U.S. Bureau of Labor Statistics).
• An unemployment rate of 4.7% as of August 2025, not seasonally adjusted. This amounts to 2,647 unemployed people (FRED, U.S. Bureau of Labor Statistics).
The Villages MSA Industry Location Quotients
Long Term Outlook for The Villages, FL
June 2026 Forecast
Personal Income (Billions $)
Other Economic Indicators
Short Term Outlook for The Villages, FL June 2026 Forecast
Income (Billions $)
Establishment Employment (Place of Work, Thousands, SA)
Other Economic Indicators
PROFILES
The West Palm Beach–Boca Raton–Boynton Beach MSA stretches from the state’s Atlantic coast into the rural center and includes the northern edge of the everglades national park. It is known for being the “Golf Capital of Florida” and its sandy beaches.
QUICK FACTS
• Metro population estimate of 1,494,805 as of 2023 (ACS 5-Year Estimate) (U.S. Census Bureau).
• Palm Beach County population estimate of 1,507,453 as of 2023 (ACS 5-Year Estimate).
• Civilian labor force of 782,100 in August 2025 (FRED, U.S. Bureau of Labor Statistics).
• An unemployment rate of 7.6% as of August 2025, not seasonally adjusted. This amounts to 34,785 unemployed people (FRED, U.S. Bureau of Labor Statistics).
Palm Beach County MSA
Long Term Outlook for West Palm Beach-Boca Raton-Delray Beach, FL (Division of Miami MSA)
June 2026 Forecast
Personal Income (Billions $)
Establishment Employment (Place of Work, Thousands, SA)
Other Economic Indicators
Short Term Outlook for West Palm Beach-Boca Raton-Delray Beach, FL (Division of Miami MSA)
June 2026 Forecast
Establishment Employment (Place of Work, Thousands, SA)
Other Economic Indicators
EXPLANATION AND INTERPRETATION
This technique compares the local economy to a reference economy; in this case, the local economy is the chosen MSA, and the reference economy is the state of Florida. An Industry Location Quotient (LQ) is calculated to determine if the local economy has a greater share of each industry’s employment than the reference economy. The LQ helps to identify specializations that exist in the local economy.
There are only three possible outcomes: 1. An LQ greater than one 2. An LQ equal to one; and 3. An LQ less than one. An LQ that is greater than one; means that the share of local employment in that particular industry is greater than the reference economy employment share in that same industry. This implies that some of the goods or services produced by that industry are exported for consumption elsewhere. An LQ of one means that local demand is met by the local industry. No goods/services are imported or exported from the local area in that industry. The share of local employment in that industry is equal to the share for that industry in the reference economy. An LQ less than one implies that the industry is not meeting local demand for that good or service, and in order to meet demand, that area must import that good or service. This also means that the share of local employment in that industry is less than the share of employment in that industry for the reference economy.
CALCULATION
An industry location quotient is a calculated ratio of two ratios.
LQ = ((Local employment in industry A in year T / Total local employment in year T) / (Reference economy employment in industry A in year T) / (Total reference employment in year T))
For example:
Orlando MSA employment for Information is 27,400
Total Orlando MSA nonagricultural employment is 1,104,100
Florida employment for Information is 169,800
Total Florida nonagricultural employment is 8,247,000
Sean Snaith, Ph.D., is the director of the University of Central Florida’s Institute for Economic Forecasting and a nationally recognized economist in the field of business and economic forecasting.
Snaith is the recipient of multiple awards for the accuracy of his forecasts, his research and his teaching. He has served as a consultant for local governments and multinational corporations such as Compaq, Dell and IBM.
Before joining UCF’s Barry S. Miller College of Business, he held teaching positions at Pennsylvania State University, American University in Cairo, the University of North Dakota and the University of the Pacific.
Snaith is frequently interviewed in international, national and regional media. He has been quoted in The Wall Street Journal, USA Today, The New York Times, The Economist and The Guardian and has appeared on CNBC, Fox Business Network, NBC Nightly News, the BBC and CBC, and Nippon TV.
Snaith is a sought-after speaker known for his engaging and humorous presentations. He has built a national reputation for his unique ability to explain complex subject matter in a digestible manner. He earned praise from one business editor for having “an uncanny knack of making economics not only understandable but interesting.”
Snaith is a member of several economic organizations and national economic forecasting panels, including The Wall Street Journal’s Economic Forecasting Survey, the Associated Press’ Economy Survey, CNNMoney. com’s Survey of Leading Economists, USA Today’s Survey of Top Economists, Federal Reserve Bank of Philadelphia’s Survey of Professional Forecasters, Bloomberg and Reuters.
Snaith holds a B.S. in Economics from Allegheny College and an M.A. and Ph.D. in Economics from Pennsylvania State University.