QUARTERLY REPORT Q4 FY 25-26 4/1/26-6/30/26 LODGING Source: STR; All performance metrics are running 12-month averages for most recent month available at time of reporting. Inventory figures represent Tulsa hospitality market and hotel classes as defined by STR.
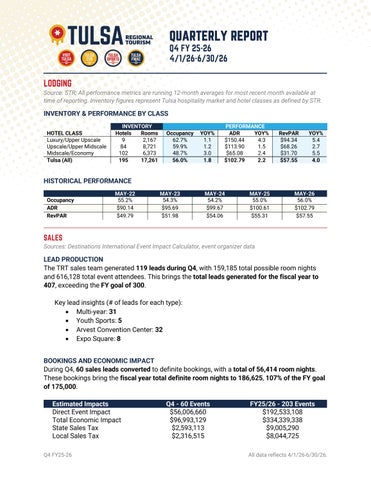
INVENTORY & PERFORMANCE BY CLASS HOTEL CLASS Luxury/Upper Upscale Upscale/Upper Midscale Midscale/Economy Tulsa (All)
INVENTORY Hotels Rooms 9 2,167 84 8,721 102 6,373 195 17,261
Occupancy 62.7% 59.9% 48.7% 56.0%
YOY% 1.1 1.2 3.0 1.8
PERFORMANCE ADR YOY% $150.44 4.3 $113.90 1.5 $65.08 2.4 $102.79 2.2
RevPAR $94.34 $68.26 $31.70 $57.55
YOY% 5.4 2.7 5.5 4.0
HISTORICAL PERFORMANCE Occupancy ADR RevPAR
MAY-22 55.2% $90.14 $49.79
MAY-23 54.3% $95.69 $51.98
MAY-24 54.2% $99.67 $54.06
MAY-25 55.0% $100.61 $55.31
MAY-26 56.0% $102.79 $57.55
SALES Sources: Destinations International Event Impact Calculator, event organizer data
LEAD PRODUCTION The TRT sales team generated 119 leads during Q4, with 159,185 total possible room nights and 616,128 total event attendees. This brings the total leads generated for the fiscal year to 407, exceeding the FY goal of 300. Key lead insights (# of leads for each type): • Multi-year: 31 • Youth Sports: 5 • Arvest Convention Center: 32 • Expo Square: 8 BOOKINGS AND ECONOMIC IMPACT During Q4, 60 sales leads converted to definite bookings, with a total of 56,414 room nights. These bookings bring the fiscal year total definite room nights to 186,625, 107% of the FY goal of 175,000. Estimated Impacts Direct Event Impact Total Economic Impact State Sales Tax Local Sales Tax Q4 FY25-26
Q4 - 60 Events $56,006,660 $96,993,129 $2,593,113 $2,316,515
FY25/26 - 203 Events $192,533,108 $334,339,338 $9,005,290 $8,044,725 All data reflects 4/1/26-6/30/26.
LOST BUSINESS Missed opportunities during the quarter included 52 events, with 54,995 total room nights and $35,785,229 estimated direct event spending. Top Lost Business Reasons* (# of leads for each reason): • Client’s board preferred alternate destination: 15 • Insufficient space/rooms under one roof: 4 • Geographic location: 4 *Specific lost business reasons were not disclosed by the event organizer for 3 leads.
EXPERIENCE EVENT ORGANIZER FEEDBACK Post-event surveys were sent to 58 organizers, with 15 responses received for events hosted during the quarter. Net Promoter Scores (NPS)* How likely would you be to How likely would you be to recommend recommend hosting your event in working with Tulsa Regional Tourism to host Tulsa? your event? NPS: 67 NPS: 80 *NPS is reported on a scale of -100 to 100, calculated as % Promoters – % Detractors. Promoters are respondents who, on a 10-point likelihood scale, provided ratings of 9-10, while Detractors provided ratings of 0-6. VISITORS CENTER DATA • • • • • • •
Number of Walk-Ins: 1,127 (+67% vs. Apr-Jun 2025) Number of Visitors: 2,374 (+71% vs. Apr-Jun 2025) Partner Publications Available on Site: 46 Number of Non-US Visitor Countries: 15 Number of Visitor States and DC: 49 Top 3 States Outside of Oklahoma: TX, MO, CA Top Visitor Interest: Route 66 (33% of all reported interests)
MARKETING & COMMUNICATIONS ADVERTISING PERFORMANCE
Sources: Google Ad Network, META, HyperLocal, Octane
Performance metrics by channel for 16 unique advertising campaigns targeting audiences along Route 66 and within Tulsa’s drive market radius in these cities and DMAs: AR: Bentonville, Fort Smith/Fayetteville/ Springdale/Rogers, Little Rock IL: Chicago KS: Wichita MO: Branson, Kansas City, St. Louis Q4 FY25-26
NM: Albuquerque OK: Oklahoma City TN: Memphis TX: Amarillo, Dallas, Fort Worth
All data reflects 4/1/26-6/30/26.
Channel Display Social TOTALS
Impressions 3,060,795 2,623,652 5,684,447
Clicks 39,481 156,219 195,700
Click-Through-Rate (CTR) 1.29% 5.95%
EARNED MEDIA
Source: Muck Rack
• •
1,975,369,839 Total Unique Visitors Monthly (UVM*) for TRT brands $18,272,708 Ad Value Equivalency (AVE) for TRT brands
*UVM represents the potential domain-level figure for the reporting outlets and may include duplicate users across domains. Key Tulsa coverage during Q4 included stories from these outlets: Forbes AOL KDAF-TV (Dallas) Associated Press KDVR-TV (Denver) Billboard L’Observateur Breaking Travel News Morningstar Chicago Sun-Times
MusicRow USA Today SEEN Magazine The Times Yahoo
SPECIAL REPORT – Capital Cruise coverage Tulsa’s Route 66 Capital Cruise: World-Record Classic Car Centennial Parade set out to be an unmatched celebration of the Centennial of America’s iconic Highway, Route 66, in a safe and secure environment, and that goal was achieved. Tulsa is now the proud owner of the record for Largest Parade of Classic Cars in History, beating the previous record by 44 percent. After deductions for stalled/disabled vehicles, gaps in the parade longer than two car lengths and non-compliant vehicles, the official world record total is 3,596—1,105 cars more than the previous record. The event garnered significant national media attention, with Tulsa’s story being featured in hundreds of placements. Placements 678
Total Audience 185M
Total UVM 2.55B
AVE $26.5M
EVENTS & VISITORS GUIDE Source: ISSUU
Q4 FY25-26
Spring / Summer 2026 • Total Digital Impressions: 44,413 • Total Reads: 3,407 • Total Clicks: 113
All data reflects 4/1/26-6/30/26.
SOCIAL MEDIA
Source: Sprout Social Followers for TRT brands across various social media platforms and change in followers for end of Q4 compared to end of Q3
Facebook Instagram TikTok
41,719
15,570
+25.2%
35,604
+4.32%
+10.2%
12,498 +5.59%
Facebook Instagram
4,003
N/A
5,531
+4.23%
1,269 N/A
11,836 +46.2%
WEBSITE
Source: GA4 Website analytics for visittulsa.com and percent changes from previous periods Metric Users Sessions New Users Pageviews
Q4 299,661 421,660 296,296 737,915
Q4 vs. Q3 56.9% 76.8% 57.5% 64.6%
Q4 vs. Q4 Prior Year -45.3% -36.0% -45.0% -24.5%
Despite overall decreases compared to the prior year due to fewer digital advertising campaigns, there were positive changes in the quality of website visits, with an 11.4% increase in engaged sessions for Q4 vs. Q4 prior year and a 64.8% increase in organic active users.
TULSA OFFICE OF FILM, MUSIC, ARTS & CULTURE FILM/TV PRODUCTIONS Source: Reel Scout
Q4 Projects Assisted Tulsa FMAC assisted 20 new projects during Q4 in addition to 8 ongoing projects. This brings the total number of projects assisted during the fiscal year to 57. Productions were lost to OKC due to their film incentive. Production Days 136 934 Q4 Cumulative
Local Spend $31,887,672 $40,672,785 Q4 Cumulative
Total Crew Reported 393 934 Q4 Cumulative
Lost Productions 1 2 Q4 Cumulative
Q4 Productions Filmed in the Tulsa Region Q4 had 14 wrapped productions that were filmed in the Tulsa region, bringing the fiscal year total to 43 projects. This includes only wrapped projects and does not include filming currently in production. Shorts 3
Feature (Indie) 3
Commercials 3
Documentary 1
Television 2
Other 2
TULSA ON TOUR
Musicians Assisted* Tour Dates Funds Granted 23 116 197 495 $13,250 $37,500 Q4 Cumulative Q4 Cumulative Q4 Cumulative *Please note that artists may receive grants in more than one quarter. The final total represents unique artists and counts each artist only once. Q4 FY25-26
All data reflects 4/1/26-6/30/26.