
From

From
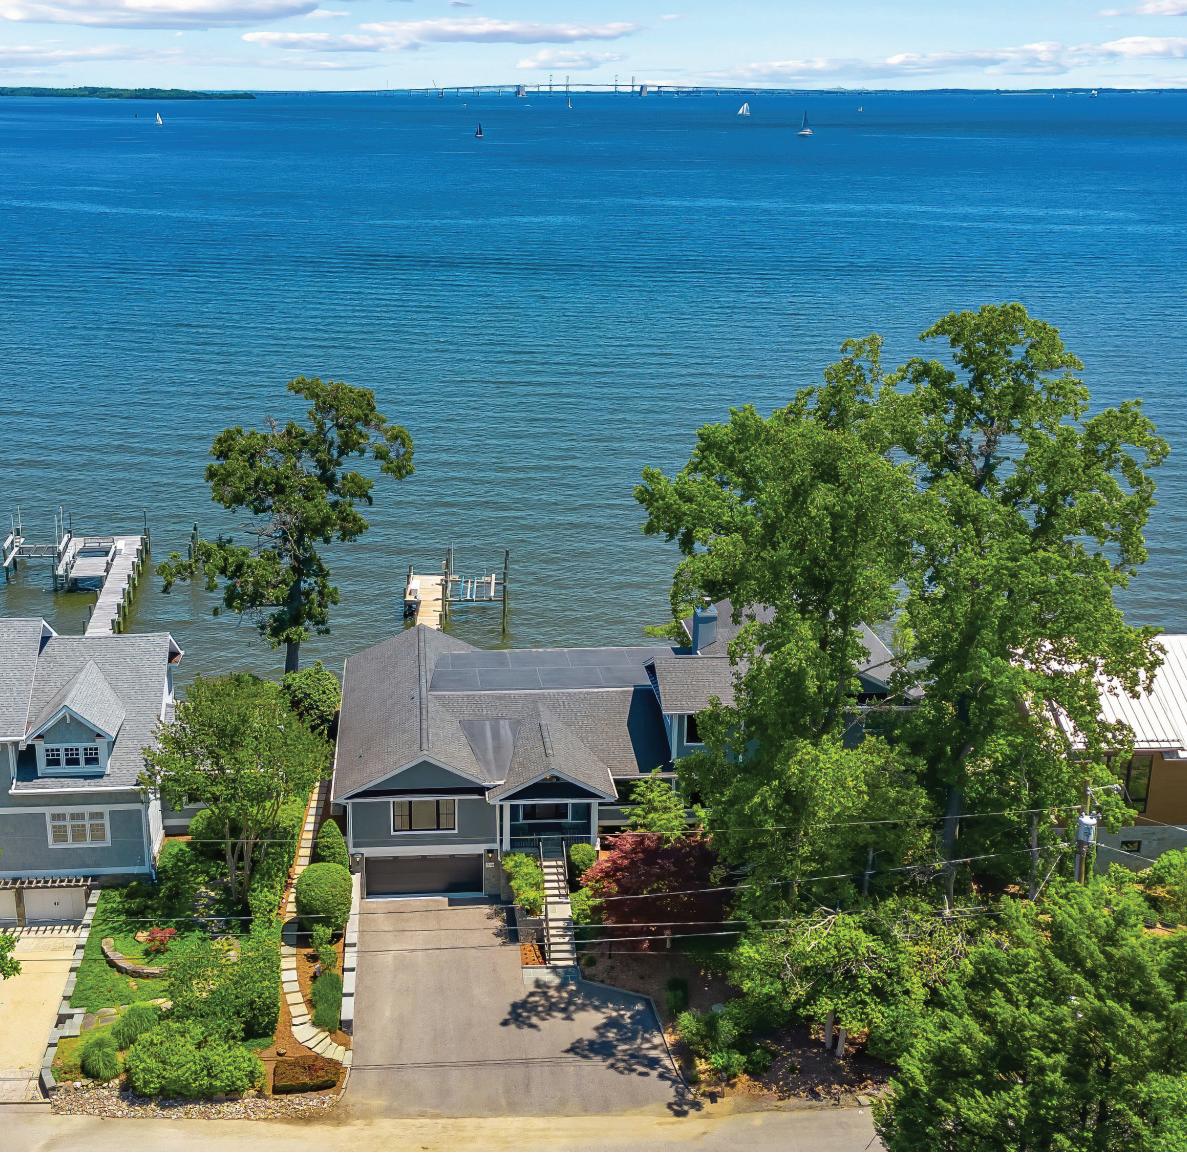
the Eastern Shore, waterfront homes in the greater Washington Metropolitan Area are among the most coveted in the United States.
But what makes a waterfront property desirable? And what are the key value drivers that in uence pricing power and demand for buyers and sellers alike?
In our inaugural Waterfront Market Report, we examine the data and trends powering luxury waterfront real estate in two of the most proli c markets in our region: Anne Arundel County, Maryland and Talbot County, Maryland.

Analyzing 7,935 real estate transactions for the year ending 2025, we identify what really matters when it comes to waterfront homes, including the most valuable home features, the price premium between waterfront and non-waterfront homes, and other unique insights that are designed to give you the edge when you are looking for your next waterfront home.
Tap below to navigate directly to desired location
FAST FACTS
WATERFRONT PREMIUM
TOP MARKETS
ESSENTIAL FEATURES
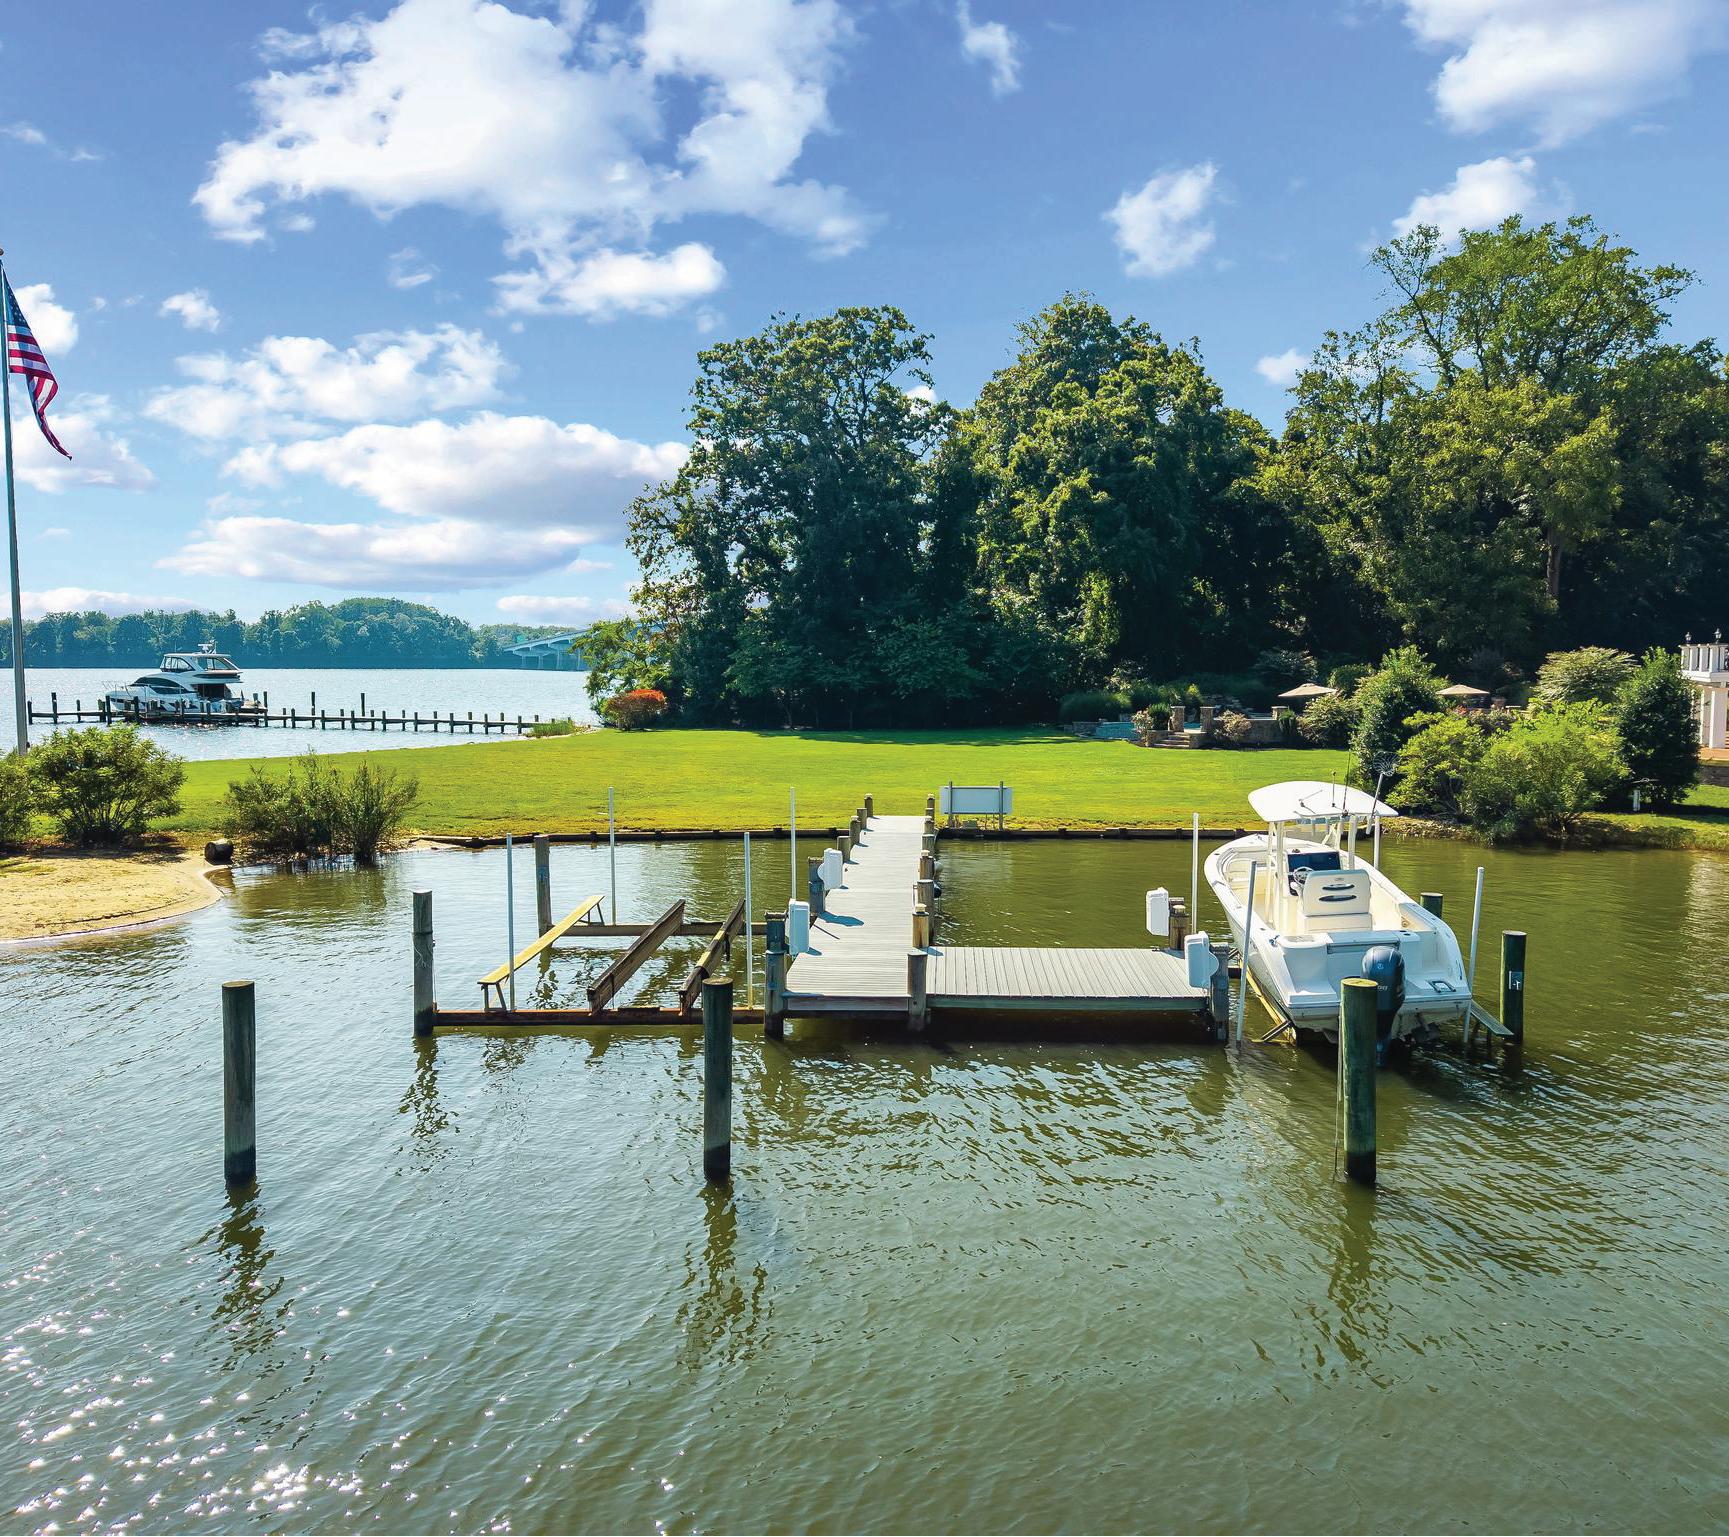
PRIVATE DOCKS
RIP-RAP
MEAN LOW WATER
NAVIGABLE WATER
RIPARIAN RIGHTS
IN FOCUS
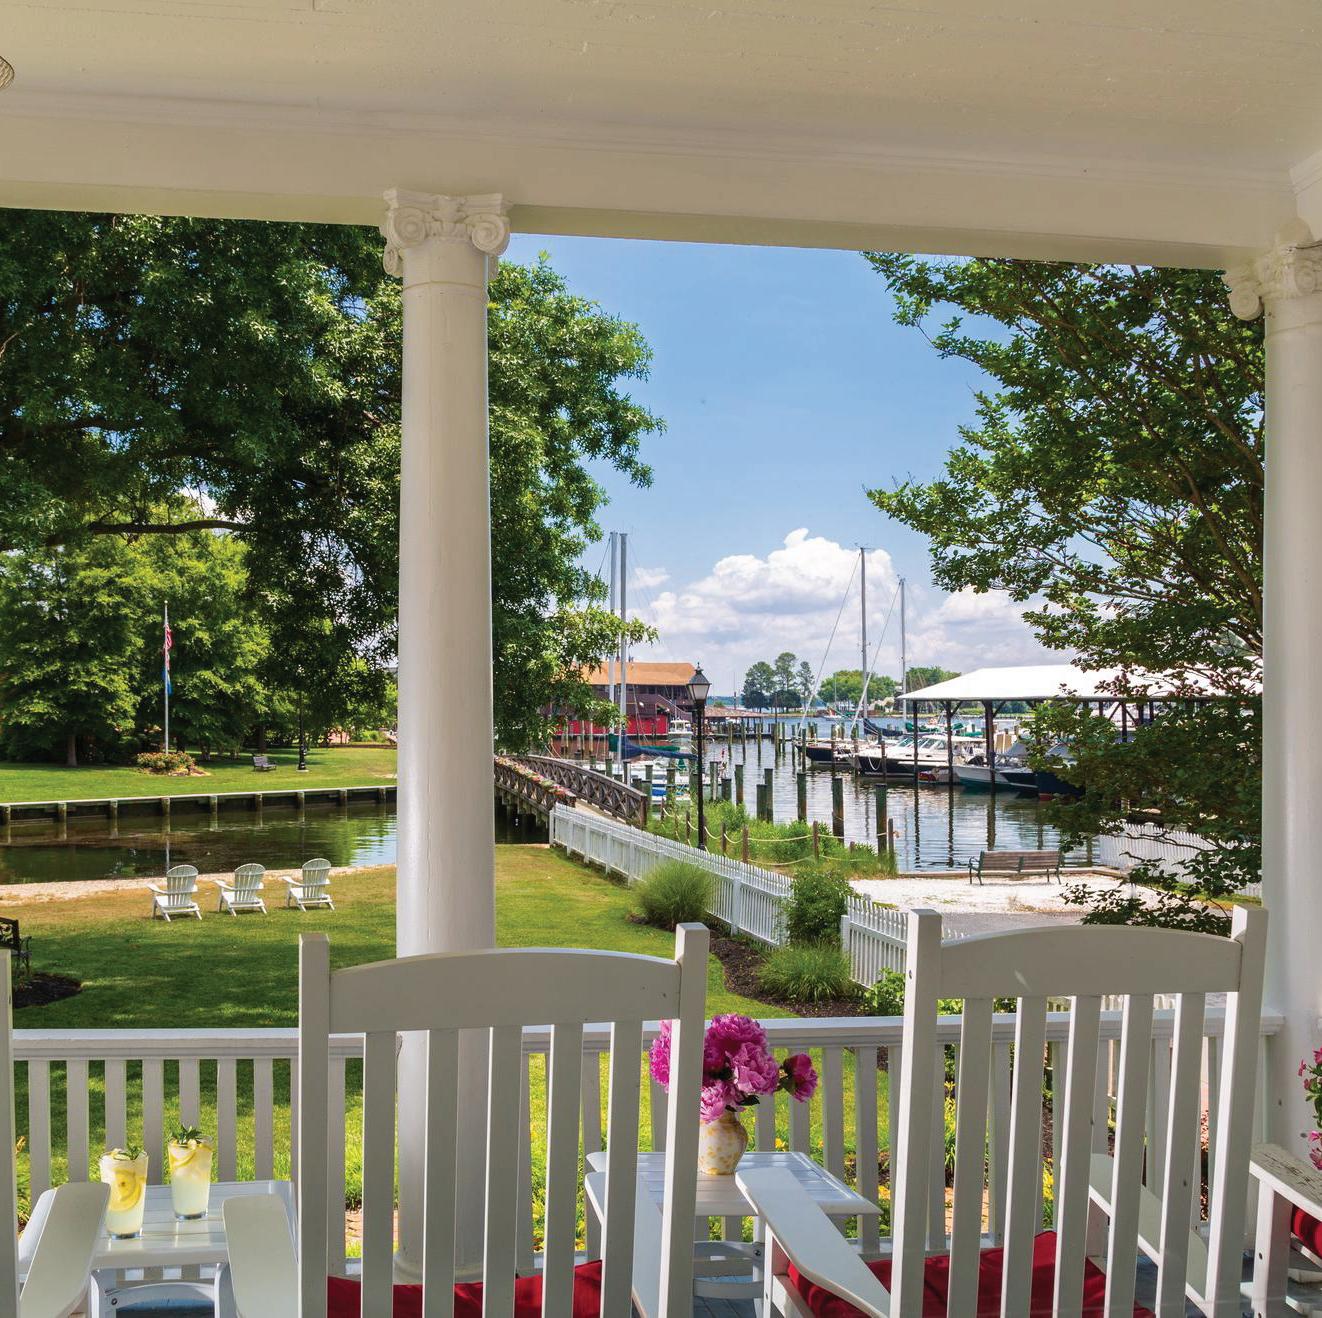
ANNAPOLIS
EASTON
MICHAELS

Total sold dollar volume for waterfront homes in Anne Arundel County and Talbot County are equivalent to approximately $811 Million for the year ending 2025.

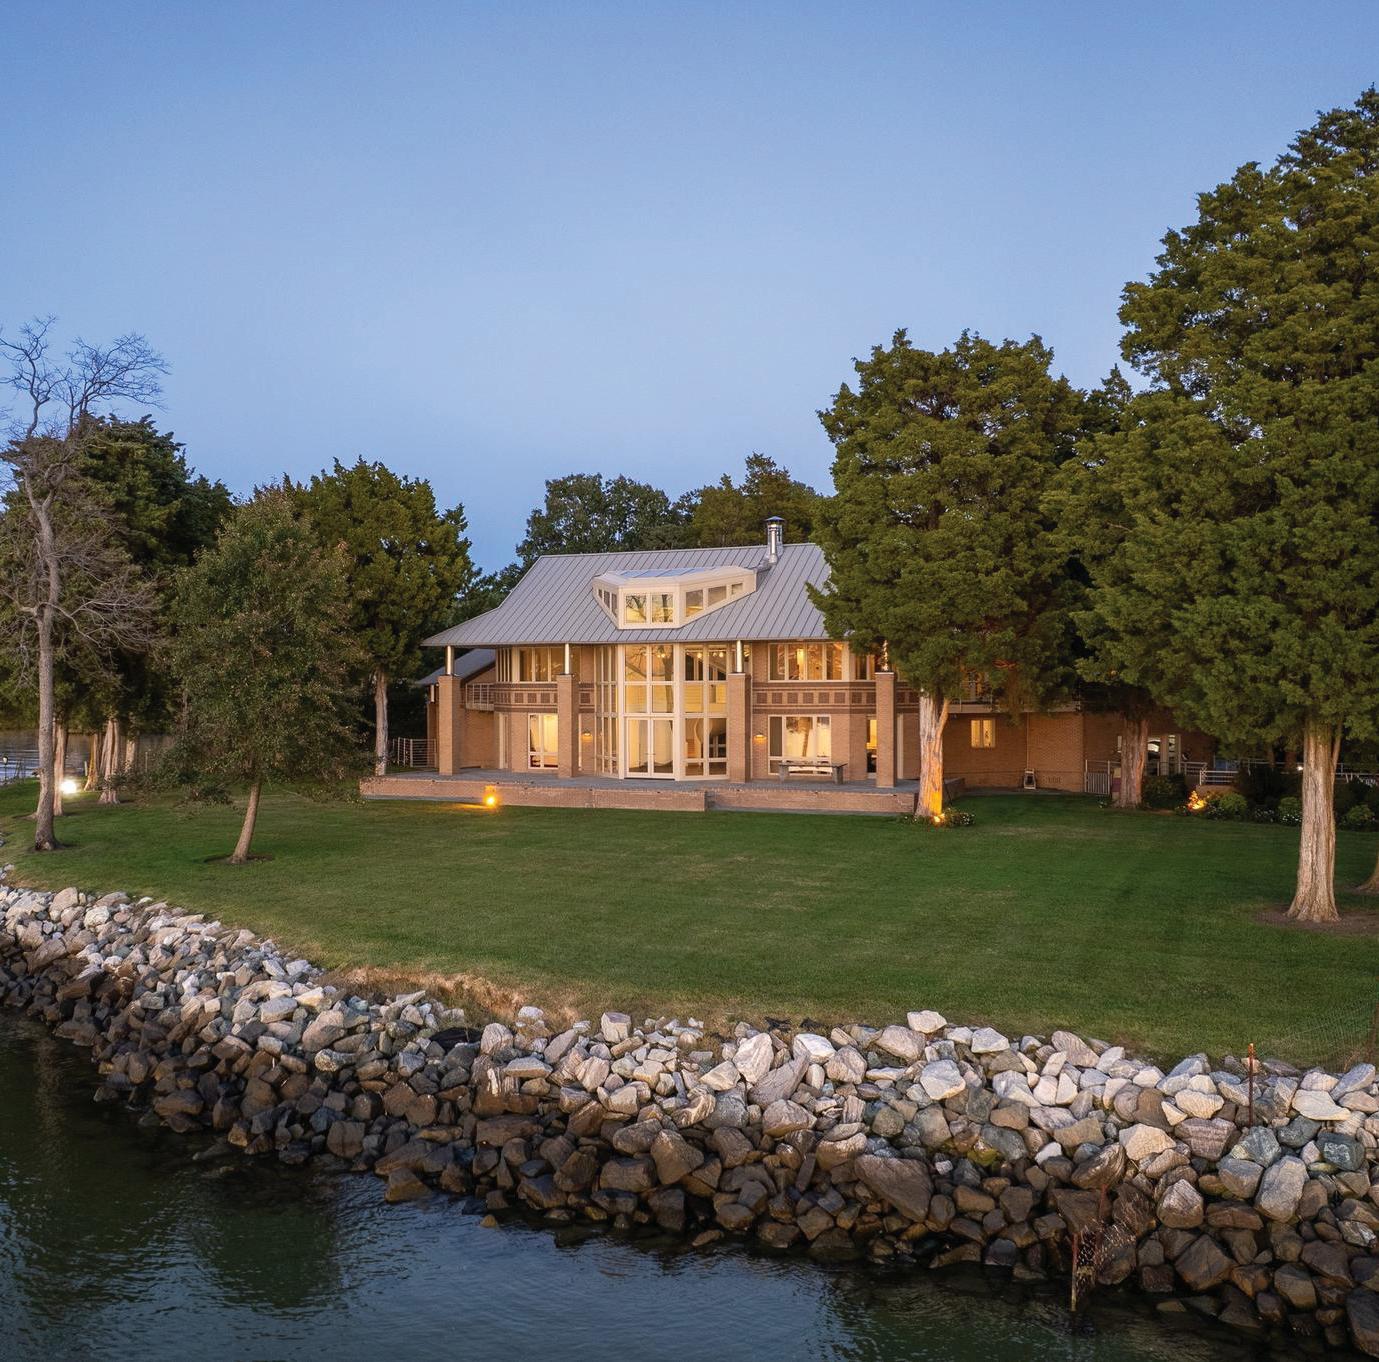
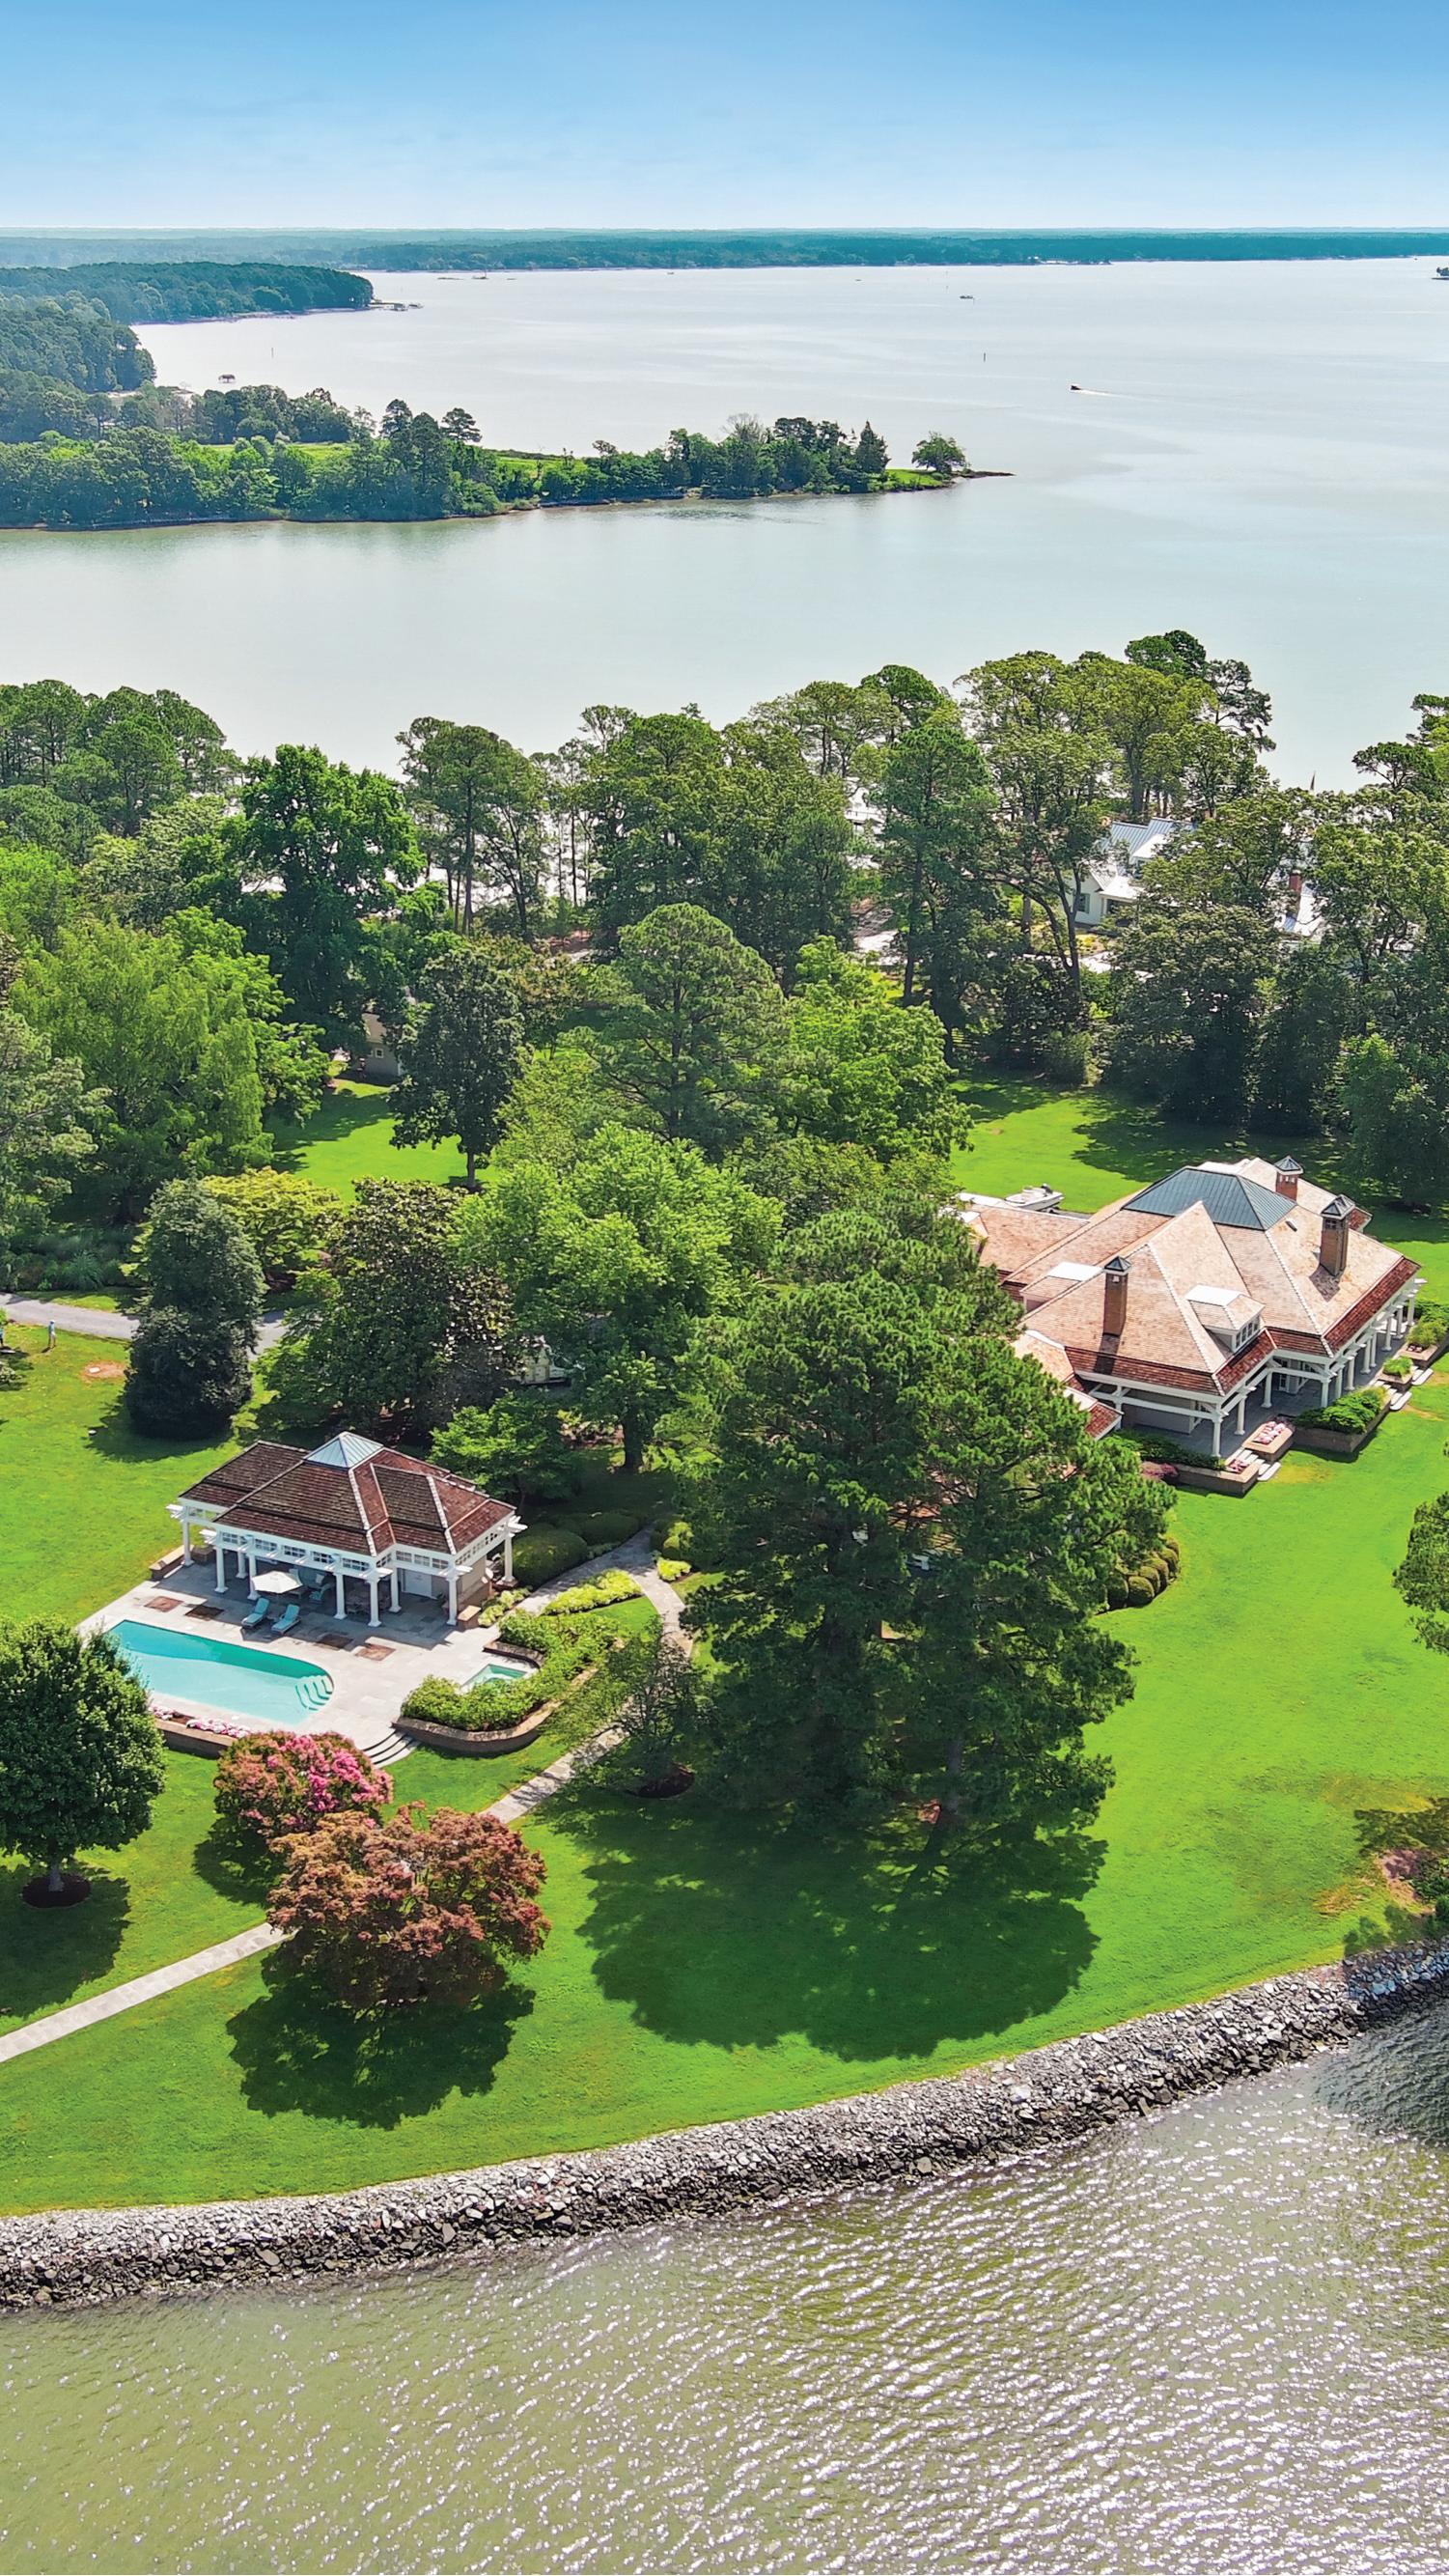
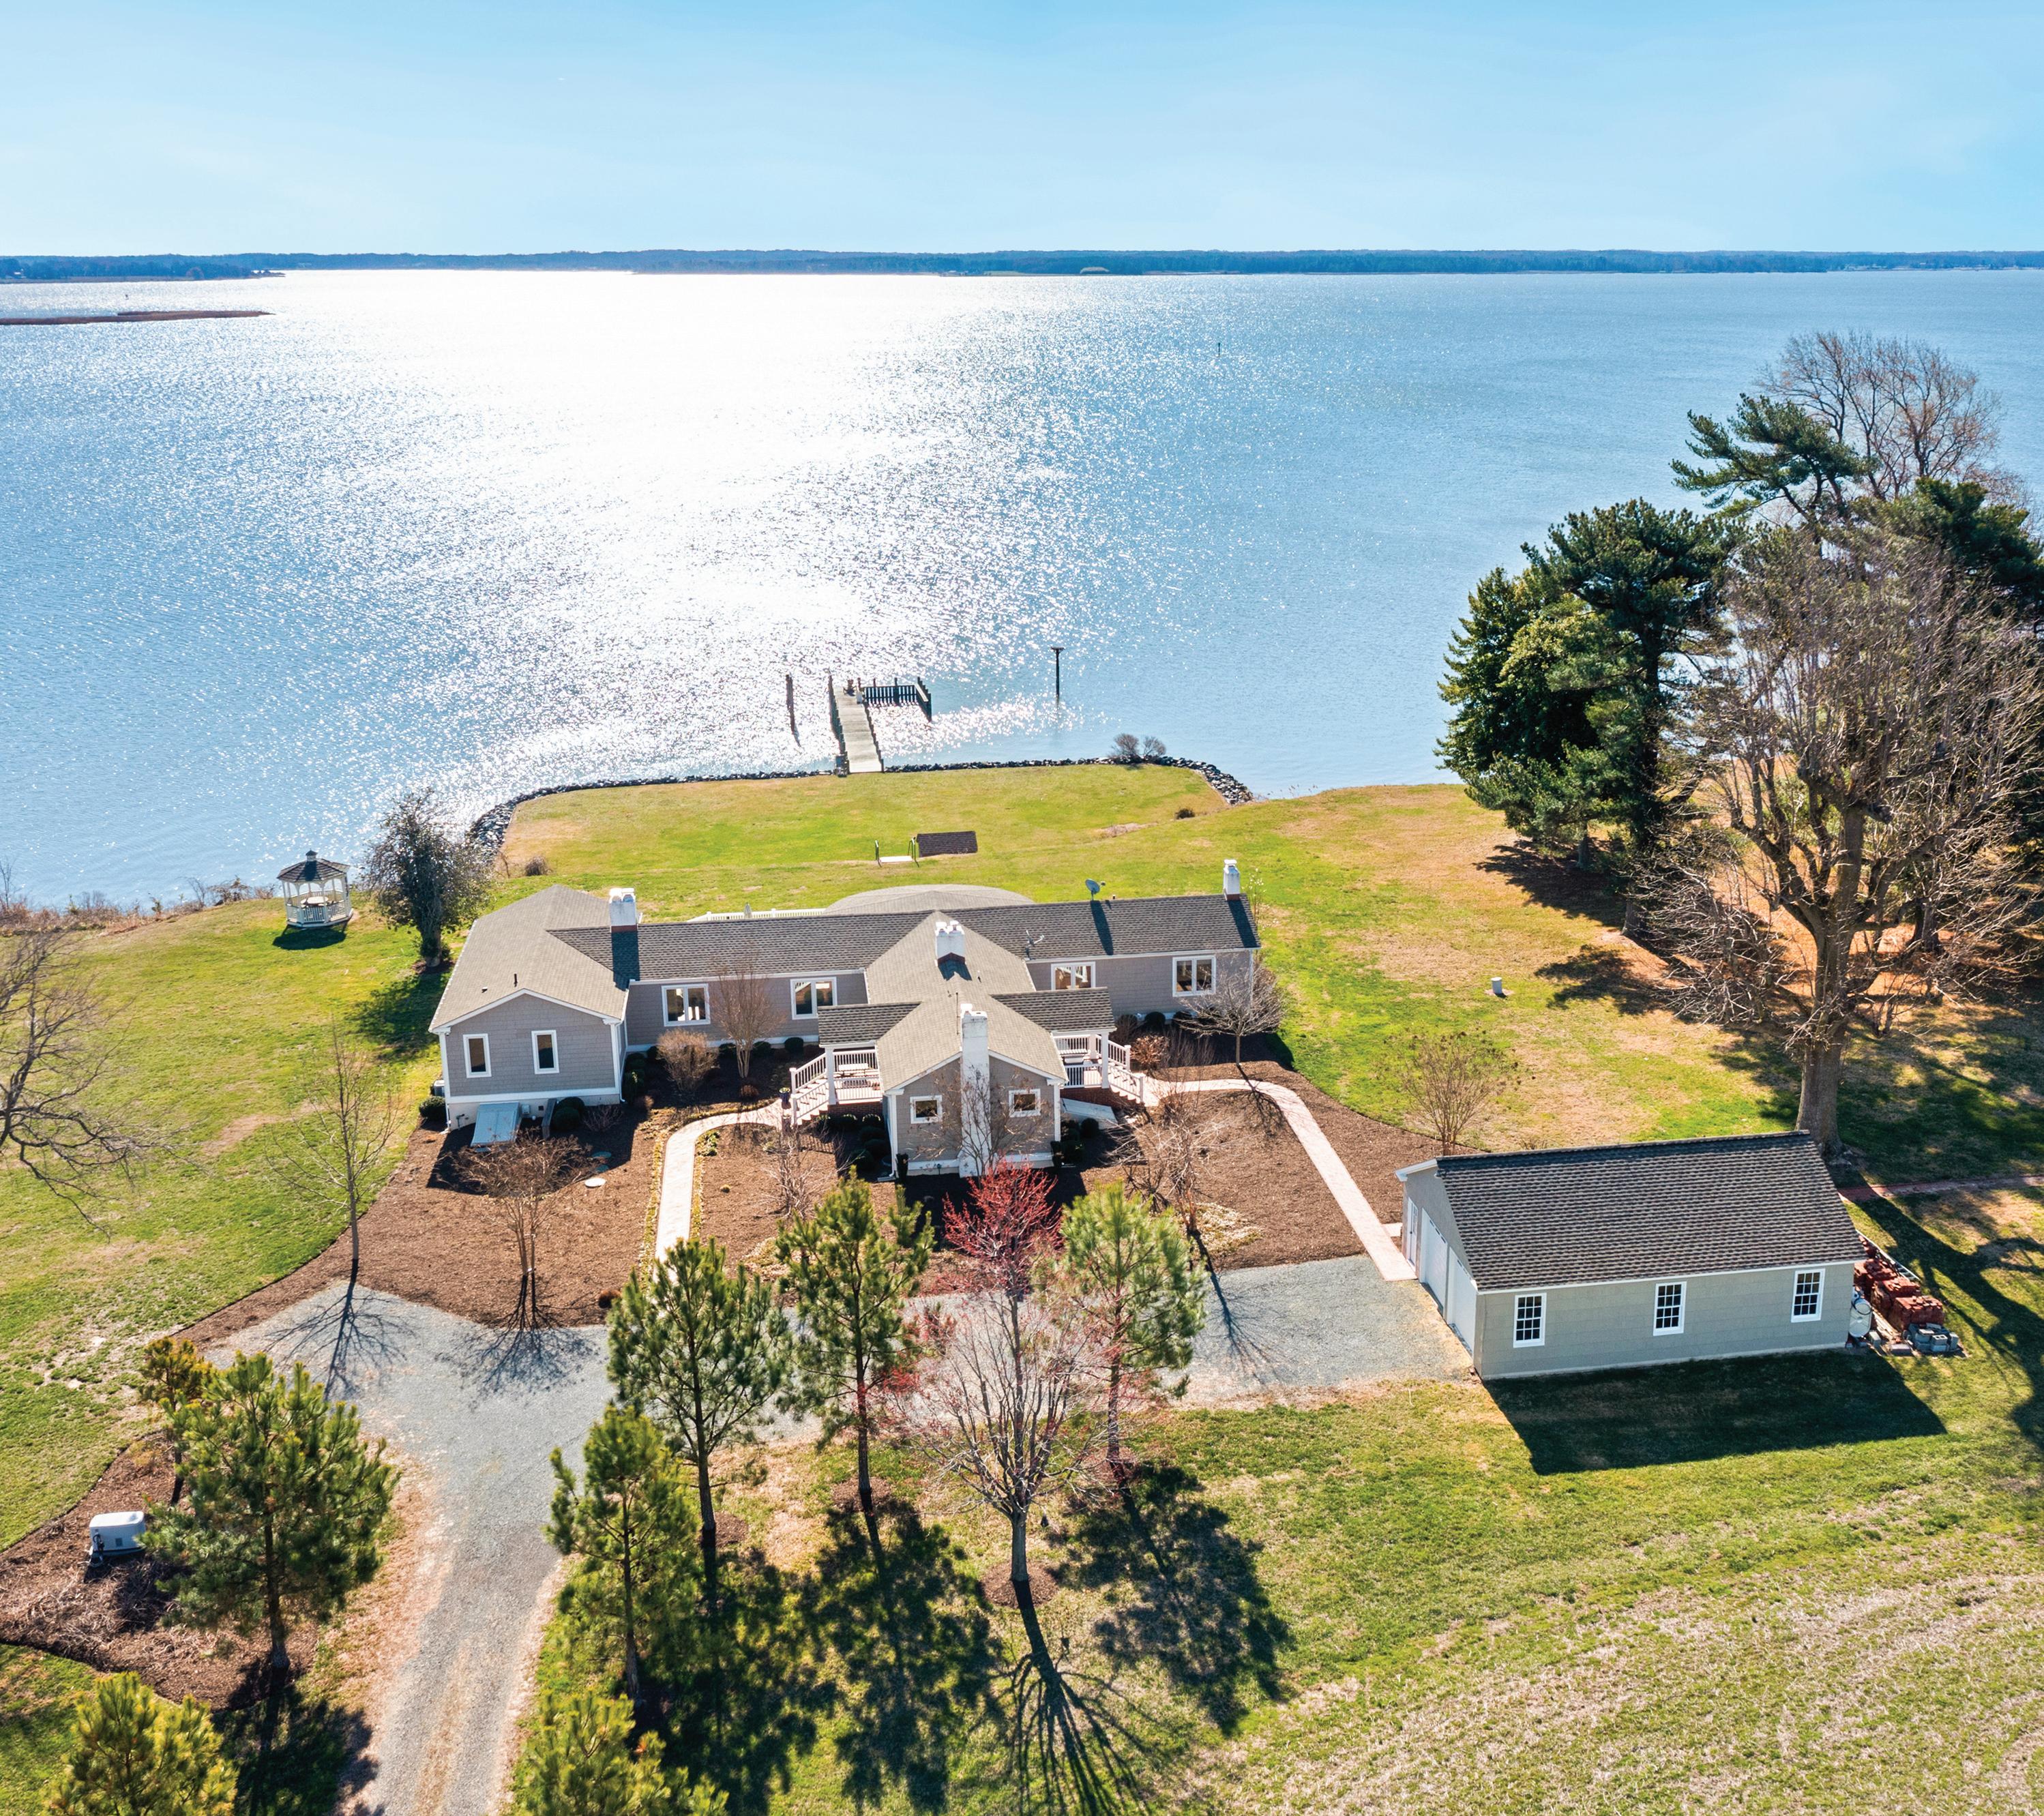
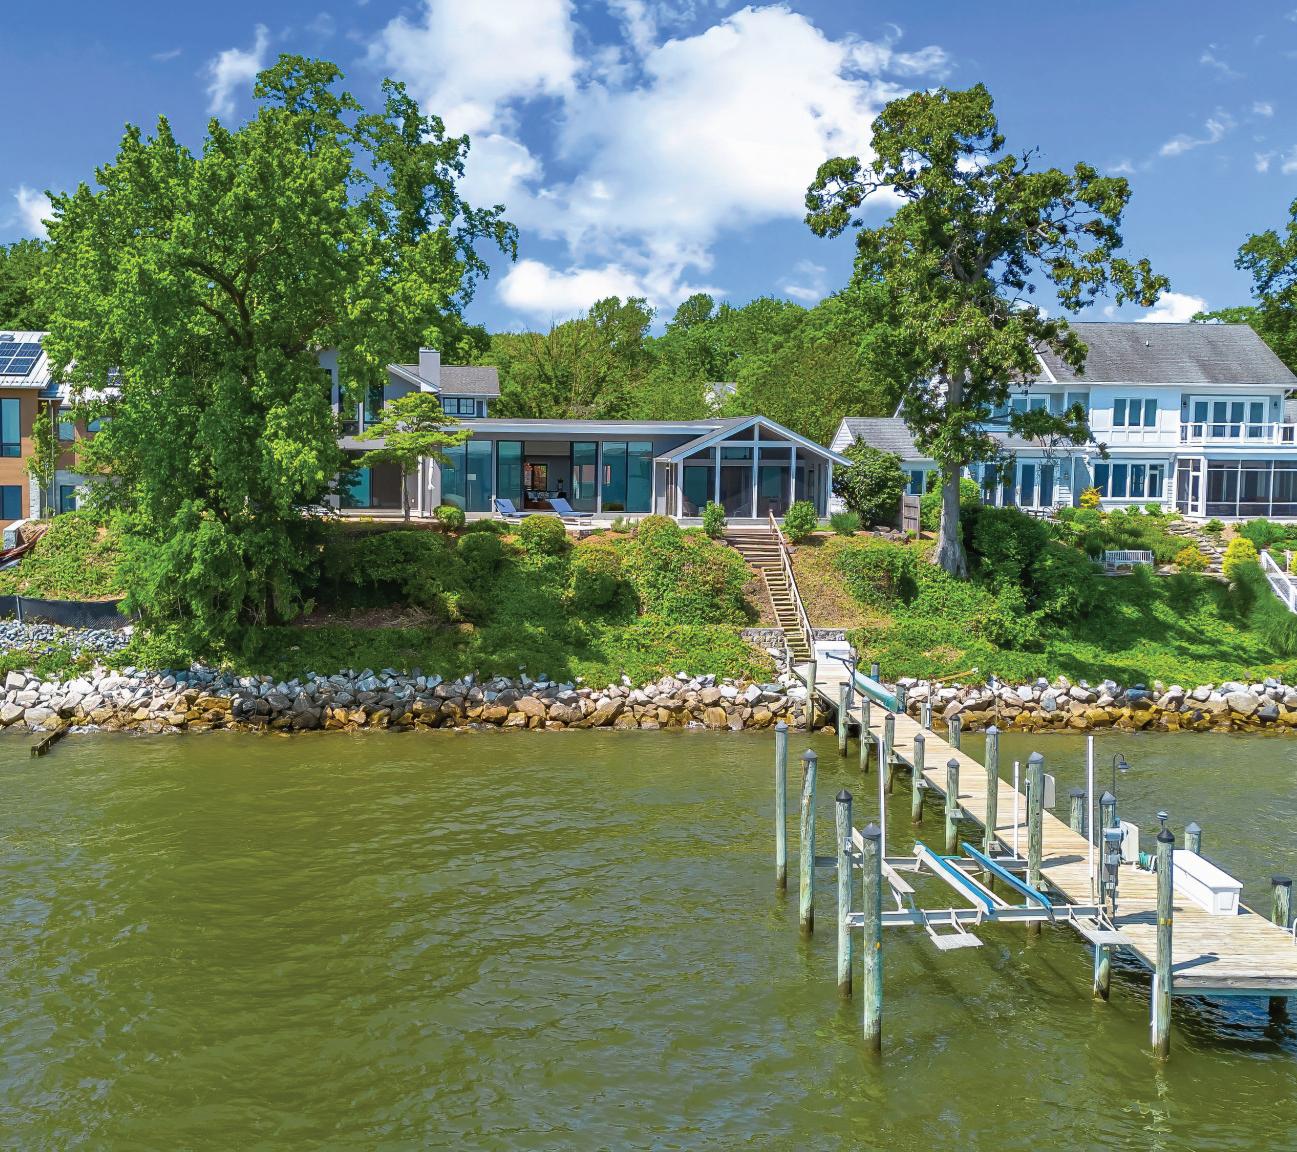
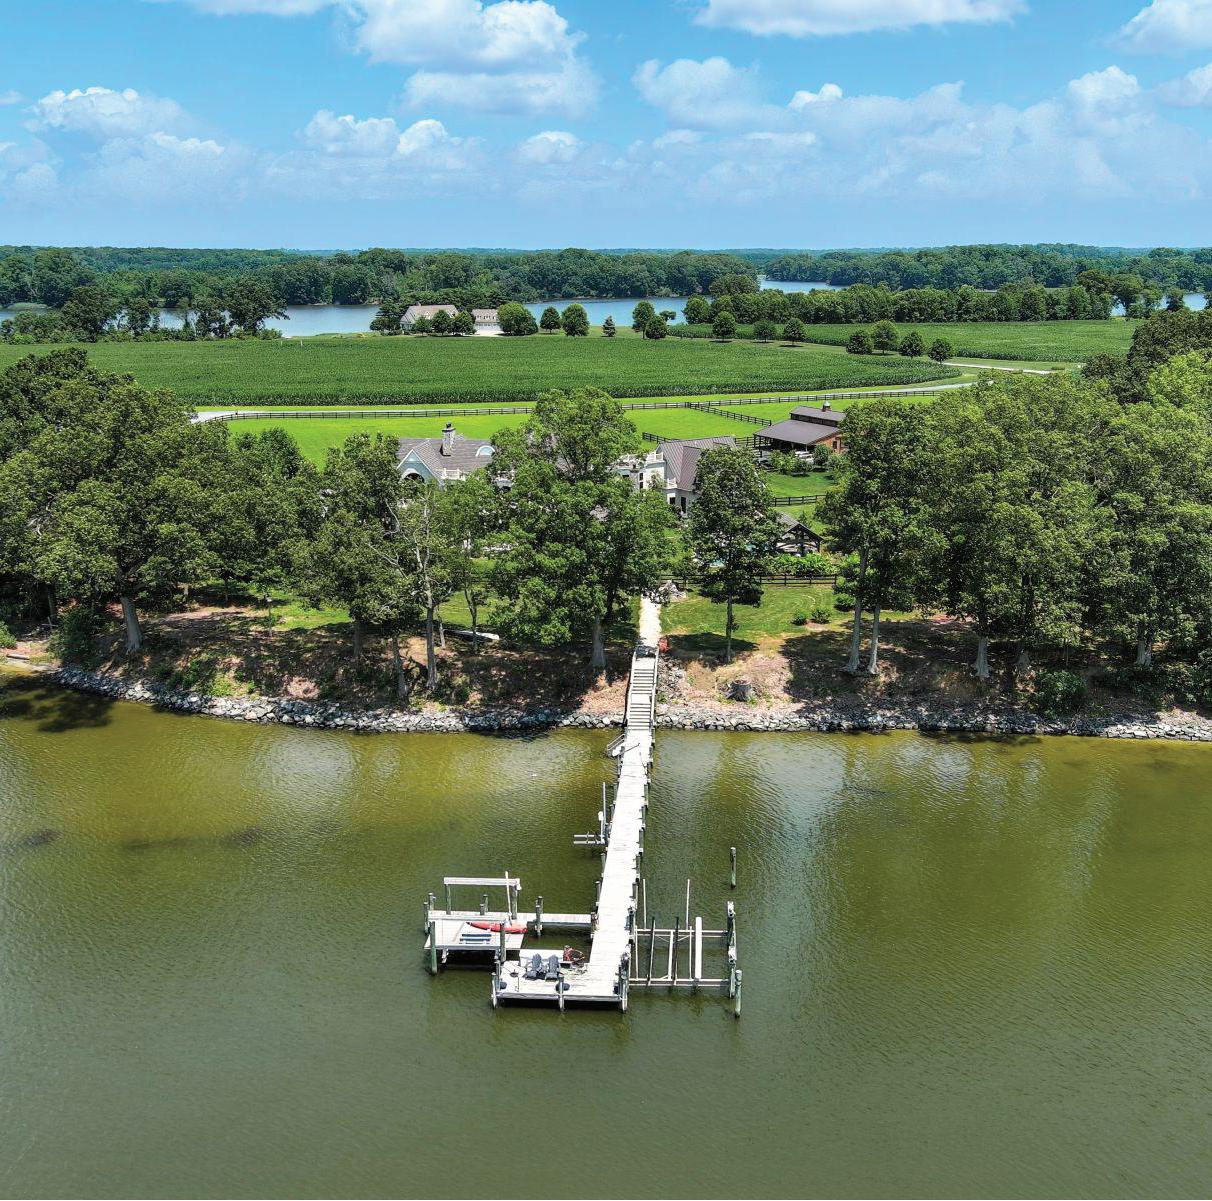
5440 FERRY NECK ROAD ROYAL OAK,
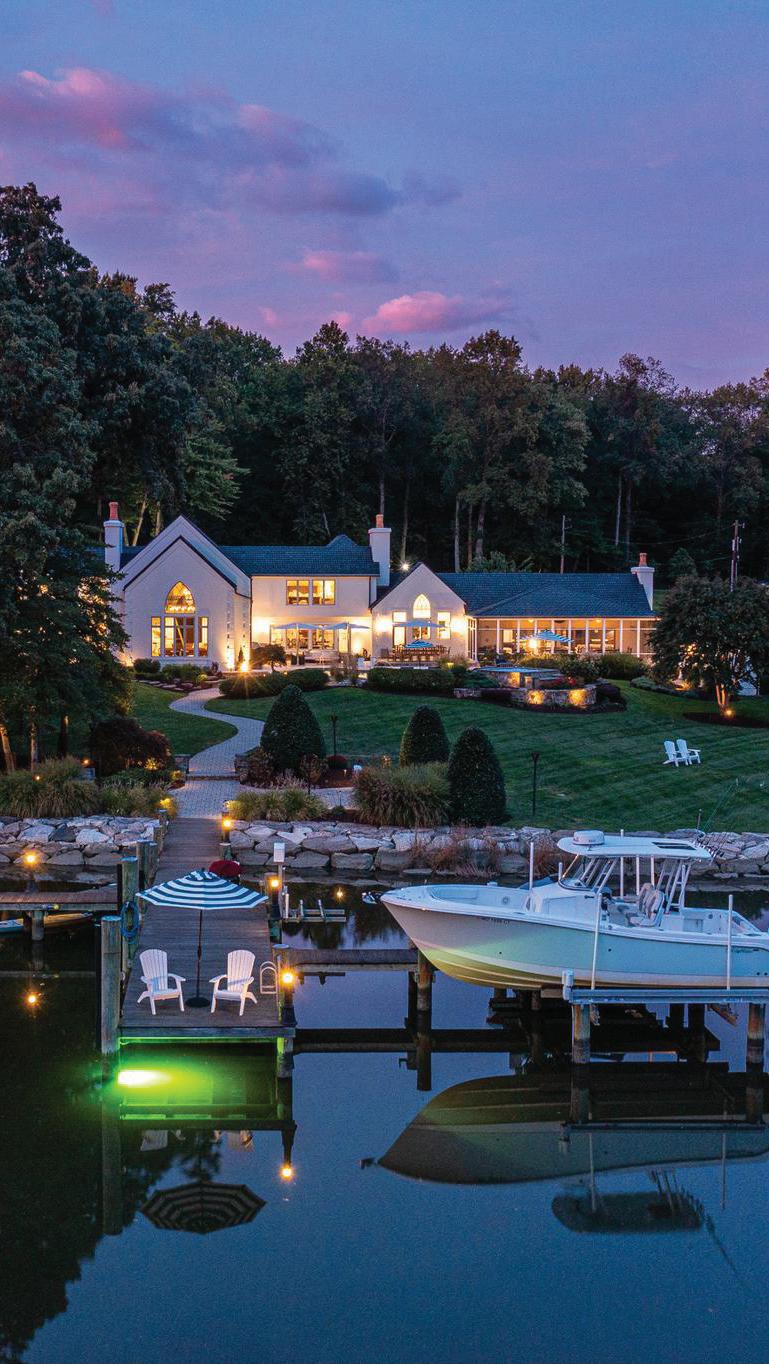
The median sale price for waterfront homes with a Private Dock Site is 39% higher than those without a private dock.
WITH PRIVATE DOCK SITE
291
Number of Transactions
$1,525,000
Median Sales Price
165
Number of Transactions
Median Sales Price WITHOUT PRIVATE DOCK SITE
$1,100,000
The median sale price for waterfront homes with Rip-Rap was 56% higher than those without Rip-Rap, suggesting that properties with premium, protected, and well-maintained shorelines are more likely to command a high price.
Median Sales Price WITH RIP-RAP
89 Number of Transactions
$1,950,000
$1,250,000 Median Sales Price WITHOUT RIP-RAP
367 Number of Transactions
A property’s estimated water depth at its shoreline is a signi cant indicator of boatability and water access quality. Properties which report Mean Low Water command a 36% premium relative to those that don’t.
MEAN LOW WATER REPORTED
274
Number of Transactions
$1,499,500
Median Sales Price
MEAN LOW WATER NOT REPORTED
182
Number of Transactions
$1,105,000
Median Sales Price

The vast majority of waterfront home sales include Navigable Water, con rming it as a near-universal expectation for the market. Properties that are on navigable water sell for approximately 76% higher than properties without Navigable Water.
442
Number of Transactions
Median Sales Price WITH NAVIGABLE WATER
$1,399,000
Median Sales Price WITHOUT NAVIGABLE WATER
14 Number of Transactions
$795,000
Waterfront homes that have Riparian Rights sold for more than double (105%) the median sale price of waterfront homes that do not have Riparian Rights. Those purchasing or selling waterfront homes are well served to verify Riparian Rights prior to transacting.
251 Number of Transactions
$1,640,000 Median Sales Price WITH RIPARIAN RIGHTS
$800,000 Median Sales Price WITHOUT RIPARIAN RIGHTS
45 Number of Transactions


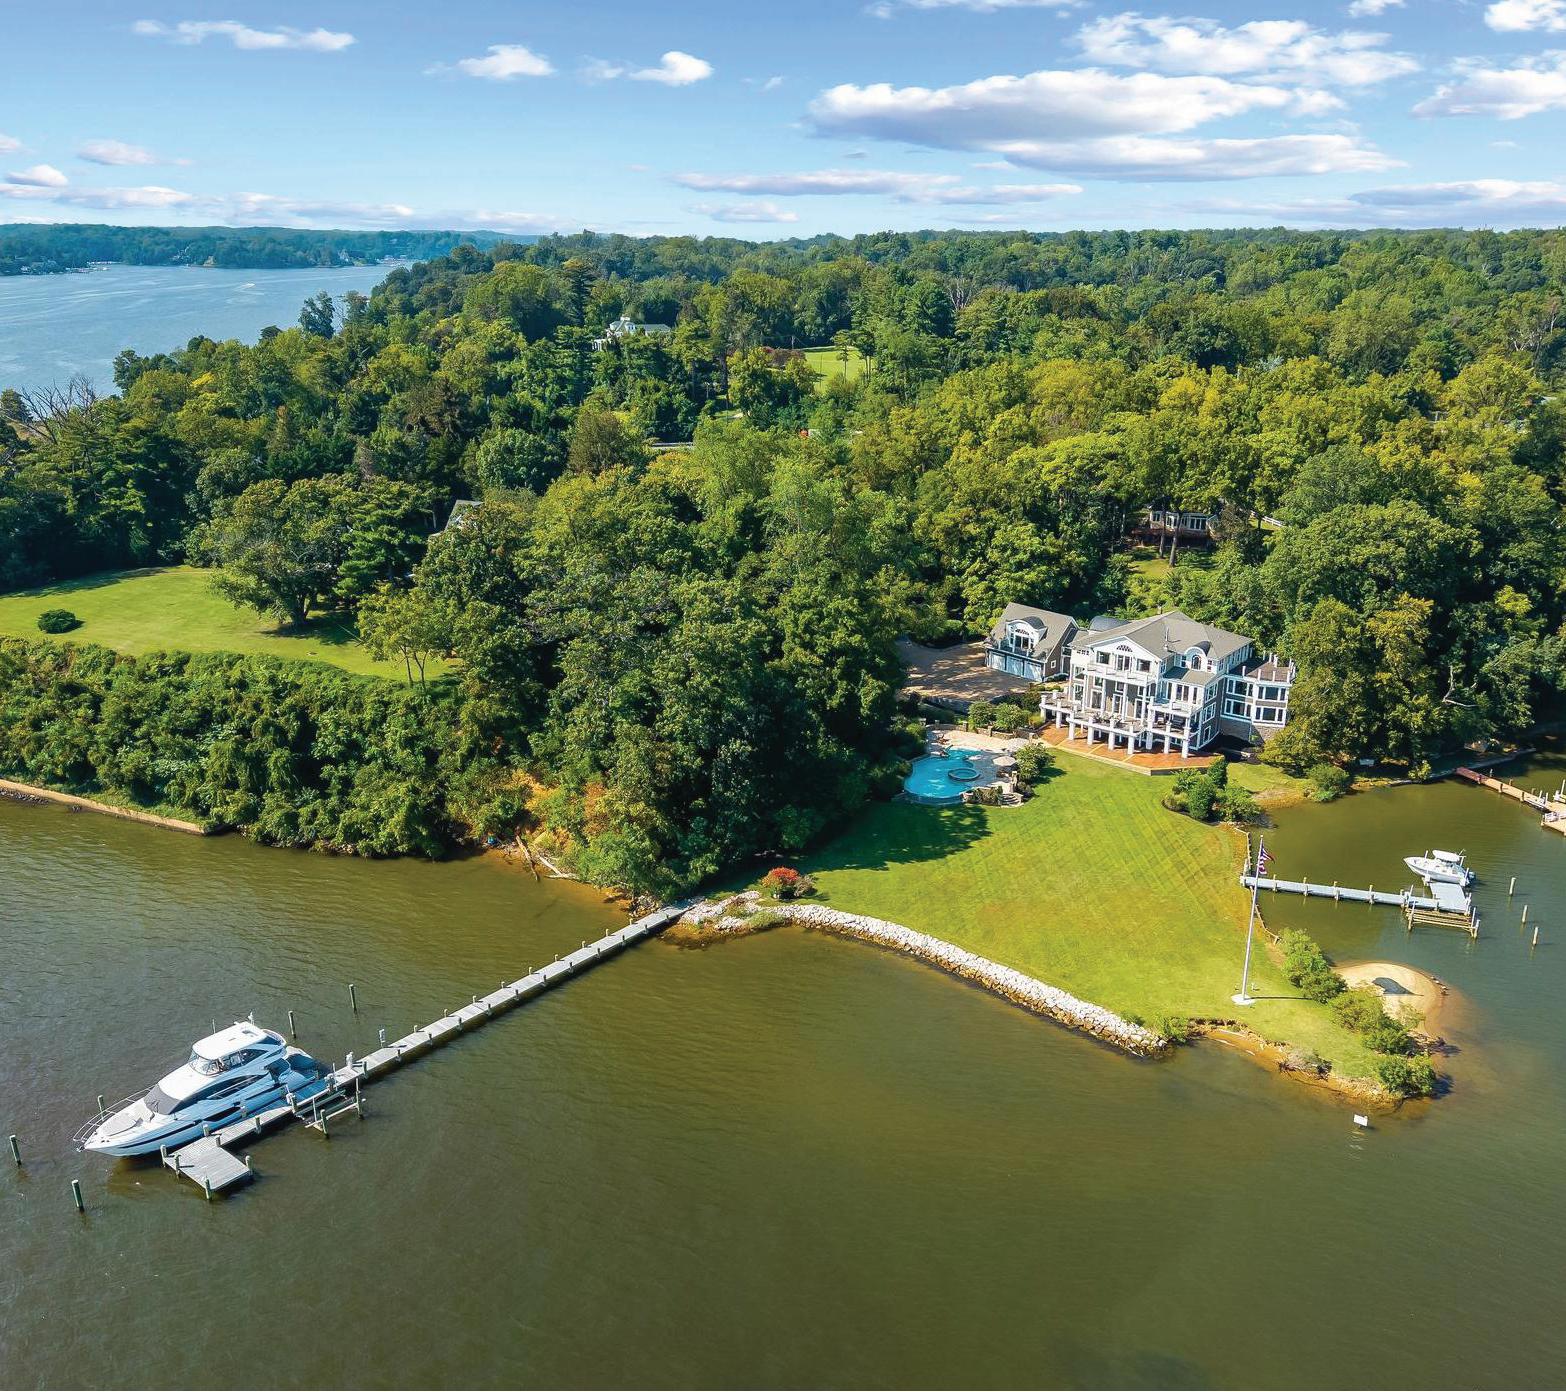
2 RIVER DRIVE, ANNAPOLIS, MARYLAND IN FOCUS 2025 MARKET REVIEW
$ 1,800,000
Median Sales Price
$708.79
Median Price Per Square Foot
107
Total Transactions
31
Median Days on Market


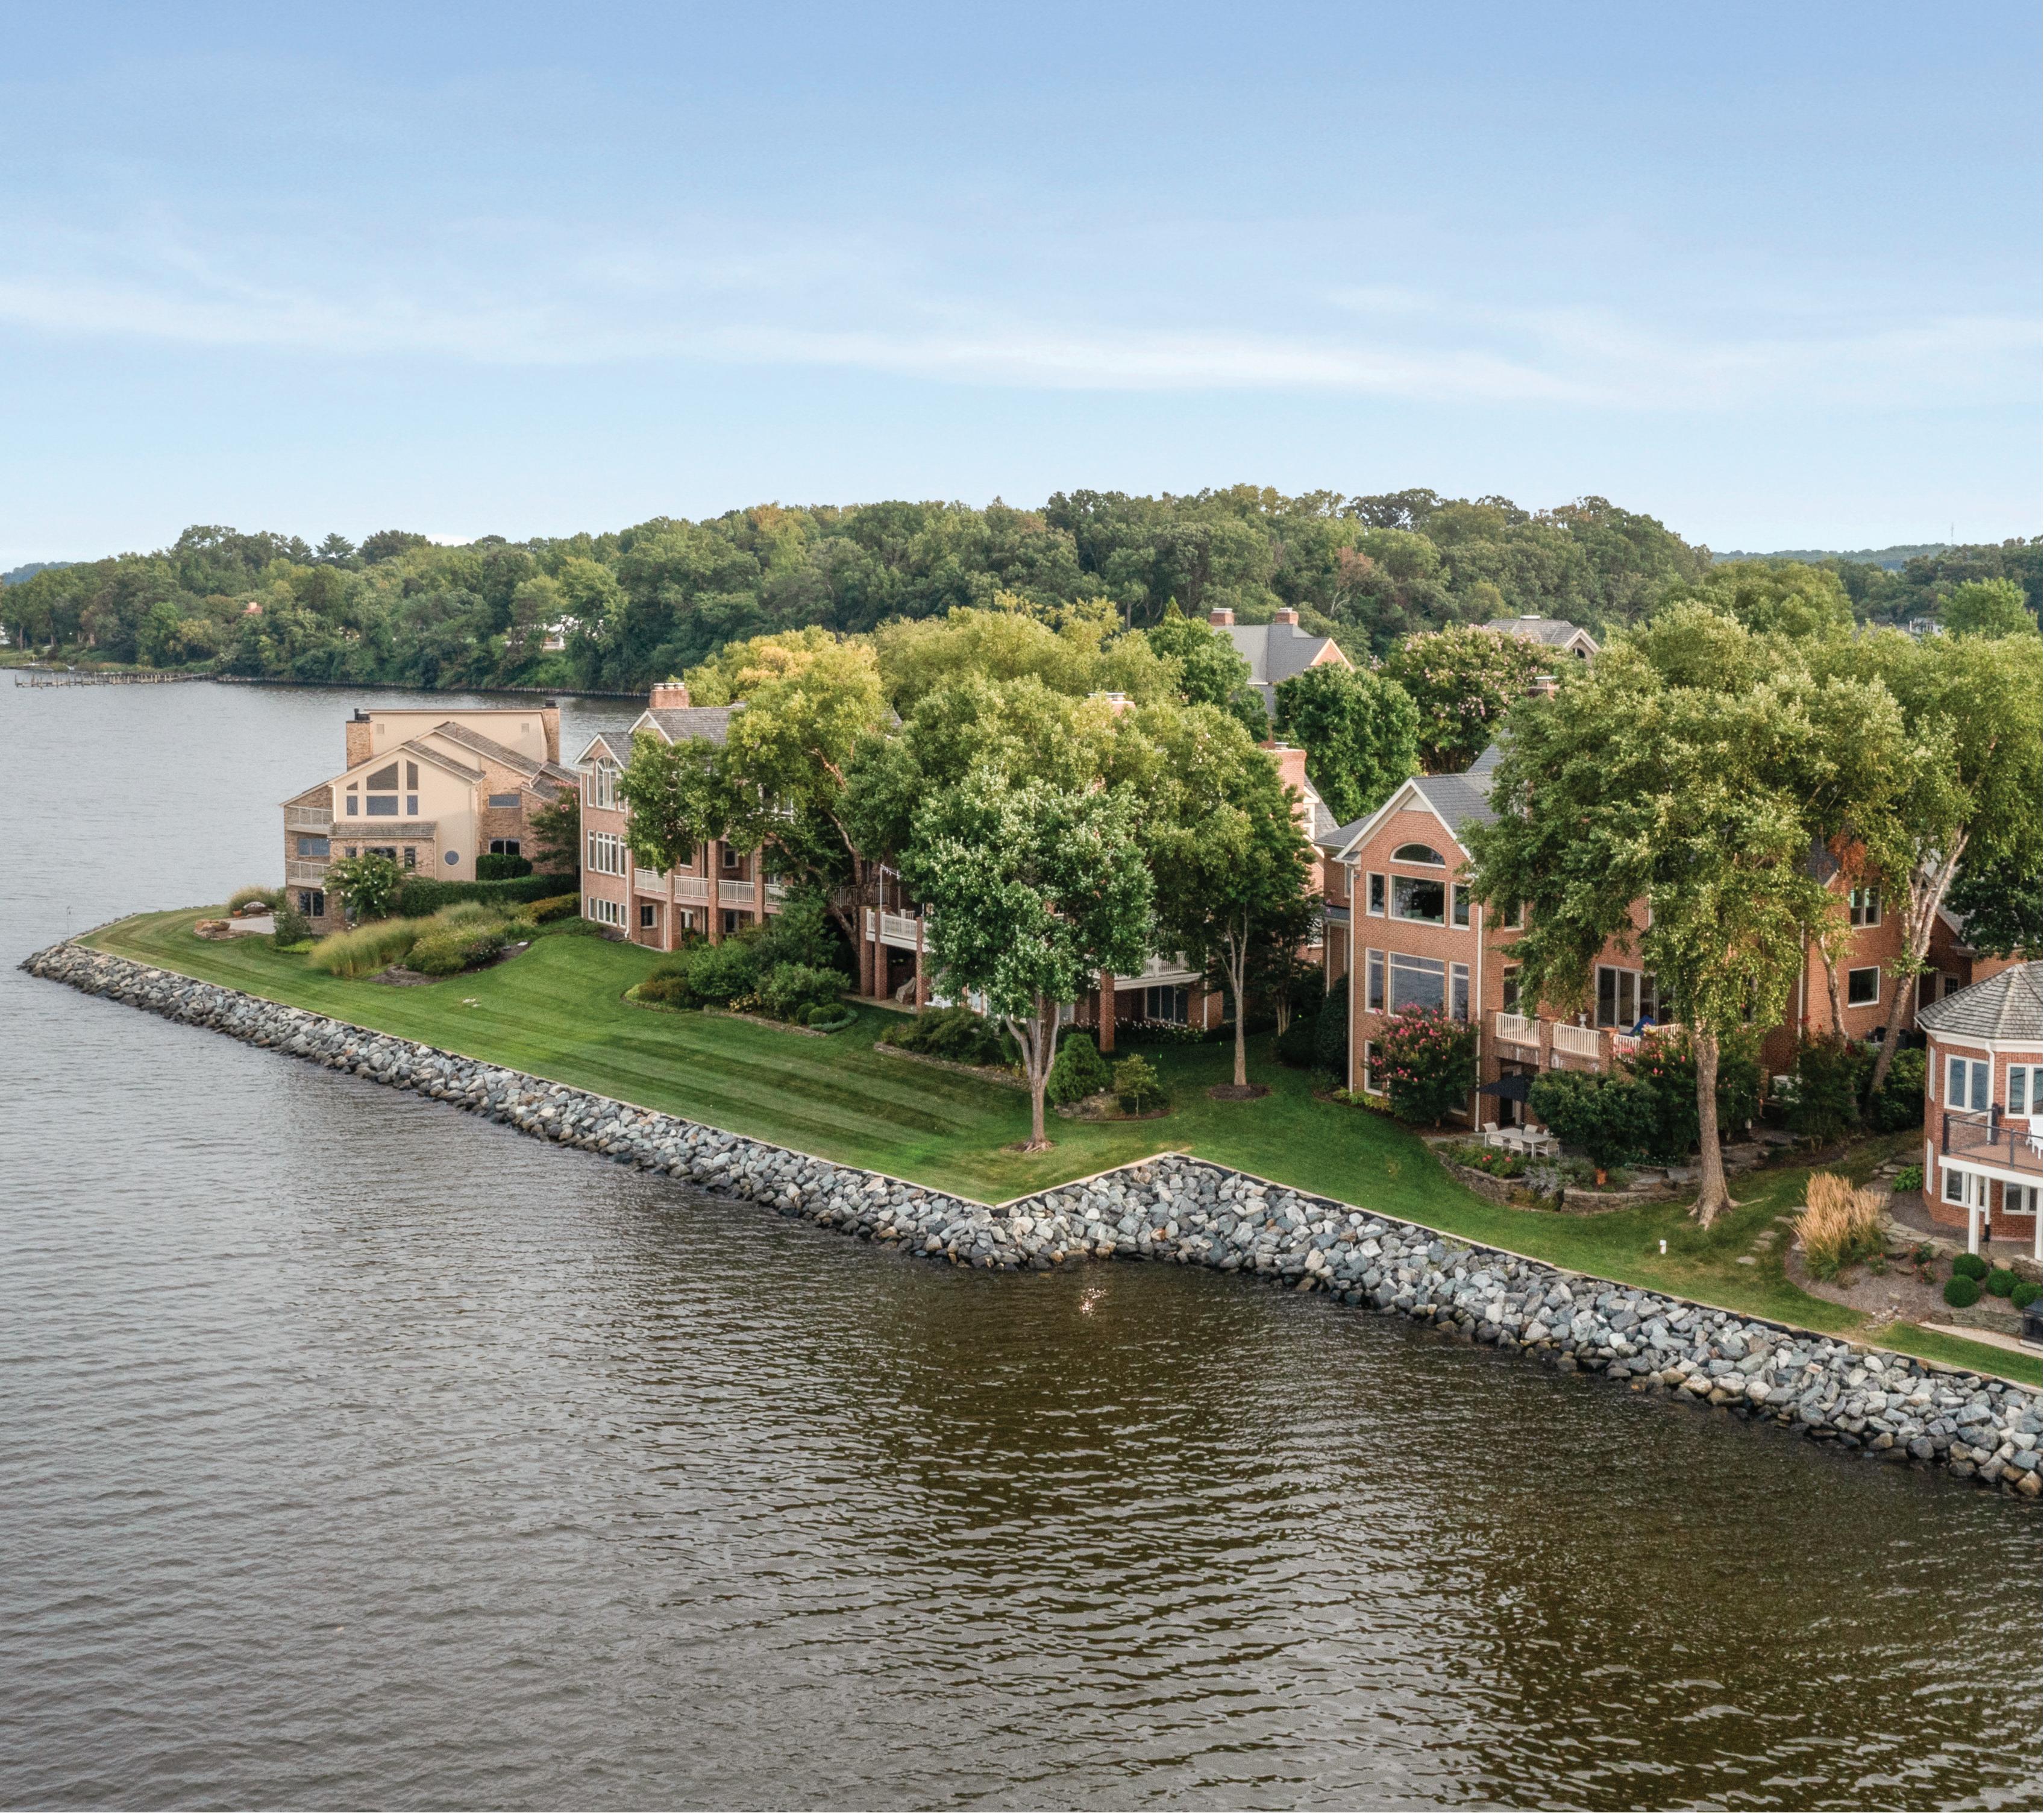
$2,090,000
Median Sales Price
$525.25
Median Price Per Square Foot
47 Total Transactions
49
Median Days on Market

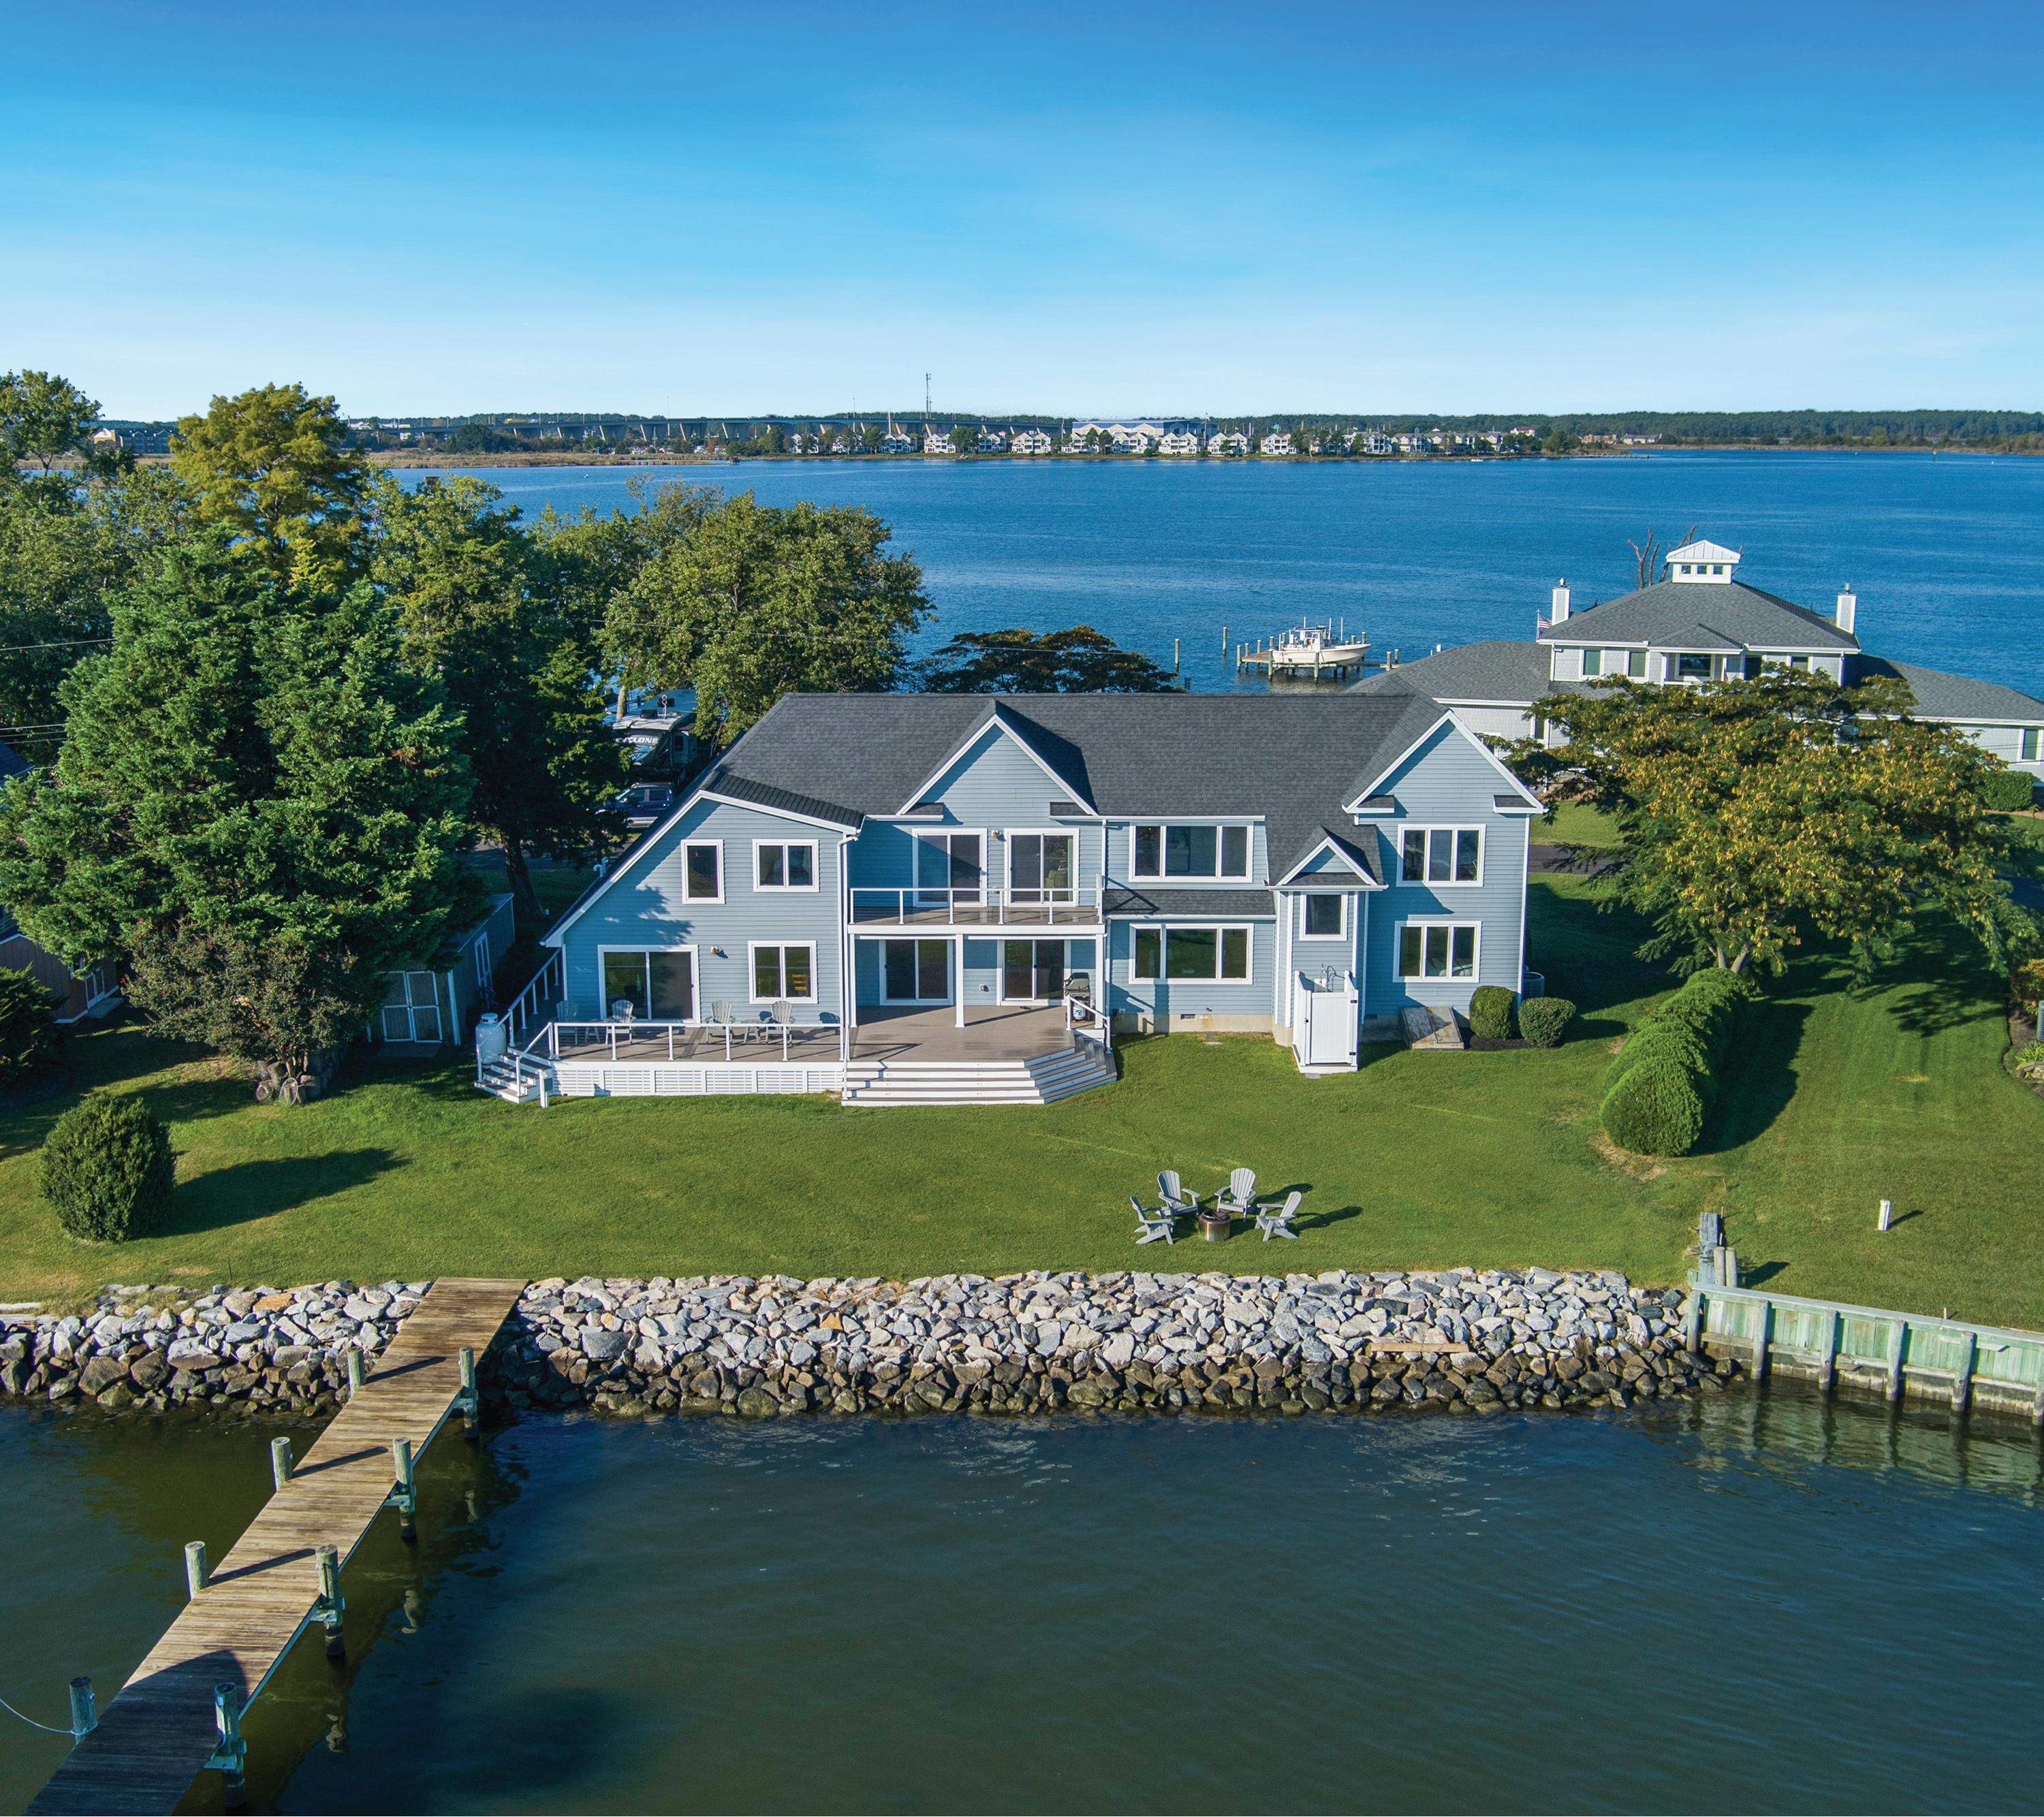
205
$1,833,000
Median Sales Price
$613.33
Median Price Per Square Foot
19
Total Transactions
10
Median Days on Market
explore our prope rties