
Wildfire Vulnerability in Los Angeles

Page 1


Mapping Wildfire Vulnerability in Los Angeles County by integrating Socio-Economic, Health and Built Environment Objectives.

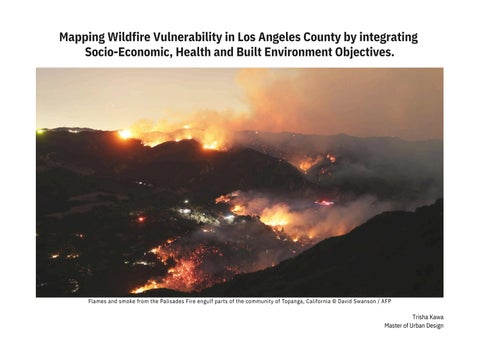
Flames and smoke from the Palisades Fire engulf parts of the community of Topanga, California © David Swanson / AFP

Historical Wildfire Conditions in California and Los Angeles

From 2017 to 2021, California experienced 5 of the 6 largest wildfires in its recorded history (WRI, 2025).

Between 2017–2022, wildfires in California caused over $80 billion in damages, disproportionately impacting vulnerable communities.

2025 Wildfire Impacts in California and Los Angeles

2025 Wildfire Incidents Archived - California

2025 Wildfire Incidents Archived - Los Angeles County

2025 Fire Patterns and Evacuations in Los Angeles

Over 50,000+ residents faced evacuation orders across impacted zones.

Observation: Areas under frequent evacuation warnings align closely with past fire perimeters highlighting repeated exposure risks.

Palisades Fire
Eaton Fire

Wildfire Impact is Not Just About Where It Burns

— It's About Who Is Affected and how well they can cope and recover.

Traditional fire maps focus on landscape risk (vegetation, slopes, or climate factors) — this study focuses on human vulnerability.

Limited financial resources and transportation barriers reduce a community’s ability to evacuate, prepare, and recover from wildfires.

Existing health conditions, such as asthma, disability, and lack of insurance, increase the risk of severe outcomes during and after wildfire events.

Older housing, longer distances to emergency services, and proximity to flammable forests amplify the physical risks posed by wildfires.

Purpose of the Study

Understand wildfire vulnerability by integrating social, health, and infrastructure factors — not just environmental risks.

Identify communities and zones that are most at risk based on their ability to prepare for, respond to, and recover from wildfires.

Support more targeted emergency response, evacuation planning, and resource allocation focused on human needs.

Promote fair and equitable disaster planning by recognizing areas with fewer resources and higher recovery challenges.

Methodology Overview

Data Collection

Indicator Scoring (1–5 for each factor)

Sum Scores within Each Category

Create Individual Vulnerability Maps

Sum All 12 Indicators (Composite Score: 12–60)

Generate Final Vulnerability Map overlayed with historical Fire Perimeters

Result Interpretation and Risk Zone Identification

Vulnerability Ranking Method

Ranking census tracts from least to most vulnerable across key factors.

Each factor was assigned a score

After collecting the data for each factor,

Each tract gets a score based on individual factors. Sum of Scores of 12 factors

Socio - Economic Objective

Socio-economic factors were mapped to identify communities that may face greater challenges during wildfire events. Four factors were selected to capture key social vulnerabilities:

Median Household Income

Population Below Poverty Level

Older Adults Living Alone

Households Without Vehicle Access

Census tracts were scored from 1 (low vulnerability) to 5 (high vulnerability) for each factor.

Final socio-economic vulnerability scores were calculated by summing the four factor scores for each tract.

Socio-Economic - Median Household Income Map

Socio-Economic - Population below Poverty Level Map

Socio-Economic - Older Adults Living Alone Map

Socio-Economic - Household without Vehicle Access Map

Households without Vehicle Access

Socio-Economic Vulnerability Map

High vulnerability is concentrated in South LA, central urban neighborhoods, and parts of the Antelope Valley, where economic and transportation barriers may delay evacuation and recovery.

Health Objective

Health factors were mapped to identify communities where pre-existing health challenges may increase risk during wildfire events. Four factors were selected to capture key health vulnerabilities:

Population with a Disability

Emergency Visits for Asthma

Emergency Visits for Heart Attacks

Population with No Health Insurance

Census tracts were scored from 1 (low vulnerability) to 5 (high vulnerability) for each factor.

Final health vulnerability scores were calculated by summing the four factor scores for each tract.

Health - Population with a Disability

Health - Emergency Visits for Asthma

Health - Emergency Visits for Heart Attack

Health - Population without Health Insurance

Health Vulnerability Map

High vulnerability clusters appear in South LA, Central LA, and parts of the northern valley, where multiple health stressors overlap.

Built Environment Objective

Built environment factors were mapped to identify areas where physical infrastructure and emergency access conditions could increase wildfire vulnerability. Four factors were selected to capture key built environment vulnerabilities:

Median Year Structure Built

Fire Stations

911 Emergency Hospitals

Forests / Green Space

Census tracts were scored from 1 (low vulnerability) to 5 (high vulnerability) for each factor.

Final built environment vulnerability scores were calculated by summing the four factor scores for each tract.

Built Environment - Median Year Structure Built

Built Environment - Mapping Fire Station Accessibility

Fire station locations across Los Angeles County were mapped.

Drive-time travel zones were created by considering time intervals that reflect critical emergency response

windows, where faster access is essential during wildfire events.

5 minutes

10 minutes

15 minutes

20 minutes

>20 minutes

Lighter buffer zones represent lower risk (closer proximity)

Darker zones represent higher risk (farther proximity)

Built Environment - Fire Station Proximity

Scoring Method by Census Tract

Built Environment - Fire Station Accessibility by Census Tract

Built Environment - Mapping 911 Emergency

Hospital Accessibility

911 emergency hospital locations across Los Angeles County were mapped.

Drive-time travel zones were created by considering time intervals that reflect critical access needs for emergency

medical care during wildfire events:

10 minutes

20 minutes

30 minutes

40 minutes

>40 minutes

Lighter buffer zones represent lower risk (closer proximity)

Darker zones represent higher risk (farther proximity)

Scoring Method by Census Tract

Built Environment - 911 Emergency Hospital Accessibility by Census Tract

Built Environment -

Mapping Forest Proximity & Fire Risk Zones

Medium Forests (100–1,000 acres) and Large Forests (>1,000 acres) were identified as high wildfire ignition zones.

A fire spread speed of 10 miles per hour was used to simulate wildfire movement over time. Buffer zones were created at five distances from forests:

2.5 miles / 15 min

3.33 miles / 20 min

4.17 miles / 25 min

5 miles / 30 min

10 miles / 1 hour

Lighter buffer zones represent higher risk (closer to forest)

Darker zones represent lower risk (farther away)

Built Environment - Forest Proximity & Fire Risk Zones

2.5/15min --> 5 point

3.33/20min --> 4 point

4.17/25min --> 3 point

5/30min --> 2 point

10/1hr --> 1 point

Scoring Method by Census Tract

Built Environment - Forest Proximity and Fire Risk Zones by Census Tract

Built Environment Vulnerability Map

High built environment vulnerability is observed in hillside communities, eastern Los Angeles, and parts of the northern valleys, where aging structures, reduced emergency access, and forest proximity overlap.

Since there are

3 Objectives (Socio-Economic, Health & Built Environment)

4 Factors x = 12 factors

Each census tract has a score between 1 . . . . 5 for each factor.

Sum of scores of all the factors will be between

Lower Scores = Lower Vulnerabilty Higher Scores = Higher Vulnerabilty

Los Angeles Wildfire Vulnerability Index Map

Areas with the highest wildfire vulnerability scores are concentrated in South Los Angeles, Central Los Angeles, and parts of the northern valley regions.

Selection of Tracts for Detailed Analysis

Tracts scoring highest, 48 were selected as representative of the most vulnerable zones.

Tract A: A single, isolated census tract located in the northern part of the county, situated close to a historical wildfire perimeter.

Tract B: A cluster of eight adjacent census tracts located in the southern part of Los Angeles County, an area characterized by dense urbanization and historically underserved communities.

Final Observations Comparative Vulnerability Profile: Tract A vs. Tract B

Tract A (106020)

Northern edge of LA County, near forests and past fires

Physical/environmental exposure (close to wildfire zones)

Older structures, long fire/hospital response time

Medium (not extreme poverty)

Moderate health vulnerability

Isolated single tract

Environmental/infrastructure-driven

Tract B (Cluster)

Urban core in South Central Los Angeles

Social and health vulnerabilities

Dense urban environment, better emergency access

Very high poverty, low income, social isolation

High health vulnerability (asthma, heart attacks, uninsured)

Cluster of urban tracts

Social/health-driven

Implications for Policy and Planning

This wildfire vulnerability map can help leaders decide which areas need wildfire protection programs first, like home upgrades, vegetation clearing, and community education.

Emergency managers can use the map to send help and resources to vulnerable areas before disasters happen, not just after.

The results show that some communities are far from fire stations and hospitals, meaning they could face longer emergency response times. Fixing these gaps may involve building new emergency facilities, improving roads, or setting up mobile response teams.

Health and social challenges — like no insurance, disability, and dependence on public transit — show why wildfire planning must include public health, housing, and social service agencies.

To protect communities better, wildfire planning must move from reacting after fires to preparing ahead of time by using this data to shape land use, zoning, and climate plans.

Study Limitations

The study relies on static datasets (census information, facility locations) that may not capture real-time population changes, seasonal dynamics, or rapid urban development.

Equal weighting was applied across all variables, which may not fully reflect the critical importance of factors. The analysis does not incorporate dynamic fire behavior modeling (e.g., wind direction, temperature, live fuel moisture), which are essential for real-time wildfire spread understanding.

Despite these constraints, the study offers a scalable framework that future research can enhance by integrating realtime datasets, customized variable weighting, and advanced remote sensing–based fire simulations.

Conclusion

By integrating socio-economic, health, and built environment factors into a composite index, this study identifies communities most at risk — not only from wildfire exposure but from systemic resource gaps.

Findings show that wildfire vulnerability is structural, spatial, and social, extending beyond environmental hazards alone.

Vulnerable communities often lack access to the resources, infrastructure, and information needed to prepare for and recover from wildfires. As climate change worsens fire seasons, this research contributes to a more equitable, forward-looking approach to wildfire preparedness — centered on those most at risk.

Thank You

Turn static files into dynamic content formats.

Create a flipbook
Wildfire Vulnerability in Los Angeles by Trisha Amrish Kawa - Issuu