Trinity@Home Analytics: March 2020 – October 2021 Trinity Episcopal Church, Toledo Trinity@Home Online Service Analytics – 20 months Total Number of Trinity@Home Services
Trinity@Home Sunday Services
Trinity@Home Special Services (memorials, etc.)
Trinity@Home Holy Week Services
87
77
4
6
Trinity@Home Worship Views Stats TOTAL Peak Views (households viewing at the time of premiere)
4,940
TOTAL Views to Date
15,716
Average Sunday Peak Household Views Average Additional Household Views the Following Week
Trinity@Home Worship Participants Reader/Prayer Voices Vocalists/Musicians
139 64
Preachers
13
Technology
5
31
137
Soundcloud – online
library where weekly sermons and service music are available for online streaming Total Sermon Plays
4,306
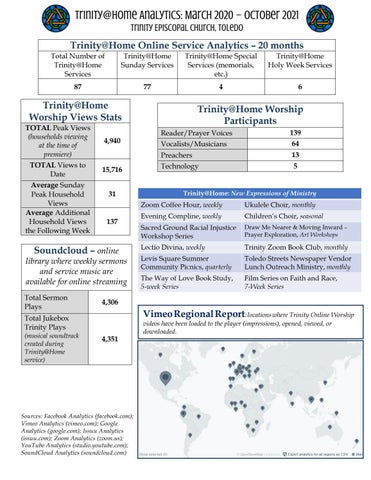
Vimeo Regional Report: locations where Trinity Online Worship
Total Jukebox Trinity Plays
(musical soundtrack created during Trinity@Home service)
4,351
Sources: Facebook Analytics (facebook.com); Vimeo Analytics (vimeo.com); Google Analytics (google.com); Issuu Analytics (issuu.com); Zoom Analytics (zoom.us); YouTube Analytics (studio.youtube.com); SoundCloud Analytics (soundcloud.com)
videos have been loaded to the player (impressions), opened, viewed, or downloaded.