Quad Cities
Latah • Whitman • Nez Perce • Asotin Market Report
Today’s Real Estate Market in the Quad Cities Region
Q1–2026 Market Summary
2025 is now in the books and a slow market has continued through it. Multiple factors contributed to a continued softening market including high interest rates, limited inventory, and recession fears.
In Latah County, closed transactions were notably up 7.0% from this same last year, with new listings down by 23.6% compared to Q1 2025. In this same time frame, the median sales price showed a increase by 13.7% to $477,500, with average sales price also increasing by 14.4% to $507,888.
The Whitman County market showed a decrease in the amount of new listings in comparison to Q1 2025, with 177 properties listed in the quarter. This was a decrease of 5.9% from last year, but a 16.4% increase from last quarter. Home sale prices have shown a decreasing trend over the past year, lowering by 3.8% from Q1 2025 to a median home sale price of $389,750.
The Nez Perce County market saw a notable increase in the amount closed sales, along with an increase in new listings in relation to the previous year, with closed sales up at 20.4% with 95 properties sold in Q1 of 2025. The amount of new listings is up 8.4% from this same time last year. The median home sale price also slightly increased by 1.0% to $389,000. The median days on market decreased to 30 days, compared to 35 days in previous year.
The market west of the state line in Asotin County market saw a slight decrease in closed sales, lowering 7.8% from last year with 47 closed sales. There was also a strong increase in active listings, with 73 active listings at the time of this report, a 19.7% increase from last year.
Despite the varied performance across different regions, there are indications of increased activity continuing through 2026, accompanied by a surge in buyer inquiries. As we navigate into the new year we’ll continue to keep a close eye on interest rates along with inventory levels as the peak selling seasons end and we go into the 2026 market.
Debbie Lawrence Designated Broker / Regional Manager
Latah County
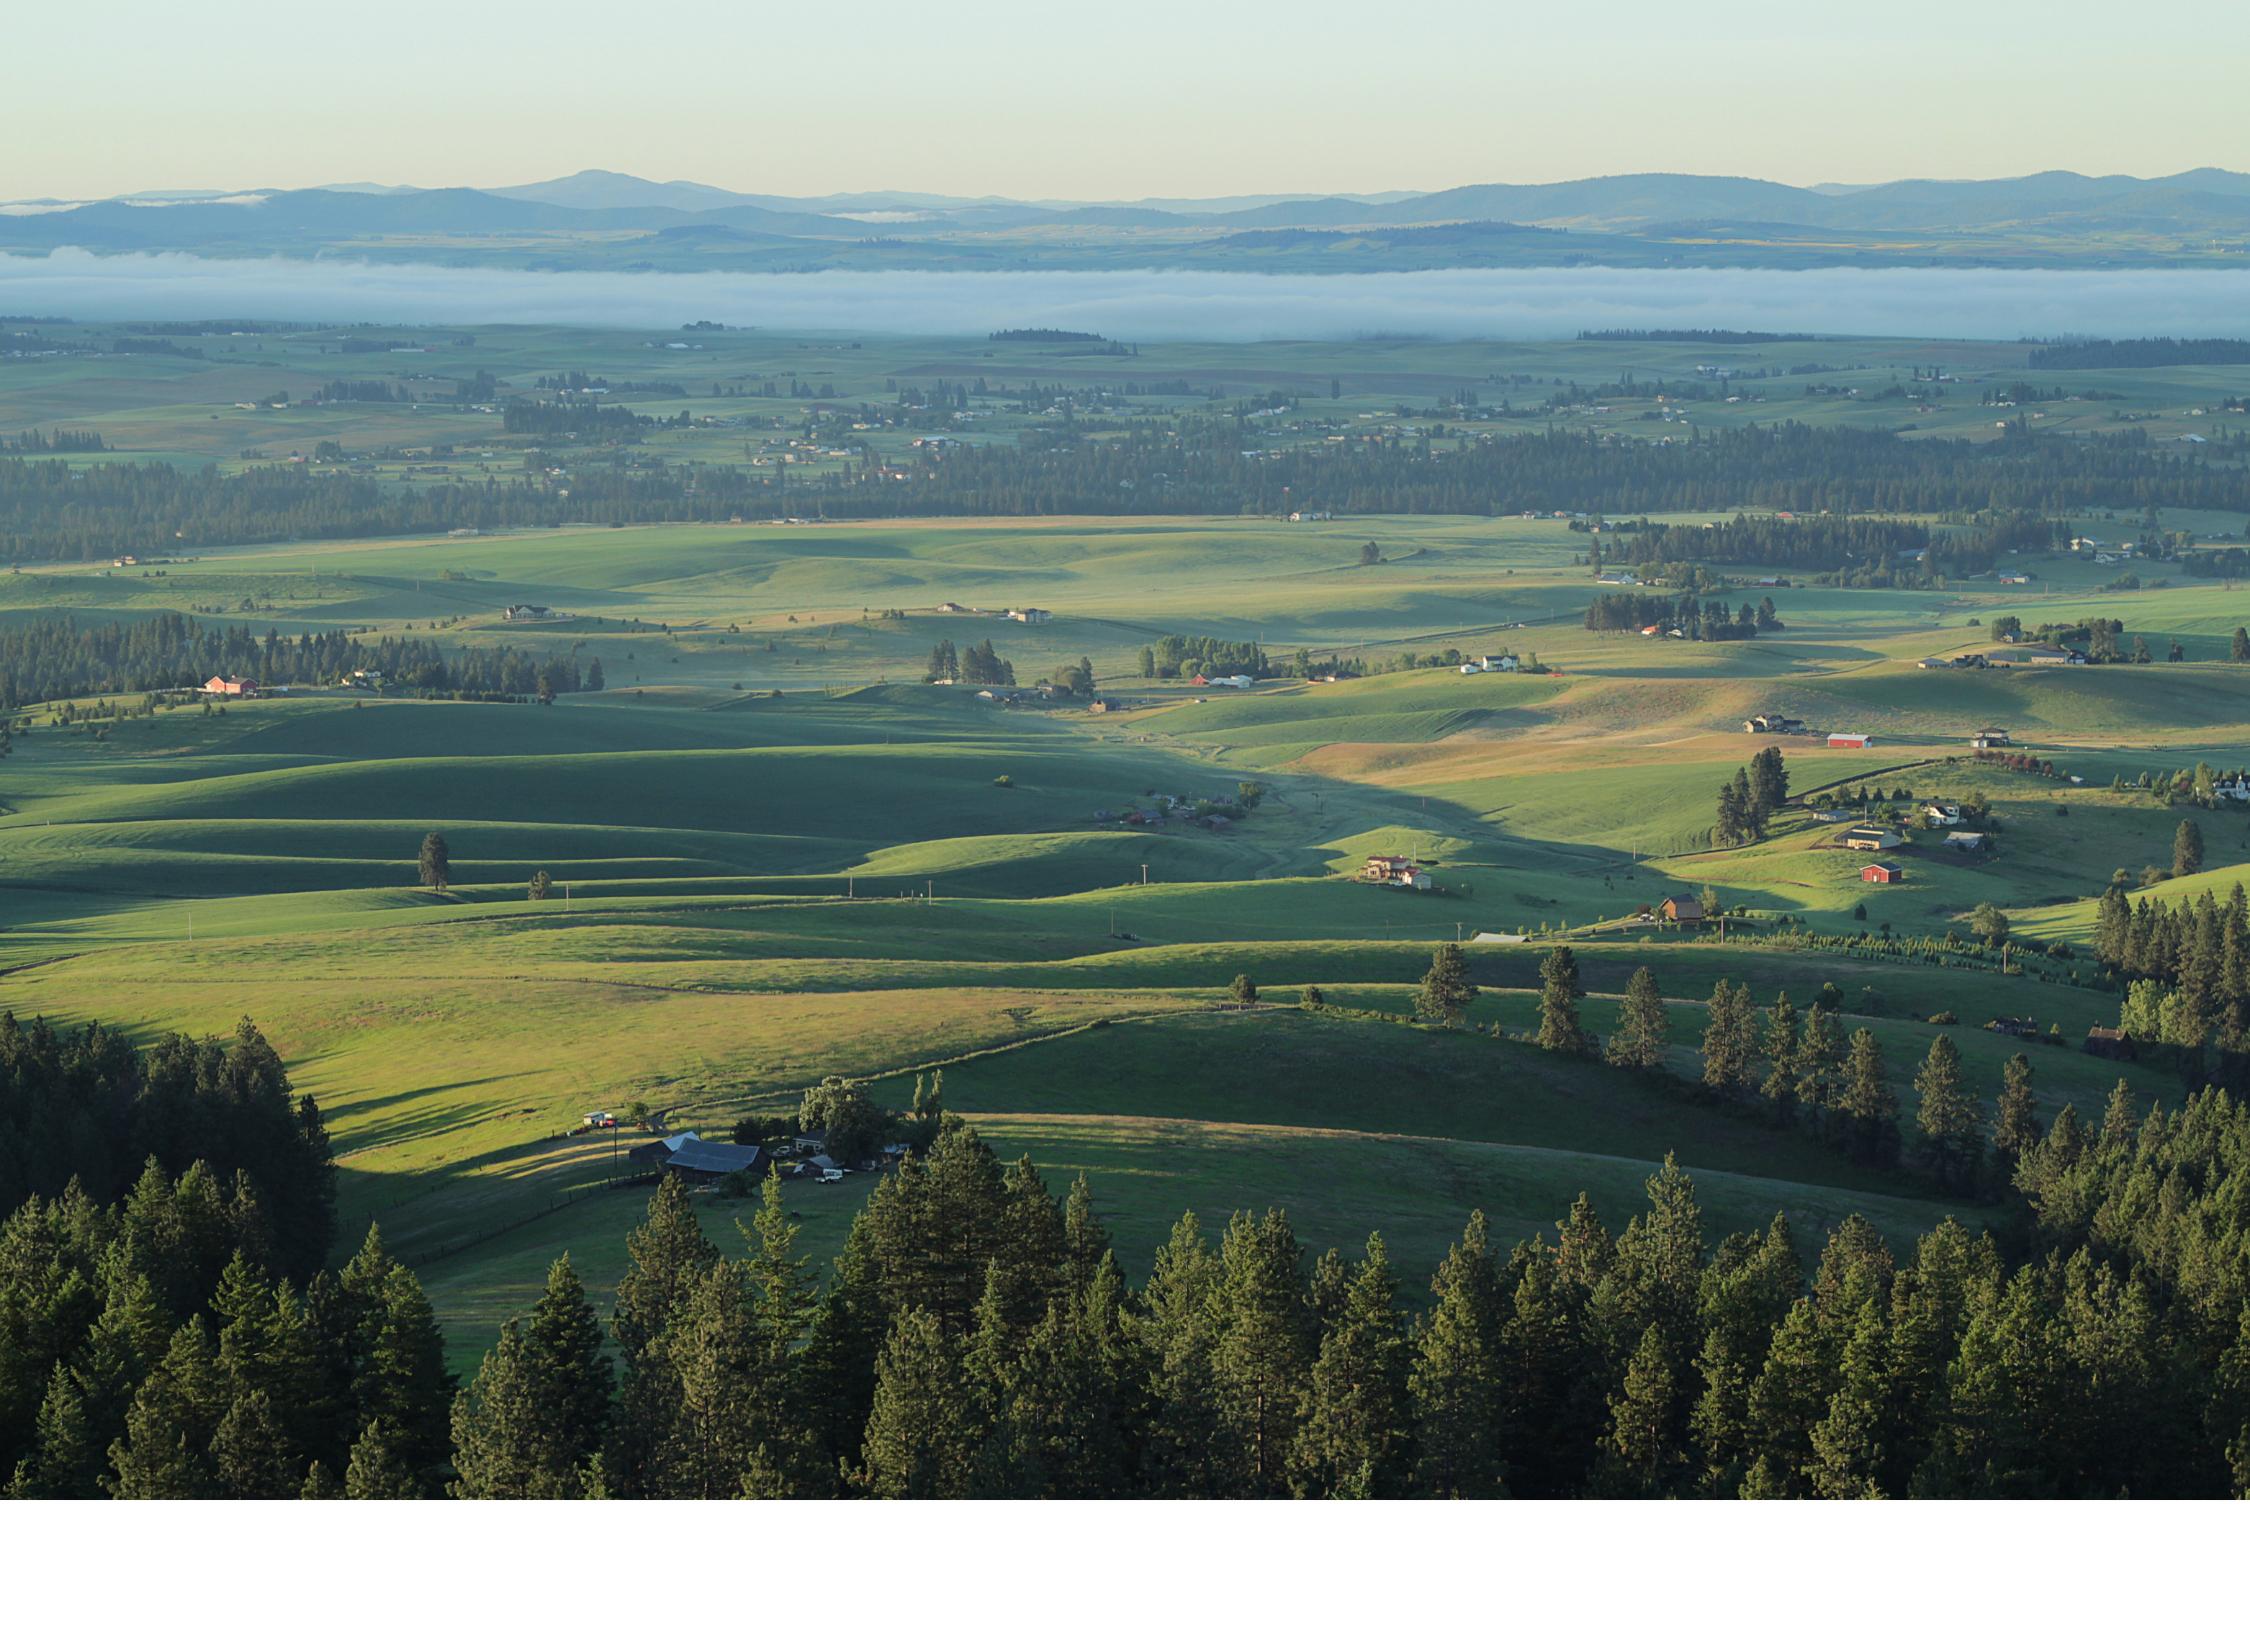
What’s in the Latah County Data?
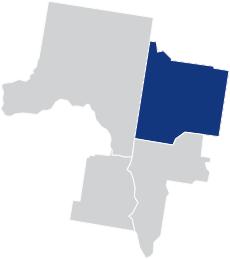
In Quarter 1 2026, Latah County median home prices were up 13.7% compared to last year and up 11.3% compared to last quarter, selling for a median price of $477,500. There were 46 homes sold in Q1 2026 this year, up from 43 at this same time last year.
On median, homes in Latah County sell after 21 days on the market, down 44.7% from this same time last year. There were 81 new listings to go live last quarter and there are a total of 37 active listings at the time of this report.
Q1 2026 Market data
Latah County
Closed Sales
As of 04/01/2026. By quarter dating from Q1 2021 to Q1 2026. Closed Sales is the number of properties sold.
Closed Sales By Price Range
As of 04/01/2026. Year-over-year comparison for Q1 2025 and Q1 2026. Closed Sales By Price Range is the number and percentage of properties sold in different price ranges.
Average and Median Sales Price
As of 04/01/2026. By quarter dating from Q1 2021 to Q1 2026. Median Sales Price is the mid-point (median) value where the price for half of the closed sales is higher and half is lower. Average Sales Price is the sum of the sold dollar volume divided by the number of units sold.
Median Days on Market
As of 04/01/2026. By
2026.
New Listings
As of 04/01/2026. By quarter dating from Q1 2021 to Q1 2026. New Listings is the number of properties listed regardless of current status.
Sale-to-List Price Ratio
As of 04/01/2026. By quarter dating from Q1 2021 to Q1 2026. Sale-to-List Price Ratio is the average of sales price
by the final list
a
Supply and Demand
As of 04/01/2026. Year-over-year comparison of Closed Sales and Active Inventory for Q1 2026 and Q1 2025.
$0-$199,999
$200,000-$249,999
$250,000-$299,999
$300,000-$399,999
$400,000-$499,999
$500,000+
Whitman County
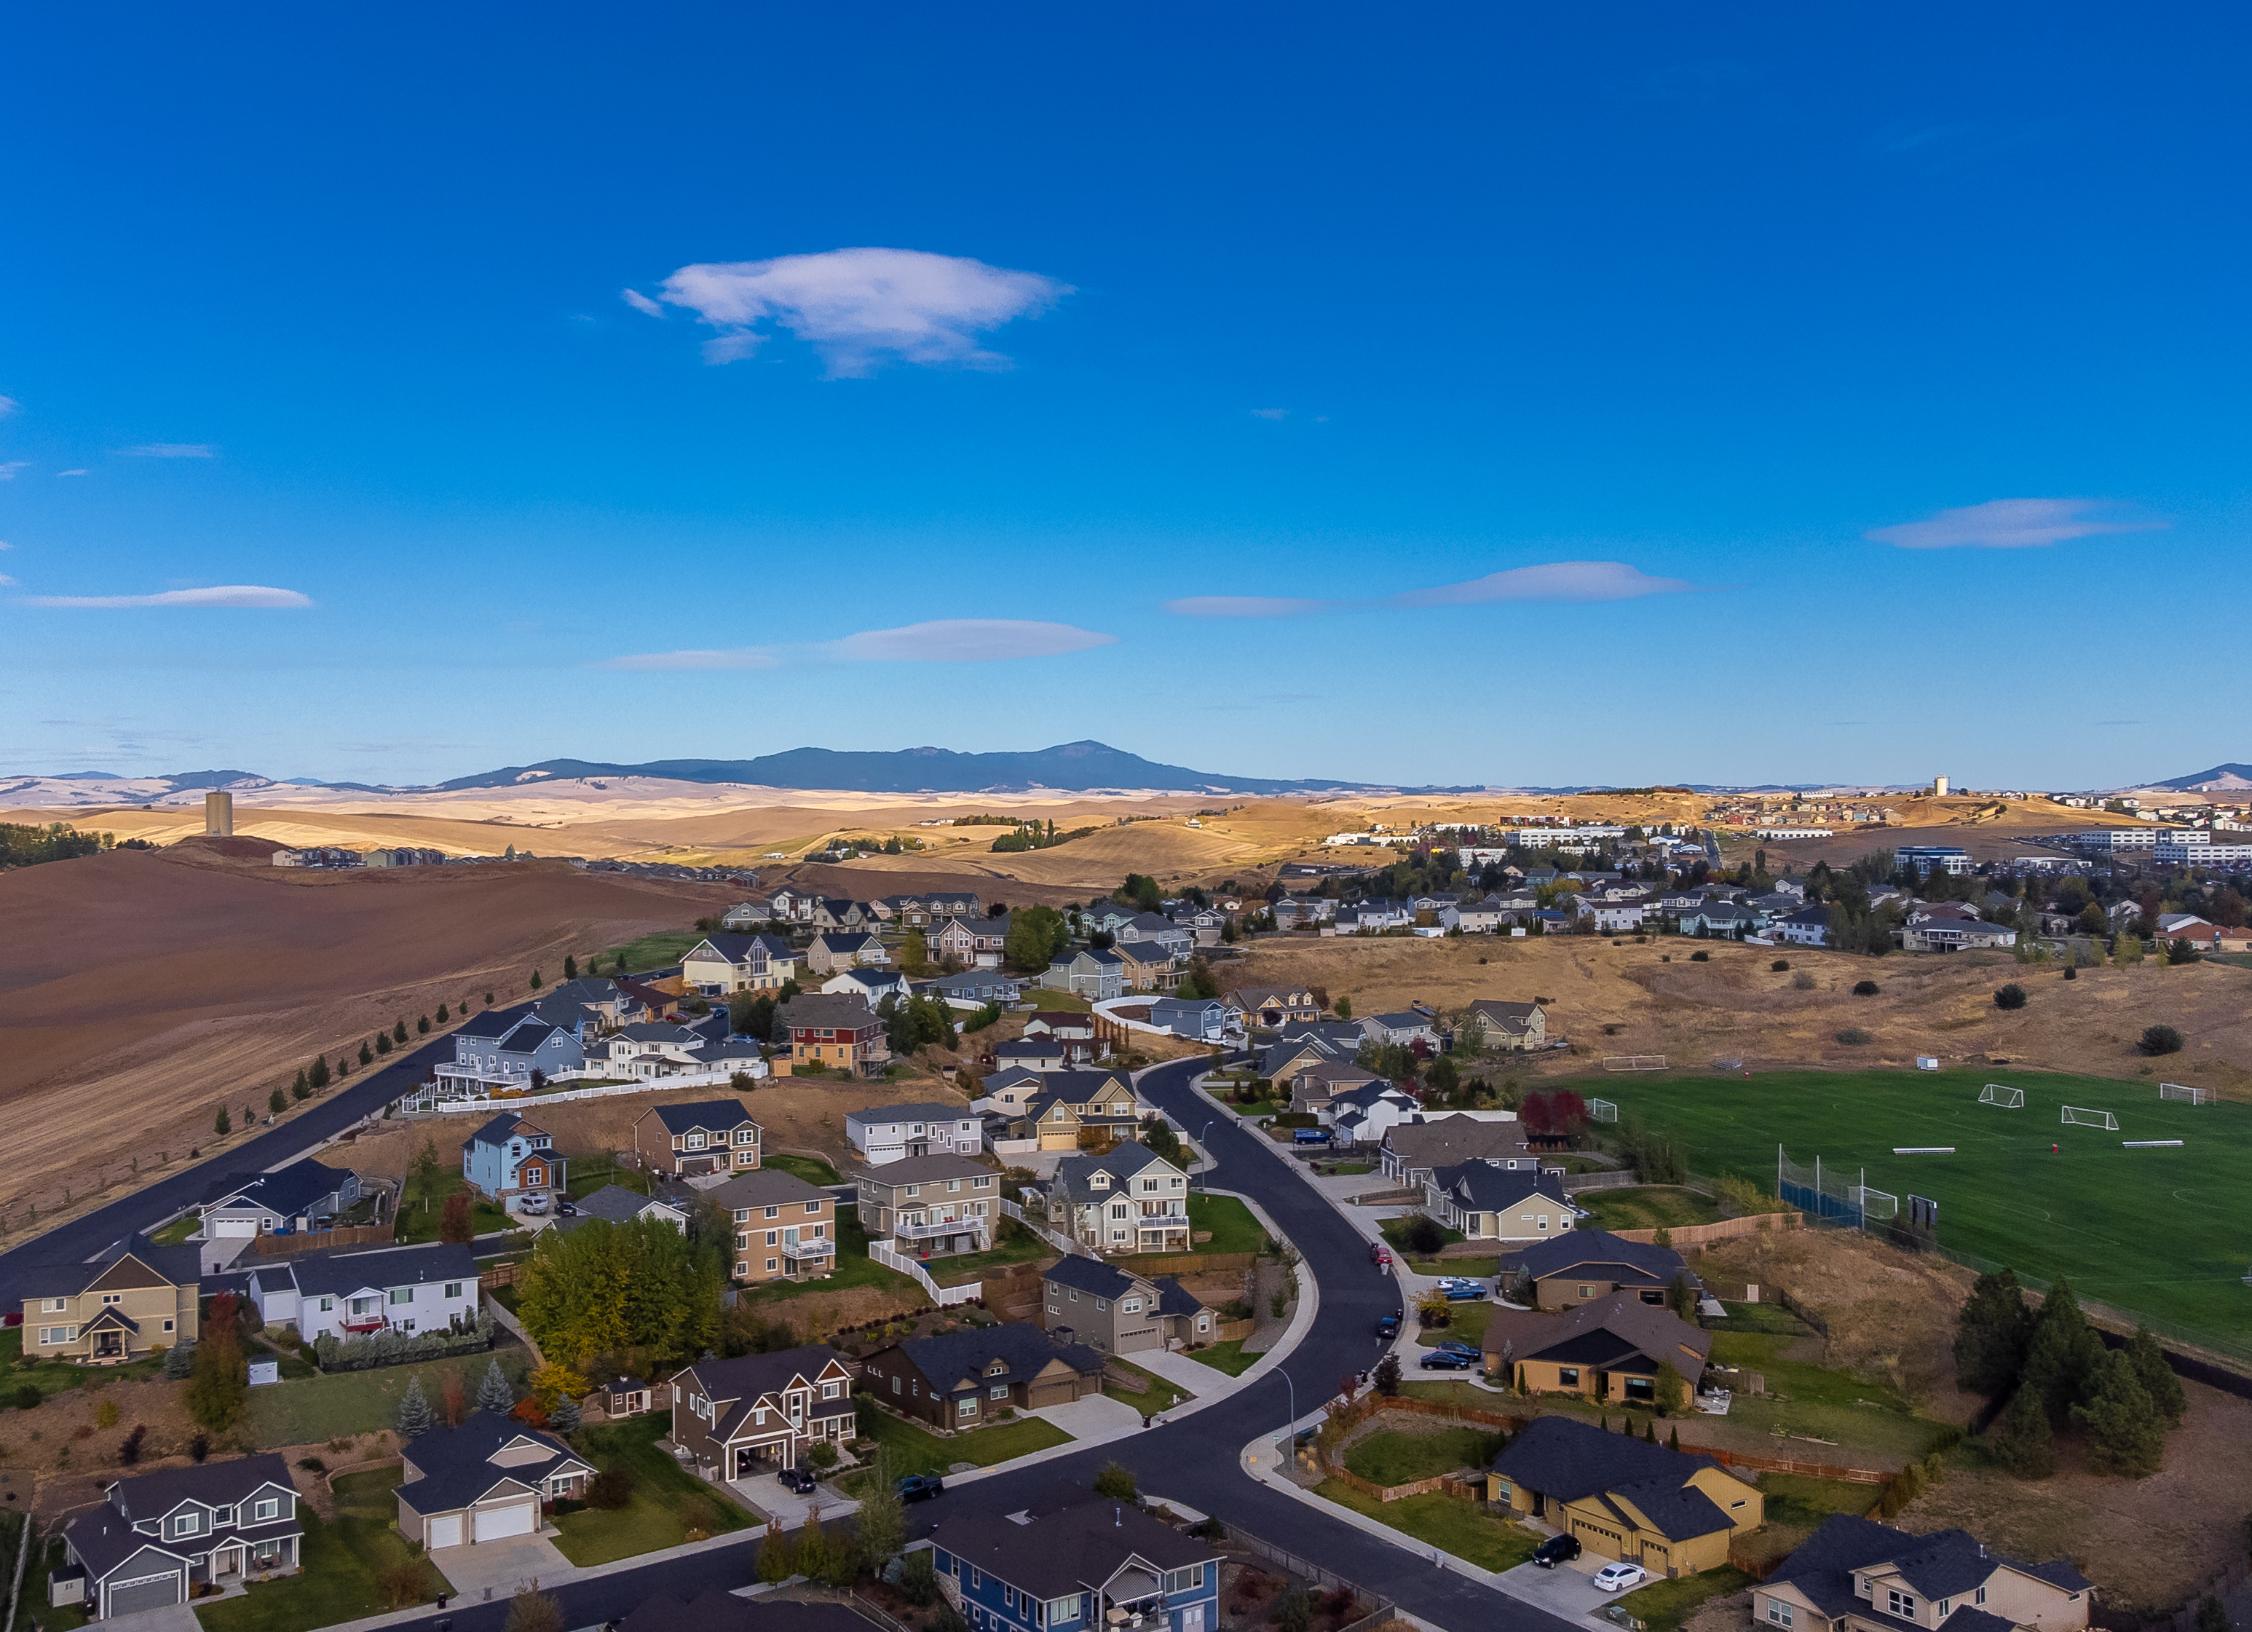
What’s in the Whitman County Data?
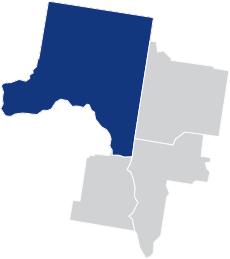
In Quarter 1 2026, Whitman County median home prices were down 3.8% compared to last year and up 0.2% compared to last quarter, selling for a median price of $389,750. There were 70 homes sold in Q1 2026 this year, down from 93 at this same time last year.
On median, homes in Whitman County sell after 43 days on the market, down 42.7% from this same time last year. There were 177 new listings to go live last quarter and there are a total of 91 active listings at the time of this report.
Q1 2026 Market data
Whitman County
Closed Sales
As of 04/01/2026. By quarter dating from Q1 2021 to Q1 2026. Closed Sales is the number of properties sold.
Closed Sales By Price Range
As of 04/01/2026. Year-over-year comparison for Q1 2025 and Q1 2026. Closed Sales By Price Range is the number and
Average and Median Sales Price
As of 04/01/2026. By quarter dating from Q1 2021 to Q1 2026. Median Sales Price is the mid-point (median) value where the price for half of the closed sales is higher and half is lower. Average Sales Price is the sum of the sold dollar volume divided by the number of units sold.
Median Days on Market
As of 04/01/2026. By quarter dating from Q1 2021 to Q1 2026.
days between when a
is listed and the contract date.
New Listings
As of 04/01/2026. By quarter dating from Q1 2021 to Q1 2026. New Listings is the number of properties listed regardless of current status.
Sale-to-List Price Ratio
As of 04/01/2026. By quarter dating from Q1 2021 to Q1 2026. Sale-to-List Price Ratio is the average of sales price divided by the
Supply and Demand
As of 04/01/2026. Year-over-year comparison of Closed Sales and Active Inventory for Q1 2026 and Q1 2025.
$0-$199,999
$200,000-$249,999
$250,000-$299,999
$300,000-$399,999
$400,000-$499,999
$500,000+
Nez Perce County

What’s in the Nez Perce County Data?
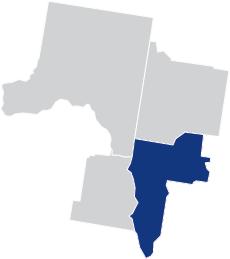
In Quarter 1 2026, Nez Perce County median home prices were up 1.0% compared to last year and up 2.4% compared to last quarter, selling for a median price of $389,000. There were 95 homes sold in Q1 2026 this year, up from 79 at this same time last year.
On median, homes in Nez Perce County sell after 30 days on the market, down 14.3% from this same time last year. There were 142 new listings to go live last quarter and there are a total of 104 active listings at the time of this report.
Q1 2026 Market data
Nez Perce County
At a Glance
Closed Sales
As of 04/01/2026. By quarter dating from Q1 2021 to Q1 2026. Closed Sales is the number of properties sold.
Closed Sales By Price Range
As of 04/01/2026. Year-over-year comparison for Q1 2025 and Q1 2026. Closed Sales By Price Range is the number and
Average and Median Sales Price
As of 04/01/2026. By quarter dating from Q1 2021 to Q1 2026. Median Sales Price is the mid-point (median) value where the price for half of the closed sales is higher and half is lower. Average Sales Price is the sum of the sold dollar volume divided by the number of units sold.
Median Days on Market
As of 04/01/2026. By quarter dating from Q1 2021 to Q1 2026.
is listed and the contract date. $200
days between when a
New Listings
As of 04/01/2026. By quarter dating from Q1 2021 to Q1 2026. New Listings is the number of properties listed regardless of current status.
Sale-to-List Price Ratio
As of 04/01/2026. By quarter dating from Q1 2021 to Q1 2026. Sale-to-List Price Ratio is the
Supply and Demand
As of 04/01/2026. Year-over-year comparison of Closed Sales and Active Inventory for Q1 2026 and Q1 2025.
$0-$199,999
$200,000-$249,999
$250,000-$299,999
$300,000-$399,999
$400,000-$499,999
$500,000+
Asotin County

What’s in the Asotin County Data?
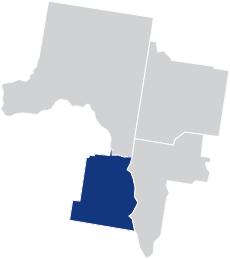
In Quarter 1 2026, Asotin County median home prices were up 3.0% compared to last year and up 0.9% compared to last quarter, selling for a median price of $350,000. There were 47 homes sold in Q1 2026 this year, down from 51 at this same time last year.
On median, homes in Asotin County sell after 74 days on the market, up 34.5% from this same time last year. There were 84 new listings to go live last quarter and there are a total of 73 active listings at the time of this report.
Q1 2026 Market data
Asotin County
$350,000
At a Glance Snapshot overview
Closed Sales
As of 04/01/2026. By quarter dating from Q1 2021 to Q1 2026. Closed Sales is the number of properties sold.
Closed Sales By Price Range
As of 04/01/2026. Year-over-year comparison for Q1 2025 and Q1 2026. Closed Sales By Price Range is the number and percentage of
Average and Median Sales Price
As of 04/01/2026. By quarter dating from Q1 2021 to Q1 2026. Median Sales Price is the mid-point (median) value where the price for half of the closed sales is higher and half is lower. Average Sales Price is the sum of the sold dollar volume divided by the number of units sold.
Median Days on Market
As of 04/01/2026. By quarter dating from Q1 2021 to Q1 2026.
between when a
New Listings
As of 04/01/2026. By quarter dating from Q1 2021 to Q1 2026. New Listings is the number of properties listed regardless of current status.
Sale-to-List Price Ratio
As of 04/01/2026. By quarter dating from Q1 2021 to Q1 2026. Sale-to-List Price Ratio is the average of sales price divided by the final list
a
Supply and Demand
As of 04/01/2026. Year-over-year comparison of Closed Sales and Active Inventory for Q1 2026 and Q1 2025.
$0-$199,999
$200,000-$249,999
$250,000-$299,999
$300,000-$399,999
$400,000-$499,999
$500,000+
Totals
Mortgage Rates
30-year fixed mortgage rates dating from January 2021 to the week ending Thursday, March 26, 2026.