

The 2025 view of an oil-glut in 2026 has reversed; after an April spike above $120, Brent Crude is back near $100 and National Balancing Point gas, the UK wholesale benchmark, near 150p/therm, - at conflict-peak levels.
Ofgem’s 13% cap rise on 1 July turns domestic energy from a drag on inflation into a contributor from Q3 2026; the new electricity VAT cut softens that shift slightly.
The MPC held interest rates at 3.75% on 18 June; no cut now looks likely in 2026, and a rate hold into 2027 raises the cost of every low-carbon project.
The North Sea decline is now capital-led – no exploration wells in 2025, capex set to fall to £9.19bn by 2031 – so the risk sits in the service chain.
Refining and fuel distribution are the notable exposures: four refineries remain, around £400m of annual UK ETS cost, and a ~50p/litre diesel increase on unchanged facilities.
Most energy credit risk sits outside the energy sector – in particular, manufacturers absorbing a ~45% rise in wholesale power costs they cannot pass on.
Andy Burnham became Prime Minister on 20 July; his early moves – an electricity VAT cut, North Sea approvals and water reform –reopen energy policies that looked settled.

The November 2025 edition was written around a glut – oil sliding toward a forecast $52, European gas expected to fall further. The 28 February Middle East conflict escalation reversed that. The sector now faces a scarcity premium, and the damage falls mostly outside it, on the counterparties that buy energy –an exposure a cheaper barrel would not remove.
The UK entered 2026 with momentum and has spent the year losing its composition rather than its growth. Quarterly GDP grew an unrevised 0.6% in Q11, among the firmer G7 readings, and output rose 0.7% in the three months to May, a sixth consecutive three-month gain. But the mix is turning, output fell 0.1% in April, the first contraction since October 2025, and recovered only 0.1% in May. That rebound was services alone (+0.3%); production fell 0.5% and construction 0.8%. Growth is carried by services while the energy-intensive, ratesensitive side of the economy contracts.
1 https://www.ons.gov.uk/economy/grossdomesticproductgdp/bulletins/quarterlynationalaccounts/januarytomarch2026

CPI eased to 2.6% in the year to June, the lowest since March 2025, but the fall is less benign than it looks. It was led by motor fuels, with diesel down 10.7p a litre, while household gas and electricity were still held by the Ofgem cap. The sequencing is the point – domestic energy has held down the headline rate, but from Q3 it pushes the rate up, on a lag, just as discretionary income tightens. Ofgem raised the cap 13% from 1 July, to £1,663 a year for a typical direct-debit household2 – gas up 24%, electricity up 5%. Cornwall Insight forecasts the October cap, due by 26 August, at about £1,700, some 2% higher again even after the VAT cut. Removing VAT on electricity from 1 October (5% to zero, for six months) takes roughly 0.1 point off CPI.
For business the picture is sharper. National Balancing Point (NBP) gas, the UK wholesale benchmark, is near 150p/therm –back at the peak of the conflict, and up more than half in a month. No relief measure reaches it – the industrial-electricity schemes and the domestic price cap both act on the retail bill, not the wholesale price.
Source: ONS, Bank of England
Note: CPI excl. energy, food, alcohol and tobacco = “Core CPI”
The MPC held Bank Rate at 3.75% on 18 June 3 for a fourth consecutive meeting, but the vote moved to 7-2, with Megan Greene joining Chief Economist Huw Pill in voting for 4.0%. The next decision carries a fresh Monetary Policy Report; softer wage data gives the majority reason to hold, but the hawkish split and the Bank’s judgement that energy-price risks are skewed to the upside keep a cut off the table this year. That matters because energy is the most capital-intensive part of the economy. Rates held at 3.75% into 2027 raise the strike price of every auction, grid connection and terminal conversion. Allocation Round 7 (AR7), the seventh Contracts-forDifference auction3 , cleared at £91/MWh rather than the £44 administrative cap that produced a failed round in 2023.
2 https://www.ofgem.gov.uk/press-release/energy-price-cap-will-rise-13-july
3 https://www.bankofengland.co.uk/monetary-policy-summary-and-minutes/2026/june-2026
4 https://www.gov.uk/government/publications/contracts-for-difference-cfd-allocation-round-7-results
The labour market has loosened materially. Unemployment was 4.9% in the three months to May, vacancies fell to around 712,000, and regular pay growth slowed to 3.4%, the jointslowest since October 2020. For most sectors that would argue for rate cuts; the energy-driven inflation overlay is what stops it. For energy credit the labour risk is regional and supply-chain concentration. The jobs at risk cluster in Aberdeen, Grangemouth, the Humber and Pembroke and sit in the oilfield-services chain, where zero exploration activity has removed the core market –Petrofac was a services-employment event before it was a credit event . The Clean Energy Jobs Plan’s 400,000 roles by 2030 do not line up with the lost ones in place or time, and that mismatch is now politically contested, raising the likelihood that timelines slip.

Jobs (thousands)
Source: ONS
Note: Workforce jobs by industry, seasonally adjusted. SIC 2007 sections B (mining and quarrying), D (electricity and gas) and E (water supply and sewerage).
5 https://www.theguardian.com/business/2025/oct/27/oil-gas-petrofac-files-for-administration-jobs-north-sea
Six features of the global market matter for the UK position – five regional, and one that cuts across them.
The Gulf
Brent averaged around $85 in June, then swung violently – below $72 in early July as Gulf producers ramped exports under a brief interim agreement, and then back above $100 by 23 July after the ceasefire collapsed, the US resumed strikes and Houthi forces attacked Saudi tankers in the Red Sea. Tanker traffic through Hormuz has stalled and the recovery in Qatari LNG is delayed, pushing the same premium into gas. Prices are behaving as though disruption will persist and stay volatile.
$ per MMBtu, log scale
Sources: Brent – US EIA, Europe Brent spot FOB (RBRTE), daily. UK gas – ONS/National Gas Transmission, System Average Price, daily (Open Government Licence).
Note: Both series converted to a common energy basis in US dollars per MMBtu at 5.80 MMBtu per barrel and 293.071 kWh per MMBtu, using daily GBP/USD. Logarithmic vertical axis: equal distances represent equal proportional changes, so vertical gaps read as ratios, not dollar differences.
Neither counterweight has much room left. US crude production set a record in 2025, but the EIA expects 2026 slightly lower, so the marginal barrel is not American. OPEC spare capacity is forecast to average around 2.5m b/d into 2027, thin cover against a contested Strait. US LNG is the cargo Europe refills with, and exports are forecast at 17.0 Bcf/d this year against a 15.1 Bcf/d record in 2025.
EU gas storage stood at about 53% in late July 6 , some 15 points below the five-year average and the lowest for the time of year in five years, with injections running behind the pace a full refill requires. The binding 90% target survives but has been loosened – states may now meet it at any time between 1 October and 1 December, and a 10% flexibility margin – extendable by 5% in persistent adverse conditions – means the market treats 80% as the operative number. On the current pace storage reaches only around 78% by 1 November. Europe must refill in competition with Asia, and the UK, with almost no storage of its own, takes that price.
Under the REPowerEU7 regulation, short-term Russian LNG contracts ended on 25 April and pipeline contracts on 17 June, tightening European supply in the same quarter as the Gulf disruption.
The Gulf sets the price of the UK’s fossil energy; China increasingly sets the terms of its replacement. Beijing controls roughly 90% of global rare-earth processing and 80% or more of the battery supply chain, and dominates solar manufacturing 8 – the inputs to almost the entire UK net-zero programme. Through 2025 it turned that into policy: export controls on heavy rare earths and permanent magnets, licensing over lithium-ion battery materials, and restrictions on solar-grade polysilicon. A partial truce suspended some measures but left the licensing architecture intact.
That architecture is biting – approvals for European buyers run slow, heavy rare-earth prices have spiked, and the IEA expects the bottlenecks to persist through 2027. The exposure runs two ways. First, cost and timing in the transition itself – AR7, the grid programme and battery investment all depend on Chineseprocessed material, so a licensing decision in Beijing can stall a UK project as effectively as a fiscal decision in Whitehall. Second, the barrel – China is the swing consumer of oil and LNG, and any rebound in its demand tightens the cargoes the UK imports. The transition lowers dependence on the Gulf by deepening the dependence on China.
The supply-side response is slow. The IEA expects oil investment to fall for a third consecutive year in 2026 9; gas investment is at a decade high, but LNG capacity takes years. High prices are not, on this cycle, calling forth the supply that would end them.
6 https://www.reuters.com/business/energy/europe-unlikely-reach-80-gas-storage-target-equinor-ceo-says-2026-07-22/
7 https://commission.europa.eu/topics/energy/repowereu_en
8 https://www.iea.org/reports/global-critical-minerals-outlook-2026
9 https://www.iea.org/reports/world-energy-investment-2026

The new fact since November is fiscal, not geological: the North Sea Transition Authority’s (NSTA) February projections10 show total UKCS expenditure falling from £13.74bn in 2026 to £9.19bn by 2031, with capital expenditure alone down from £3.80bn to £1.68bn and exploration and appraisal spend more than halving to £107m. No exploration wells were drilled on the UK Continental Shelf in 2025 – the first time in decades – and none are planned for 2026. The basin is mature, but the pace of decline is being set by capital, not geology. Offshore Energies UK expects production near 620,000 boe/d by 2030, with up to 80% of demand met by imports. The Energy Profits Levy runs at 38% until 31 March 2030. Consent for Rosebank and Jackdaw was quashed by the Court of Session in January 2025 for omitting downstream emissions; both are now being re-consented11

Sources: DESNZ, Digest of UK Energy Statistics (DUKES) 2025.
Note: Total primary energy, all fuels, 1970-2024. Production and net imports in million tonnes of oil equivalent (left axis); import dependence as a share of total primary energy supply (right axis). Negative values denote net exports; the two axes share a common zero.
10 https://www.nstauthority.co.uk/data-and-insights/insights-and-analysis/production-and-expenditure-projections/
11 https://adura.com/public-consultation-opens-on-8-7-billion-rosebank-project-as-adura-urges-investment-in-uks-reindustrialisation/

The credit-relevant split is between operators and the chain beneath them. Operators earn elevated prices against a fixed cost base, so their cash generation holds up. The strain falls on the service chain. Zero exploration means no work for the rigs, vessels, inspection firms and specialist engineers behind the majors, in a basin where the top five operators now account for more than 70% of production. Petrofac’s October 2025 collapse was the first structural casualty of a service chain sized for a basin that no longer exists.
Sources: NSTA
Note: Outturn to 2025; 2026-2031 are NSTA projections. Exploration and appraisal covers seismic, licence and appraisal activity as well as exploration drilling, so spend is non-zero in years with no exploration wells drilled.
The scheduled event here is DESNZ’s (Department for Energy Security and Net Zero) downstream oil strategy, due in the autumn and landing into a leadership transition. Its February call for evidence named falling domestic demand, newer overseas plant, ageing infrastructure, high energy costs and hard-to-abate carbon costs as the pressures bearing on the four remaining sites – Fawley, Stanlow, Humber and Pembroke. Grangemouth and the Prax-owned Lindsey site, both lost in 2025, are why only four remain.
Two developments since November sharpen the case. First, the conflict has put a price on the import position. European kerosene roughly doubled in the spring, and with the UK importing 85-90% of its jet fuel and 55-59% of its diesel, there was no domestic buffer to deploy, only a longer and dearer line through the Netherlands and Antwerp.
Second, the carbon asymmetry is a live fight. Fuels Industry UK told the Energy Security and Net Zero Committee in April that UK refineries carry close to £400m a year in UK Emissions Trading Scheme (ETS) costs their overseas competitors do not. It warned that excluding refined products from the UK Carbon Border Adjustment Mechanism (CBAM), due in January 2027, is a decision the country “may live to regret”. Because refineries generate their own power and heat on site rather than buying it from the grid, the April relief on industrial electricity prices largely passes them by.
12 https://www.nstauthority.co.uk/news-publications/rough-consent-granted/
The NSTA granted, on 21 April, production and storage consent for Rough12 – the depleted field off the Yorkshire coast that provides about half of UK capacity – running only to 30 April 2027. The UK can store around 12 days of average gas demand, and around a week of peak winter demand. Germany holds 89 days, France 103, the Netherlands 123. Centrica would invest £2bn to redevelop Rough but requires a cap-and-floor model to underwrite it, and has run the asset at a loss in the meantime.

Sources: Centrica
Note: UK figure is 12 days of average demand, equivalent to around 7.5 days of peak winter demand; basis for comparator countries as published. Excludes LNG import and interconnector capacity, which meet the majority of UK gas supply. Comparator figures unchanged across Centrica publications since 2023.
Merchant storage does not pay for itself, because the summerwinter price spread is too small to cover its cost – until a shock hits, when going without it costs far more than building it would have. So it gets built only if the state underwrites it, and the state has just told DESNZ to find £2bn of budget savings, which puts discretionary policy first in line to be delayed or cut (see Politics).
The generation picture is genuinely improving. Renewables reached 53.1% of generation in Q1 2026, 7.4 points higher than a year earlier, with wind output up 30% on greater capacity and better wind speeds. Wind set a record 87TWh in 2025 and solar 19TWh. The share of the time gas sets the wholesale price has fallen from over 90% to around 60%.
Two things qualify it. First, imports are structural: interconnectors supplied roughly 11-15% of the mix in recent months, and Britain imports most heavily when renewable output is lowest –precisely when its neighbours are also short. Q1 2026 showed the limit: net imports from Norway fell 86% to 0.4TWh as a cold Norwegian winter and low hydro reservoirs cut availability. Second, the nuclear fleet is retiring. All but one existing plant closes by 2030, removing some 27TWh, with Hinkley not starting before 2030 and Sizewell not until 2039. The gap will be met by gas and imports.
On 21 April the government raised the Electricity Generator Levy from 45% to 55% from 1 July, and extended it beyond its 2028 sunset. Alongside it, a voluntary Wholesale Contract for Difference (CfD) was proposed for around 35GW of existing lowcarbon capacity with consultation due in H2.
The logic is coherent: legacy Renewables Obligation (RO) generators earn the gas-set wholesale price plus a renewables subsidy on top, which in a spike produces returns unrelated to any cost or risk they bear. Taxing that while offering a fixedprice alternative moves capacity onto contracts and recycles the proceeds to bill-payers (the levy applies only above £82.61/MWh, with a £10m group allowance).
The precedent is the harder part. This is the second increase to a tax introduced as temporary, and the government has now twice reached for generator revenue when prices spike. Any credit model treating merchant power revenue above roughly £83/ MWh as fully attributable to the generator overstates recovery in exactly the scenario where recovery matters.
The Auction Cleared, at a Price
Allocation Round 7 was the largest offshore-wind procurement in European history – 8.4GW awarded in January 2026 at a weighted average strike price of £90.91/MWh on 20-year contracts, plus 6.2GW of solar, onshore wind and tidal in February – 14.7GW and 201 projects in total. Two features matter more than the headline gigawatts. First, concentration – RWE took 6.9GW of the 8.4GW awarded in January. A material share of the UK’s 2030 capacity now rests on one developer’s programme: Ørsted and Vattenfall are recent reminders of what happens when one pulls back. Second, the strike price rose 11% y/y even with contracts extended from 15 to 20 years, a change the government expected to be worth a 12% reduction.
The programme continues but its cost is increasingly visible. Hinkley will not produce power before 2030 at a cost of £35bn in 2015 prices against £18bn at approval – roughly a doubling in real terms, or £48bn against £25bn restated in 2025 prices13 . Sizewell reached financial close in November 2025 at £38.2bn under a Regulated Asset Base model that, unlike Hinkley’s CfD, passes construction-cost risk to consumers. The NAO’s May 2026 review found Sizewell power will cost £133-155/MWh against Hinkley’s £129, with household bills peaking £19-21 a year and full operation not until 2039.
On 30 June, the Defence Investment Plan14 required DESNZ to find around £2bn of savings on top of the 1% capital cut across departments, with the government warning that “important but not immediately vital” energy projects would not go ahead as planned. It has since committed to funding the defence plan in full, though only two-thirds of its £15bn uplift has been secured –leaving £4.7bn to be found at Budget 2026. And so the constraint on DESNZ has hardened rather than eased.
For the energy supply chain – contractors, cable manufacturers, civils firms and specialist engineers whose order books are the pipeline – this is the material development of the quarter. The squeeze bites hardest in 2027-29, precisely when AR7 and the grid programme are due to deliver. The autumn detail and the Budget are scheduled risk events for any firm dependent on DESNZ funding.
13 EDF estimates are reported in 2015 prices. Restated using the ONS implied GDP deflator at market prices. Comparing the £18bn approval figure with £48bn in current money counts general inflation as cost escalation.
14 https://www.gov.uk/government/speeches/pm-speech-announcing-the-defence-investment-plan-30-june-2026

The headline insolvency numbers are improving. They are also backward-looking, and they understate what is coming. Company insolvencies in England and Wales were 1,845 in June 2026, little changed from May but 10% below June 2025; the 12-month rolling rate has edged down to 50.5 per 10,000 companies on the effective register – one in 198 – from 52.4 a year earlier. Even that is misleading – administrations jumped 45% on the month, most of it attributable to around 60 connected real-estate companies failing together. Levels remain well above the pre-pandemic norm, and because failure typically follows the onset of distress by two to three quarters, June’s figures reflect trading conditions in late 2025 – before the February escalation and before July’s cap rise reached bills.
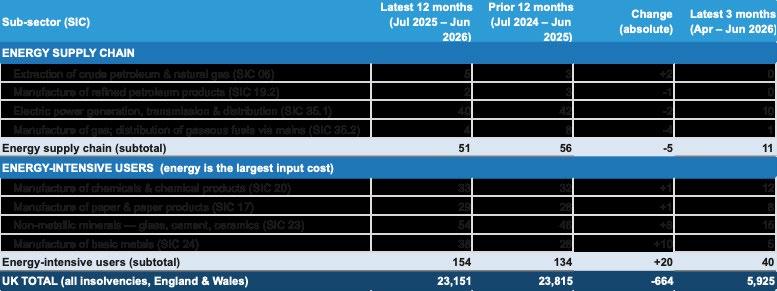
Sources: The Insolvency Service, ONS
Notes: Distress has migrated across the chain: as the overall wave recedes (UK total −664), supply-side insolvencies are still easing, while energy-intensive users are the pocket still rising (+20), led by basic metals and non-metallic minerals. Large energy-supply firms often restructure or enter special administration rather than ordinary insolvency, so counts understate supply-side stress.
BTG’s most recent Red Flag Alert (Q1 2026) recorded around 62,000 UK companies in critical financial distress, up roughly 37% y/y, with all 22 monitored sectors showing double-digit annual increases. Trade-credit insurers have reported late-payment notifications rising through H1 2026, which historically leads claims by the same margin. The count is likely to rise again before it falls.
Within energy, absolute failures remain low because the sector’s population is small and top-heavy. Expect a small number of large failures rather than a rising count, concentrated in refiningadjacent, fuel-distribution and offshore-service businesses, where Prax and Petrofac have each set a precedent inside the past year.
The energy sector’s own insolvency count is small –a few hundred a year – because the sector is small relative to the business universe and dominated at the top by very large firms.
Each rating below is a level of credit risk (the likelihood of default and loss). A low count understates a risk that is asymmetric – it concentrates wherever a firm buys energy at a spotlinked price and sells it at a contracted one.
High prices against a fixed cost base generate cash, so the pressure is fiscal, not liquidity. A 38% levy to 2030, no exploration, and decommissioning liabilities crystallising in a shrinking, more concentrated basin. The new variable is the move to approve Rosebank and Jackdaw, which would lift the whole sub-sector if it proceeds. Smaller singleasset producers with decommissioning obligations out of proportion to their reserves are the weak point.
The sharpest upstream exposure sits here. Zero exploration wells in 2025 and none planned for 2026 leave the drilling and appraisal chain without its core market, and NSTA projections show that spend more than halving by 2031. Firms compete for decommissioning and offshore-wind work with cost bases built for a different basin. Petrofac was the first failure of this kind, and unlikely to be the last.
Import dependence is a tailwind. Every refinery that closes becomes an import terminal; every tonne of diesel no longer refined domestically is handled by an independent tank storage operator. Volumes and utilisation are rising. The exception is merchant gas storage, where the economics need a regulatory model – the Rough problem, which stalls investment.
Two of the six sites gone in eighteen months. Thin, volatile margins, an ageing asset base and structural demand decline are the backdrop; the differentiators are £400m a year of UK ETS cost overseas competitors do not bear, exclusion from CBAM protection, and limited access to industrial energy relief because the sites generate their own power. The Prax failure was as much about group structure and a contested financing arrangement as about refining economics, so the parent group, not just the plant, is where the credit risk sat.
Sources: ONS, Index of Production
Note: Quarterly output indices, chained volume measures, seasonally adjusted, 2015 = 100. Energy-intensive manufacturing comprises paper and paper products, petrochemicals, basic metals and castings, and inorganic non-metallic products; other manufacturing is the remainder of the sector.
Diesel rose roughly 50p a litre between February and late April. For a distributor turning stock on thin percentage margins that is a step-change in the capital needed to move the same volume, arriving before any of it is recovered from customers. The exposure compounds: higher inventory value, higher receivables, unchanged facility limits, and a customer base – hauliers, agriculture, off-grid domestic – under the same pressure. This is the sharpest working-capital exposure in the chain, and the first credit events of this cycle are likely here.
The same shock passes straight to haulage, the biggest customer. Fuel is a quarter to a third of an operator’s cost base, and road freight reprices slowly under contract, so the diesel move lands directly on cash flow.
The change since November is regulatory. CMA enforcement on Fuel Finder15 compliance began in May, with the retail-margin investigation open. Margins have held through the conflict at 10.3-10.7p per litre, above the 6.5p average of 2015-19, and forecourt values with them. Volume decline as the electric fleet grows is slow. The weak tail is independent single-site operators without a convenience offer.
The 13% July cap rise feeds straight into supplier bad debt –arrears rise with each cap step, and suppliers carry that gap before Ofgem allows recovery. This is the mechanism that produced the 2021-22 wave of supplier failures, and October’s cap (due by 26 August) and the VAT change will move it again. Larger, hedged, vertically-integrated suppliers are insulated; smaller and standalone retail books are the exposure to watch.
CfD-contracted assets are about as close to a fixed-income credit as this sector offers, and AR7’s 20-year contracts lengthen that. Risk sits in three places: legacy RO and merchant plant now caught by the 55% levy while the Wholesale CfD is still only a consultation; the construction supply chain, exposed to the DESNZ squeeze and RWE’s AR7 dominance; and floating wind at a £216/MWh strike, a bet on the technology rather than the revenue.
Regulated returns, committed programmes and a demand outlook that points one way. The RIIO-T3 settlement and the £8bn Electricity Transmission Partnership keep the work under contract. The only new variable since November is the £2bn DESNZ squeeze, and it touches the contractors delivering the work, not the regulated returns of the owners commissioning it.
15 https://www.gov.uk/government/publications/registering-with-andreporting-your-fuel-prices-to-fuel-finder

Most energy credit risk does not sit in the energy sector. It sits in every counterparty that buys energy, and the UK’s structural premium means those counterparties absorb the shock from a higher base than continental peers.
UK wholesale baseload power has risen about 45% since the start of the year, from roughly £82/MWh to around £118/MWh. The forward curve matters more than the spot for credit – winter 2026 trades near current levels, summer 2027 at around £84 –close to where the year began. The market is pricing one hard winter and then an unwind, so a counterparty’s renewal date largely determines how much of the shock it absorbs. It starts from a poor base – on delivered prices including network charges, levies and taxes, the UK had the highest industrial electricity price of any reporting IEA country in 202416
The British Industry Supercharger’s network-charging compensation rose from 60% to 90% in April 2026, worth around £420m a year to some 500 firms, and the British Industrial Competitiveness Scheme (BICS) extends relief to 7,000-10,000 supply-chain manufacturers from April 2027. Both are worth real money, but neither touches the wholesale price. Chemicals, glass, ceramics, cement, paper, steel and food manufacturing –the largest industrial energy user in the UK – absorb this when their contracts renew, not when the price moves.
Higher energy prices tie up cash long before they show up in profit. A business buying the same volume pays more and carries that cost until its own prices catch up. That is the fuel distributor’s problem in its purest form, but also the manufacturer’s, the haulier’s and the caterer’s. Facilities sized for 2024 prices do not stretch to 2026 volumes at 2026 prices.
Dependence on supply chains the UK does not control amplifies this in two directions. The physical one – imports, thin storage, interconnectors that deliver least when neighbours are short – is set out above. The industrial one is less obvious – the low-carbon programme meant to reduce the fossil exposure itself runs on Chinese-processed rare earths, magnets, cells and modules.
The counterparty that fails first is the one that cannot pass on the cost. Fixed-price, fixed-menu and annually-negotiated contracts are where the damage lands, as in the specialist-subcontractor failures of 2022-23.
16 https://www.gov.uk/government/statistical-data-sets/international-nondomestic-energy-prices


A Transition into a £2bn Squeeze
Andy Burnham became Prime Minister on 20 July, succeeding Keir Starmer, who resigned on 22 June. With no general election due for around three years this is a change of governing-party leader rather than of government. The more consequential change for the sector is the change of leadership at DESNZ. It lands midway through a downstream oil strategy, a Wholesale CfD consultation and a generator levy that has just risen – and a fortnight after the department was told to find roughly £2bn under the 30 June Defence Investment Plan.
Two further changes are signalled but not settled. The government supports producing Rosebank and Jackdaw and expanding tie-backs, while holding the no-new licences position, though consent rests with the Energy Secretary and cannot be granted until the consultations close. Public ownership of water, and less definitely energy supply, sits at the same stage.
Six regulatory tracks have moved since the last edition in November.
1. The Ofgem price cap rose 13% from 1 July, with the October cap due by 26 August, forecast at about £1,700.
2. VAT on domestic electricity comes off from 1 October.
3. The Electricity Generator Levy rose from 45% to 55% on generation from 1 July and was extended past its 2028 sunset.
4. CMA enforcement on Fuel Finder compliance began in May 2026, with the retail-margin investigation ongoing.
5. A voluntary Wholesale CfD for ~35GW of legacy low-carbon capacity, with consultation due in H2 2026.
6. The downstream oil strategy, due in the autumn, against live fights over refiners’ ~£400m/year of ETS cost and their exclusion from the January 2027 UK CBAM.
The UK energy chain enters H2 2026 with the conflict premium back on and the structural exposure untouched. The market has seen that premium unwind and reimpose within a single quarter, so the range is wide and reversion fast in both directions. The scenarios below differ by how the conflict evolves. The exposure underneath them is identical – import dependence rising as production falls, 12 days of storage, four refineries, and a wholesale power price still set by gas.
An
Standoff, a Winter with No Buffer
Hostilities continue at their current intermittent intensity, with the Strait contested rather than fully closed. Brent oscillates in a wide $85-105 range; NBP holds above 130p/therm and firms into the winter as Europe refills from a thin base. The October price cap rises again, softened by the VAT cut; headline inflation peaks a little above 3% in Q4, and the MPC holds at 3.75% through 2026 with a bias to hike; no easing before spring 2027.
Wholesale power eases but stays well above where it began the year. Energy-sector insolvencies stay low in number and concentrated in fuel distribution and offshore services. The wider damage is outside the energy sector – margin compression in energy-intensive manufacturing and trade-credit losses in fixedprice counterparties, rising through H2 and peaking in Q1 2027 as winter bills land.
The interim agreement is consolidated, Hormuz transit normalises, and Gulf LNG and crude return at scale into a mild European winter. Brent settles towards $70 and NBP below 90p/therm. The January cap falls; CPI returns toward target through 2027, and the Bank resumes cutting toward 3.25-3.50%. Industrial demand stabilises, and wholesale power returns close to its pre-conflict level.
Hormuz is contested or closed for a sustained period, or Europe enters winter below 80% storage and the weather turns. Brent holds above $110 and NBP moves toward and beyond 200p/ therm on a cold snap as LNG diverts to Asia. The January price cap steps up sharply, fuel poverty widens materially, and the MPC’s hawkish bias implies a hike toward 4.25%. The UK’s 12 days of storage becomes the binding constraint, and industrial demand destruction does the balancing that storage cannot – as it has since 2021, when energy-intensive output fell roughly a third while the rest of manufacturing held flat.
The sub-sector distinctions then collapse: fuel distribution and refining move to acute risk, energy-intensive manufacturers fail in numbers, and the government is forced into an emergency support package it cannot afford, having just moved £2bn away from the department. Trade-credit losses look like 2022-23 with a fuel-distribution and manufacturing concentration rather than a construction one.

Tokio Marine HCC is a leading specialty insurance group conducting business in approximately 180 countries and underwriting more than 100 classes of specialty insurance. Headquartered in Houston, Texas, the company comprises highly entrepreneurial teams equipped to underwrite special situations, companies and individuals, acting independently to deliver effective solutions. Our products and capabilities set the standard for the industry, as many of our employees are industry-leading experts.
More information about our financial strength here:


New Business Team
The Grange Rearsby
Leicester LE7 4FY
Tel: +44(0)1664 423 333 creditsales@tmhcc.com
Dan Forrester
The Grange Rearsby
Leicester LE7 4FY
Tel: +44(0)1664 423 333 dforrester@tmhcc.com
LONDON
Ray Massey
The St Botolph Building 138 Houndsditch
London EC3A 7BT
Tel: +44(0)20 7680 2939 rmassey@tmhcc.com
Shane West
The St Botolph Building 138 Houndsditch
London EC3A 7BT
Tel: +44(0)20 7680 2954 swest@tmhcc.com
MANCHESTER
Nick Dando Lowry House Suite 6.02, Marble Street Manchester M2 3AW
Tel: +44(0)7701 313 342 ndando@tmhcc.com
Gerard Gibney Summit House, Embassy Office Park Kill, County Kildare Ireland W91 VK0 Tel: +3538 7451 0803 ggibney@tmhcc.com