Research Paper
Economics
E-ISSN No : 2454-9916 | Volume : 3 | Issue : 7 | July 2017
MIGRATION AND URBAN INFORMAL SECTOR WORKERS IN ASSAM - A CASE STUDY IN JORHAT DISTRICT Ms. Jyotsnali Chetia Assistant Professor, Department of Economics, Sibsagar Girls` College, Sivasagar, Assam-785640. ABSTRACT The literature on development economics indicates that migration takes from low productive to high productive areas, from areas of low levels of wages to higher wages and from poor and backward to more rich and prosperous areas. One of the important explanations for the origin of informal sector is found in the framework of rural- urban migration (Changkery,2012).That is why sincere analysis is required to understand the dynamics of migration of workers in informal sector. The study has identified factors responsible for migration of urban informal sector worker based on 187 sample respondents of Jorhat district of Assam. The findings of the study reveal that the push factors prevailing in the area of origin compels the informal sector workers to migrate to urban areas. KEYWORDS: Migration, Urban Informal sector workers. 1. INTRODUCTION: Migration in India is predominantly to short distances, with around 60 percent of the migrants changing their residence within their district of birth and 20 percent within their state, while the rest move across the state boundaries (Thorat, et.al,2011). The NSSO (2012, p ii) document finds that in 2009-10 in the nonagriculture sector, nearly 71% of the workers in rural areas and 67% in the urban areas worked in the informal sector. It finds that the informal sector activities are concentrated mainly in the manufacturing, construction, wholesale and retail trades, transport, storage and communication industries. The migrants primarily start work in the informal sector in cities as they do not possess adequate skills required to get jobs in formal sector. The most prominent theory that explains the relationship between migration and informal sector is the Harris-Todaro theory of rural-urban migration. According to this theory the informal sector acts as a temporary transit point for the workers before entering into the formal sector. This model assumes the existence of dual sectors in the economy i.e. the rural sector and the modern urban sector. Within the modern sector there consist of two sub-sectors: (i) modern sector, and (ii) traditional sector. The traditional sector consists of all the workers who are not employed in the modern sector. This theory describes that decision to migrate depends on the expected income rather than actual urban-rural real wage differential and the probability of obtaining an urban job (Todaro,1969). Research studies have confirmed that migration is an important source of livelihood for poor people all around the globe. A substantial part of the increased labour force, due to migration, in the modern sector is likely to be absorbed in the informal work in the unorganized sector where people create their own employment opportunities to the extent that their capital and skills allow. In such circumstances, people who join workforce often end up earning lower than the minimum wage (Kundu & Sarangi,2007). Migrants usually take up jobs in factories, agro-processing plants, or working as porters, domestic servants, bus conductors, rickshaw pullers, street hawkers, petty traders, and construction workers Deshingkar(2005). Majority of the migrants are from rural poor families who do not have any option but to take up such kind of jobs even though wages are minimal. 1.1 Objectives of the study The present study seeks to study i.
The demography of urban informal sector workers in Assam .
ii. The level of living of urban informal sector workers. iii. The factors responsible for migration of workers in urban informal sector. 1.2 Research question of the study i. Whether the push factors prevailing in the area of origin compels the workers to migrate?
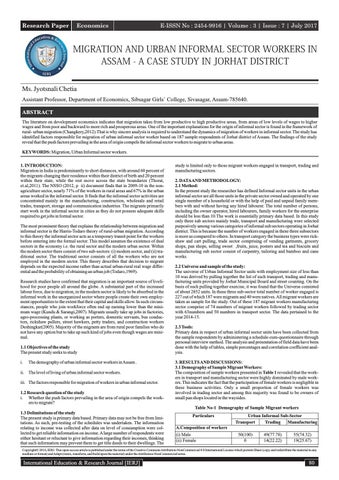
study is limited only to those migrant workers engaged in transport, trading and manufacturing sectors. 2. DATA AND METHODOLOGY: 2.1 Method: In the present study the researcher has defined Informal sector units in the urban informal sector are all those units in the private sector owned and operated by one single member of a household or with the help of paid and unpaid family members with and without having any hired labourer. The total number of persons, including the owner operator, hired labourers, family workers for the enterprise should be less than 10.The work is essentially primary data based. In this study only three sub sectors mainly trade, transport and manufacturing were selected purposively among various categories of informal sub sectors operating in Jorhat district. This is because the number of workers engaged in these three subsectors is more as compared to others. In transport category the business types were rickshaw and cart pulling, trade sector comprising of vending garments, grocery shops, pan shops, selling sweet ,fruits, juice, posters and tea and biscuits and manufacturing sub sector consist of carpentry, tailoring and bamboo and cane works. 2.2 Universe and sample of the study: The universe of Urban Informal Sector units with employment size of less than 10 was derived by pulling together the list of such transport, trading and manufacturing units provided by Jorhat Municipal Board and street counting. On the basis of such pulling together exercise, it was found that the Universe consisted of about 2852 units. In these three sub-sector total number of worker engaged is 227 out of which 187 were migrants and 40 were natives. All migrant workers are taken as sample for the study. Out of these 187 migrant workers manufacturing sector comprise of 74 numbers of migrant workers followed by trading sector with 63numbers and 50 numbers in transport sector. The data pertained to the year 2014-15. 2.3 Tools: Primary data in respect of urban informal sector units have been collected from the sample respondents by administering a schedule-cum-questionnaire through personal interview method. The analysis and presentation of field data have been done with the help of tables, simple percentages and correlation coefficient analysis. 3. RESULTS AND DISCUSSIONS: 3.1 Demography of Sample Migrant Workers: The composition of sample workers presented in Table 1 revealed that the workers in transport and manufacturing sector were highly dominated by male workers. This indicates the fact that the participation of female workers is negligible in these business activities. Only a small proportion of female workers was involved in trading sector and among this majority was found to be owners of small pan shops located in the waysides. Table No-1 Demography of Sample Migrant workers
1.3 Delimitations of the study The present study is primary data based. Primary data may not be free from limitations. As such, pre-testing of the schedules was undertaken. The information relating to income was collected after data on level of consumption were collected to get reliable information on income. A large number of respondents were either hesitant or reluctant to give information regarding their incomes, thinking that such information may prevent them to get title deeds to their dwellings. The
Particulars A.Composition of workers (i) Male (ii) Female
Urban Informal Sub-Sector Transport Trading Manufacturing 50(100) 0
49(77.78) 14(22.22)
55(74.32) 19(25.67)
CopyrightŠ 2016, IERJ. This open-access article is published under the terms of the Creative Commons Attribution-NonCommercial 4.0 International License which permits Share (copy and redistribute the material in any medium or format) and Adapt (remix, transform, and build upon the material) under the Attribution-NonCommercial terms.
International Education & Research Journal [IERJ]
80
Research Paper B.Type of workers (i) Hired Labour (ii) Self Employed (iii) Unpaid family Labour C.Age of workers (i) 15 yrs-25yrs (ii) 25 yrs-35yrs (iii) 35yrs-45yrs (iv) 45yrs-55yrs (v) 55 yrs above D. Education of workers (i) Illiterate (ii) Below 10th Standard (iii) 10th standard (iv) 10+2 standard (v) Graduate
E-ISSN No : 2454-9916 | Volume : 3 | Issue : 7 | July 2017 13(26) 35(70) 2(4)
7(11.1) 53(84.13) 3(4.76)
34(45.95) 29(39.19) 11(14.86)
8(16) 21(42) 18(36) 3(6) 0
35(55.56) 18(28.57) 5(7.94) 4(6.35) 1(1.59)
7(9.46) 41(55.41) 16(21.62) 9(12.16) 1(1.35)
7(14) 28(56) 11(22) 4(8) 0
19(30.16) 33(52.38) 7(11.1) 4(6.35) 19(30.16)
0 24(32.43) 27(36.49) 19(25.68) 4(5.41)
3.3 Migration analysis in the basis of push and pull factors: Lee (1966) explained the reason for migration involves push and pull factors. The `push`(negative) factors compels the migrants in rural areas to leave their home due to poverty, unemployment and scarcity of land to find in urban areas. The `pull (positive)` factors attract the migrants to a destination due to better job and income opportunities. Migration can be due to either push or pull factors but Lee presumes it can be a combination of both. From table -3 `unemployed in search of better job in the city` mentioned about 60.43 percent of migrants was found to be the single most important cause for migration followed by`` In search of better income` by 30.48 percent. Table-3 Frequency Distribution of Migrant workers by Cause/motives Sl. No A B C D E
Source-Field survey N.B- Figures in the bracket shows percentage The informal sector space in Jorhat is dominated by self employed persons (62.57 %) closely followed by hired workers (28.88 %). The hired workers are those workers who migrate to Assam in search of a job and do not have enough capital to start their own business. These workers might first working as hired workers and then starting their own undertakings after accumulating the required capital. In manufacturing sector 45.95% employed as hired workers indicates that setting up a business in the manufacturing sector is not as easy as one need to posses certain skills and capital before starting their own. The informal sector as a whole bulk of migrants i.e. 42.78 % were in the age group of 25-35 followed by 26.74 % in 15-25 age group. Only 1.07 % of migrants were falls in the age group of 55-above which indicates that the workers in the informal sector are predominantly young. Regarding education of informal sector migrant workers as a whole, the illiterates accounted for 13.90%, 45.45% were below 10th standard, 24.06% had passed 10th standard, 14.44% had passed 10+2 standard and 2.14% were graduate. In the trading sector 30.16% were illiterates followed by 14 % in transport sector and in the manufacturing sector workers 5.41% were Graduate. 3.2 Average income, expenditure and Savings of Sample Migrant Workers: The average income, expenditure and saving pattern of sample workers was worked out and is presented in Table 2. It was revealed from Table 2 that the average annual income of manufacturing sector workers is higher (Rs.146768) followed by trading (Rs.71408) and transport sector workers (Rs. 49668). Table 2. Income, expenditure and net saving pattern of the sample Migrant Workers Urban Informal subsector Income Transport (i) Rickshaw Puller (ii) Cart Puller Total (i)+(ii) Trading (i) Garment Vendors (ii) Grocery & pan shopers (iii) Fruit, juice & tea sellers Total (i)+(ii)+(iii) (i) Garment Vendors Manufacturing (i) Carpentry (ii) Tailoring (iii) Bamboo & cane works Total (i)+(ii)+(iii)
Expenditure Net Food items Non food items Savings
23098 26570 49668
13443 12671 26114
4581 6736 11317
5074 7163 12237
24379 25810 21219 71408 24379
10389 12504 10357 33250 10389
7989 6731 4383 19103 7989
6001 6575 6479 19055 6001
65153 39254 43271 147678
16443 13644 14010 44097
29796 14124 18663 62583
18914 11486 10598 40998
Source-Field survey N.B- Figures in the bracket shows percentage The total expenditure of sample households included expenditure on food commodities and expenditure on non-food commodities. Non food items comprising of expenditure on education of children, entertainment, healthcare and others includes daily expenses for meeting day to day operations of the units. The total food consumption expenditure of sample migrant workers in manufacturing sector is Rs. 44097 per annum followed by Rs.33250 in trading sector and Rs.26114 in transport sector. In case of non food items expenditure is highest in the manufacturing sector (Rs.62583) and lowest in transport sector (Rs.11317). The net saving is higher in case of manufacturing sector workers Rs.40998 as compared to trading (Rs.19055) and transport sector workers (Rs.12237)
81
Push/Cause factors Pull/Motive factors
Reasons for migration Unemployed thus in search of better job In search of better income To eventually get into formal sector job Landless hence in search of job in city Others Total (A,B) (C,D)
Response 117(60.43) 57(30.48) 0 17(9.09) N/A 187(100) 174(93.05) 17(9.09)
Source-Field survey N.B- Figures in the bracket shows percentage To find out the causes of migration to the informal sector correlation coefficient is used. It is evident from table 4 that the migrants are found to have a statistically positive correlation with unemployment at 0.183 (**) and better income at 0.207 (**). This analysis implies that the migrants have migrated both due to unemployment at native place and in search for better income. The other reasons were found to be insignificant for the migrants in present study. In the table X1 refers migrant, X2 denotes unemployment at native place, X3 denotes better income opportunities in migrated area and X4 denotes landlessness at native place. As revealed by the study, both in the presence of push and pull factors, the push factor is found to be stronger than pull factors. Harris- Todaro (1970) also felt that the push factors operating in rural areas were strong enough to send large supplies of labour to urban areas. Table-4 Correlation between reasons for migration of the migrant workers X1 1.000 X1
X2 .183** 0.001 187 1
187 0.183** X2 0.001 187 187 0.207** (-).371 X3 0.000 0.000 187 187 0.119 (-).235** 0.125 0.004 X4 187 187 ** Correlation is significant at the 0.01 level
X3 .207** 0.000 187 (-).371** 0.000 187 1 187 (-).210** 0.002 187
X4 0.119 0.125 187 (-).235 0.004 187 (-).210** 0.002 187 1 187
CONCLUSION: Even though the informal sector is generating jobs and incomes for the urban poor, with meager capital investment, the quality of employment still needs to be improved. Moreover in the ongoing market economy, opening up of markets would make the input and product markets more competitive and places the informal sector workers in a vulnerable position. Therefore to improve these informal sector participants restructuring of financial institutions for micro business, improvement of infrastructure facilities and establishment of marketing channels are needed. There is every need for decentralized and need based promotional policies for their growth and sustainability. REFERENCES: 1. 2. 3. 4. 5. 6. 7. 8.
Ashalatha,D.(2012): Women in Urban Informal Sector, Akansha Publishing House, New Delhi. Changkery,I. (2012) “Economics of Urban Informal Sector in Nagaland – A Case Study of Dimapur City” P.hD., NEHU,Meghalaya. Deshingkar,S.(2005): Seasonal Migration:How rural is rural?ODI. Opinion 52. Kundu, A.,& Sarangi, N.(2007): Migration, employment status and Poverty- An Analysis across Urban Centers, Economic and Political Weekly,42(4). Lee,E.S. (1966):A Theory of Migration. In J.A. Jackson(Ed.) Migration, Cambridge University Press, Cambridge. Lewis, W.A. (1954): “Economic Development with Unlimited Supplies of Labour”, In A.N.Agarwalla & Singh. S.P. (Ed.), The Manchester School of Economics and Social Studies. Thorat, V.A., Dhekale, J.S.,Patil,H.K. & Tilekar,S.N.(2011)``Determinants of ruralUrban Migration in Konkan Region of Maharastra”Agricultural Economics Research Review,Vol-24,pp-503-509. Todaro,M. (1969:`` A Model of Labour Migration and Urban Unemployment in Less Developed Countries”, American Economic Review,Vol-59.
International Education & Research Journal [IERJ]